Monitoring and visualization solutions
Monitoring and visualization solutions / New Relic / Visualize New Relic
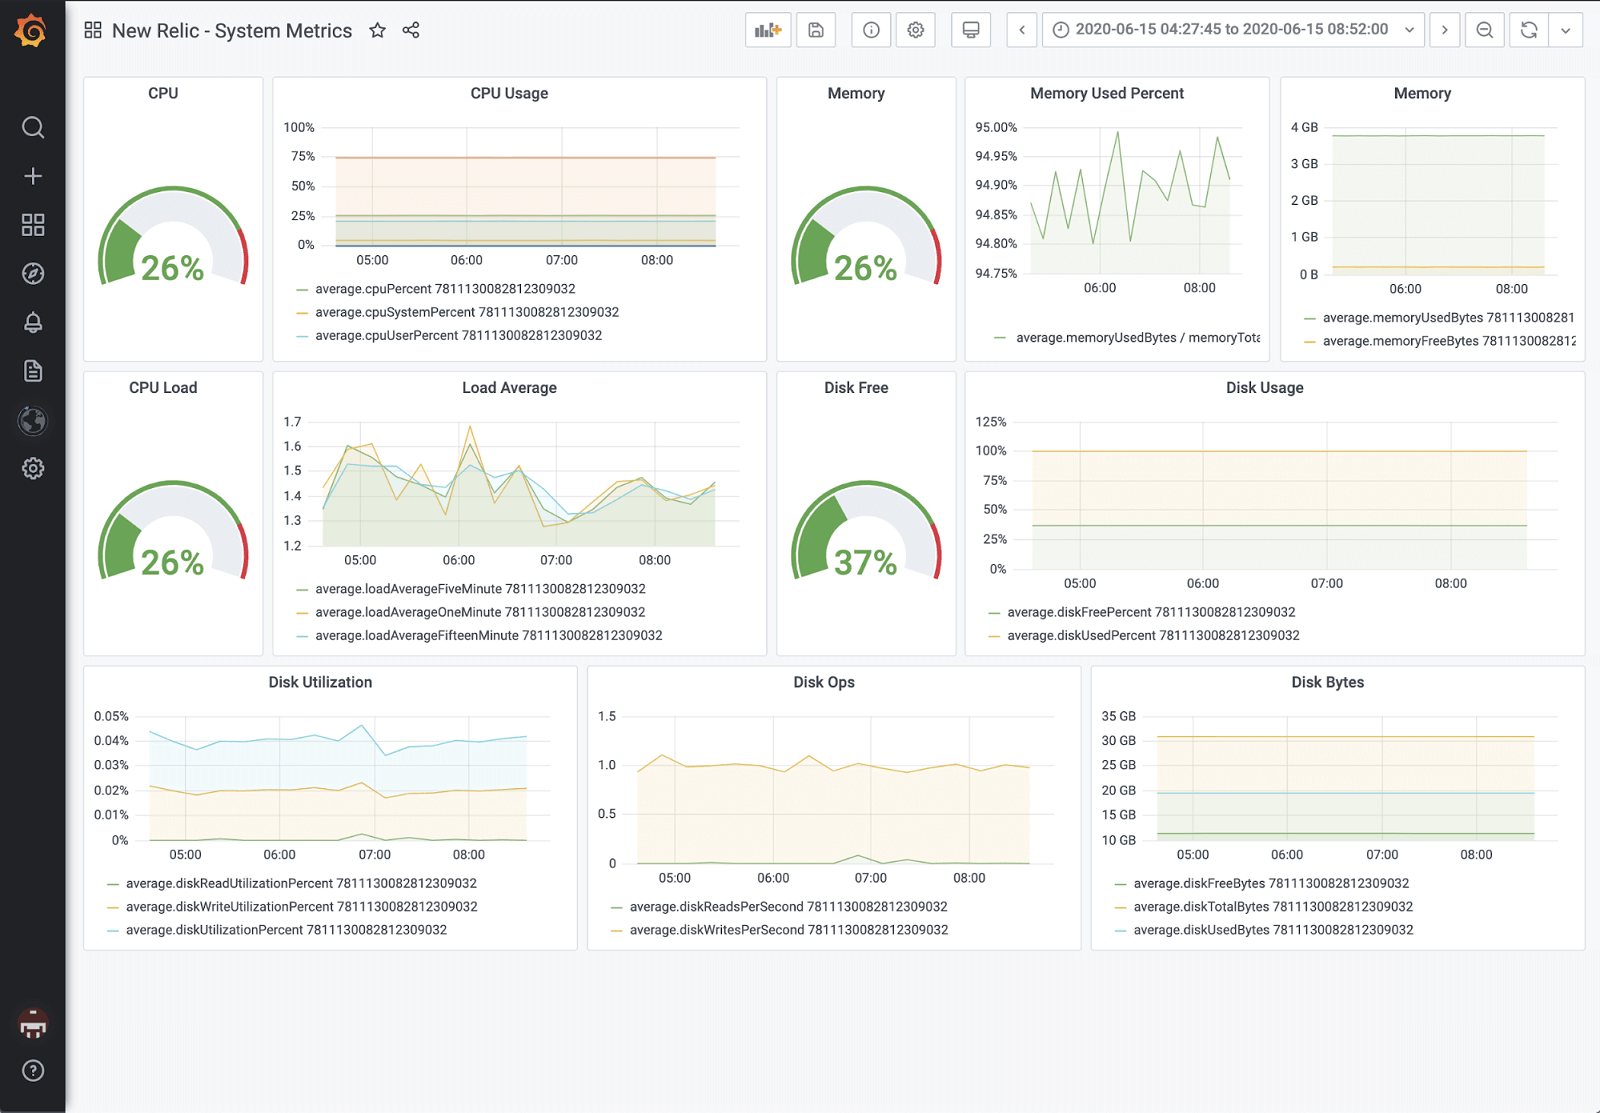
Visualize New Relic easily with Grafana
With the Grafana Enterprise plugin for New Relic, a popular application performance monitoring (APM) tool, you can quickly query and visualize New Relic data in Grafana.
Get started with these easy steps
1
Get started with these easy steps
1
Get started with these easy steps
1
2
3
That’s it! You’ll immediately see pre-built Grafana dashboards and alerts tailored for New Relic.
Get started with these easy steps
1
That’s it! You’ll immediately see pre-built Grafana dashboards and alerts tailored for New Relic.
Get started with these easy steps
1
2
3
That’s it! You’ll immediately see pre-built Grafana dashboards and alerts tailored for New Relic.
Get started with these easy steps
1
2
3
That’s it! You’ll immediately see pre-built Grafana dashboards and alerts tailored for New Relic.
Get started with these easy steps
1
That’s it! You’ll immediately see pre-built Grafana dashboards and alerts tailored for New Relic.
Get started with these easy steps
1
2
3
That’s it! You’ll immediately see pre-built Grafana dashboards and alerts tailored for New Relic.
Get started with these easy steps
1
That’s it! You’ll immediately see pre-built Grafana dashboards and alerts tailored for New Relic.
Get started with these easy steps
1
2
3
That’s it! You’ll immediately see pre-built Grafana dashboards and alerts tailored for New Relic.