When to use continuous profiling
Continuous profiling is a systematic method of collecting and analyzing performance data from production systems.
Traditionally, profiling is used to debug applications on an as-needed basis.
For example, you can run a benchmark tool locally and get a pprof file in Go or connect to a misbehaving prod instance and pull a flame graph from a JFR file in Java.
This method is good for debugging, but not robust enough for production.
Refer to Flame graphs to learn more.
Continuous profiling is a modern approach which is safer and more scalable for production environments. It uses low-overhead sampling to collect profiles from production systems and stores the profiles in a database for later analysis. Using continuous profiling gives you a more holistic view of your application and how it behaves in production.
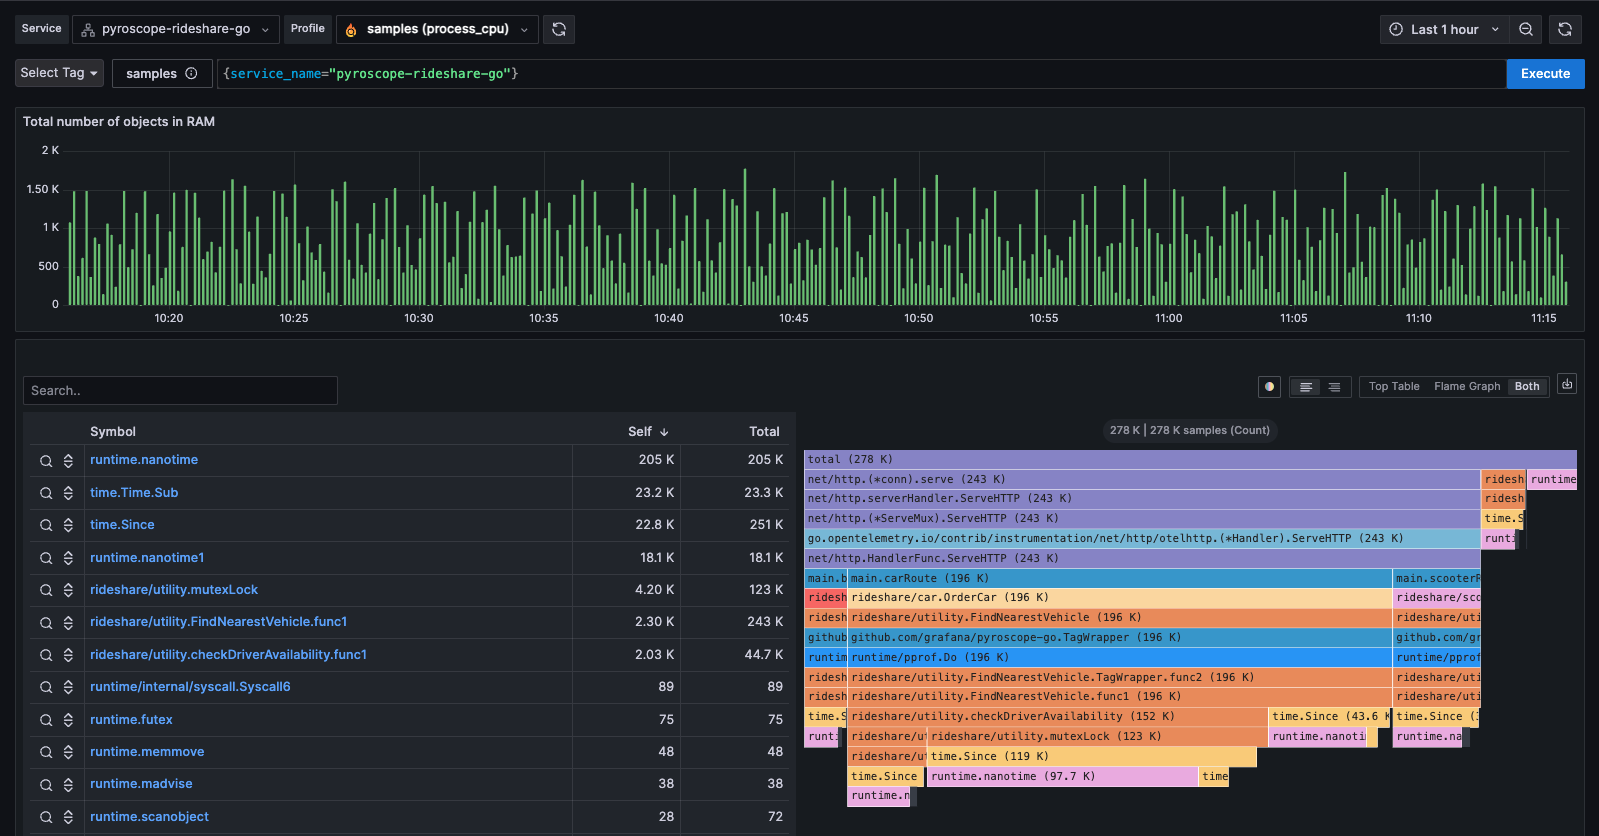
Grafana offers Grafana Pyroscope and Grafana Cloud Profiles (powered by Pyroscope) to collect and store your profiling data. You can use Grafana Profiles Drilldown to inspect profile data and investigate issues.
Benefits
Why prioritize continuous profiling?
- In-depth code insights: It provides granular, line-level insights into how application code utilizes resources, offering the most detailed view of application performance.
- Complements other observability tools: Continuous profiling fills critical gaps left by metrics, logs, and tracing, creating a more comprehensive observability strategy.
- Proactive performance optimization: Regular profiling enables teams to proactively identify and resolve performance bottlenecks, leading to more efficient and reliable applications.
![Diagram showing 3 benefits of continuous profiling]()

Use cases
Adopting continuous profiling with tools like Grafana Pyroscope and Profiles Drilldown can lead to significant business advantages:
- Reduced operational costs: Optimization of resource usage can significantly cut down cloud and infrastructure expenses
- Reduced latency: Identifying and addressing performance bottlenecks leads to faster and more efficient applications
- Enhanced incident management: Faster problem identification and resolution, reducing Mean Time to Resolution (MTTR) and improving end-user experience
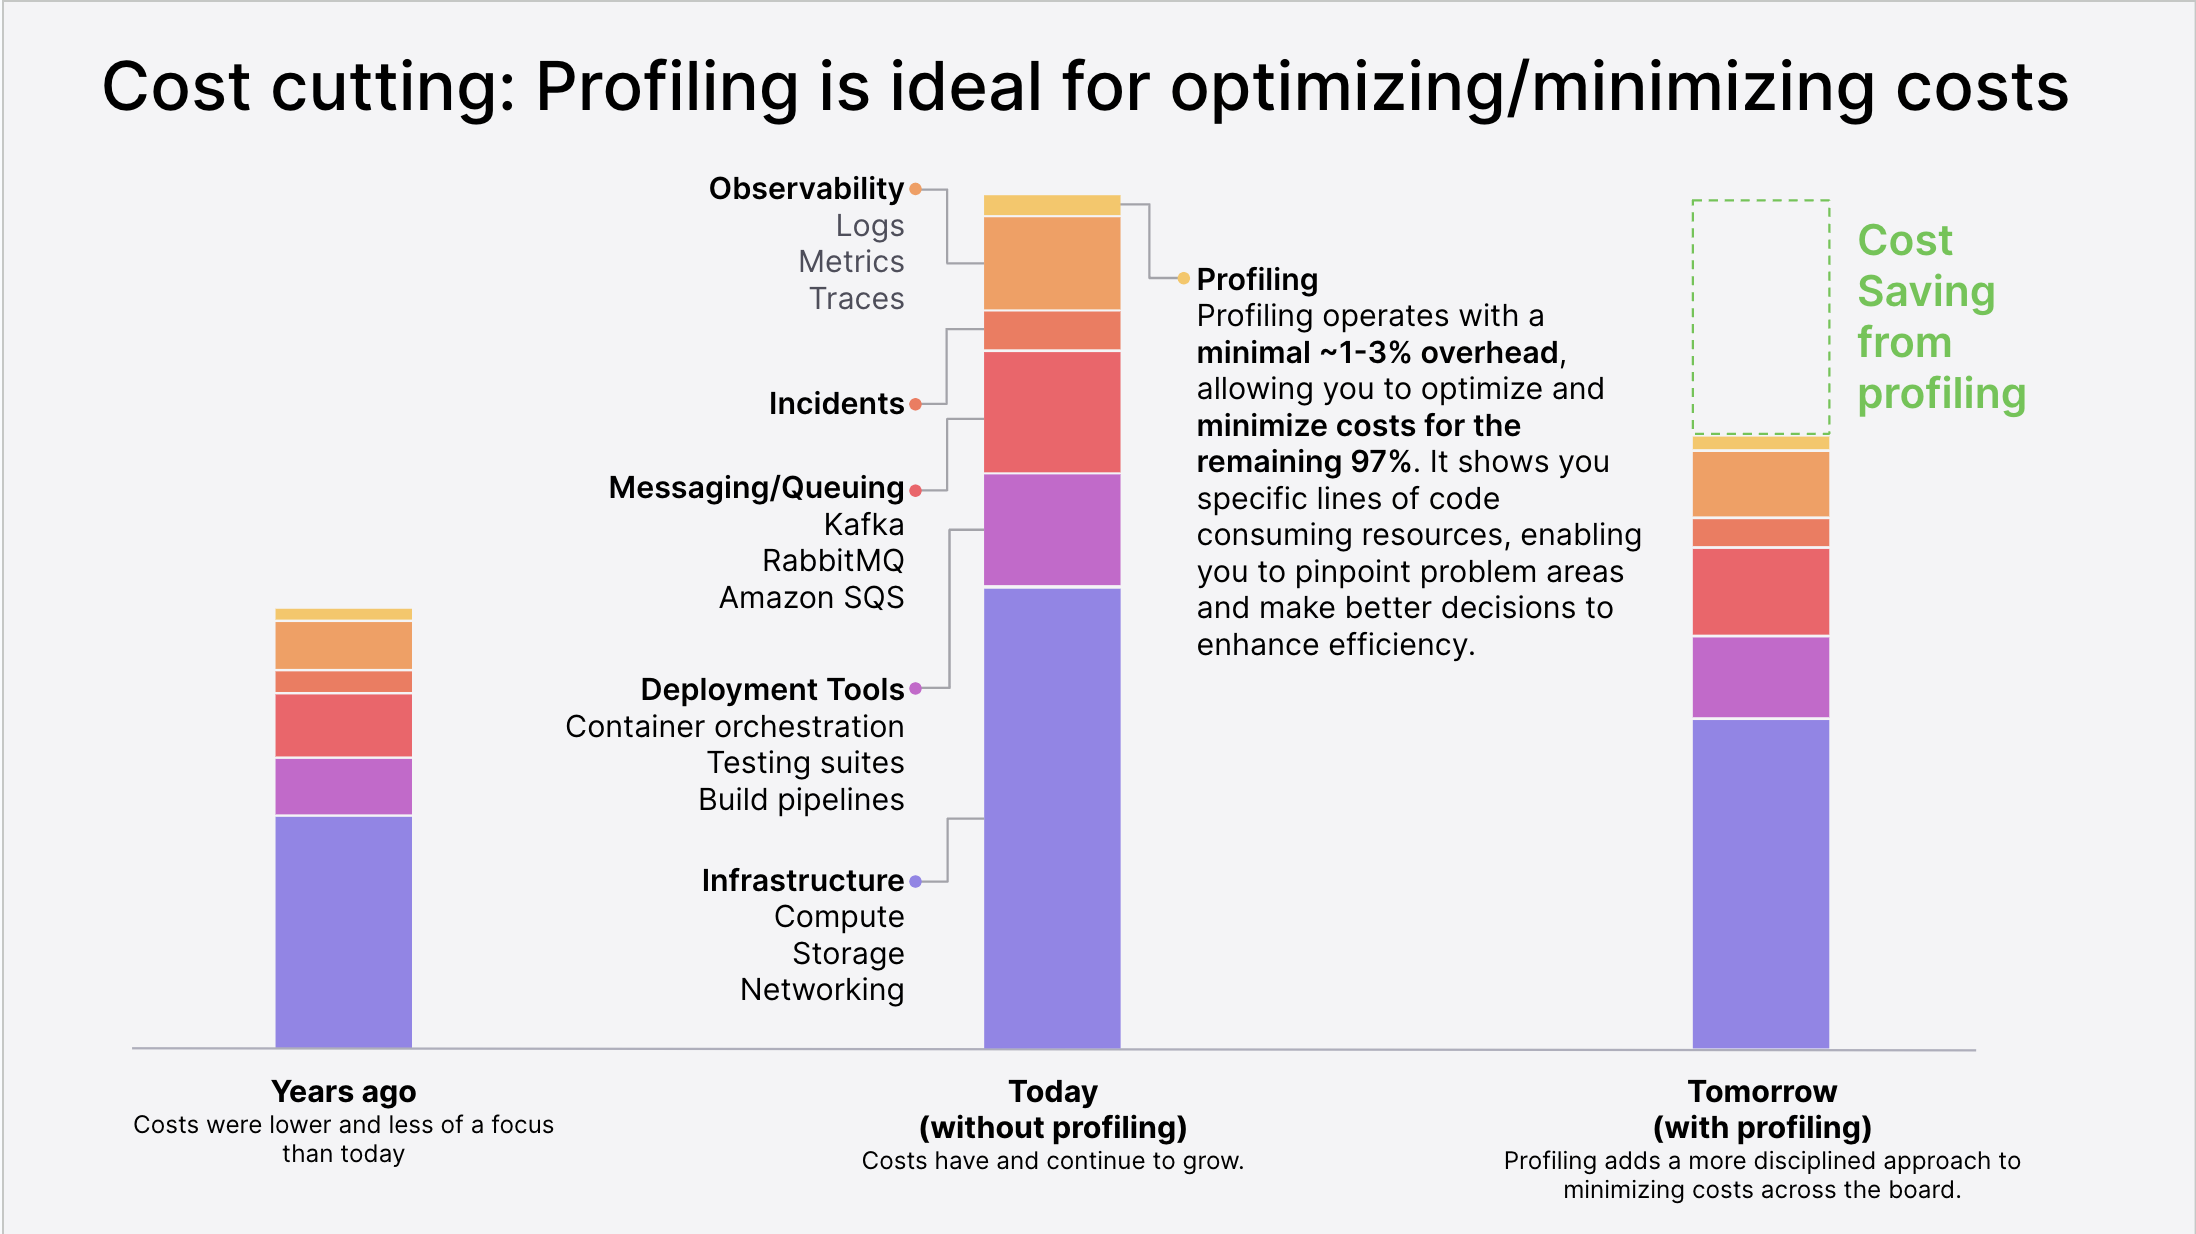
Reduced operational costs
By providing in-depth insights into application performance, profiling empowers teams to identify and eliminate inefficiencies, leading to significant savings in areas like observability, incident management, messaging/queuing, deployment tools, and infrastructure.
By using sampling profilers, Pyroscope and Cloud Profiles can collect data with minimal overhead (~2-5% depending on a few factors). The custom storage engine compresses and stores the data efficiently. Some advantages of this are:
- Low CPU overhead thanks to sampling profiler technology
- Control over profiling data granularity (10s to multiple years)
- Efficient compression, low disk space requirements and cost
Reduced latency
Profiles play a pivotal role in reducing application latency by identifying performance bottlenecks at the code level. This granular insight allows for targeted optimization, leading to faster application response times, improved user experience, and consequently, better business outcomes like increased customer satisfaction and revenue.
Enhanced incident management
Pyroscope and Profiles Drilldown streamline incident management by offering immediate, actionable insights into application performance issues. With continuous profiling, teams can quickly pinpoint the root cause of an incident, reducing the mean time to resolution (MTTR) and enhancing overall system reliability and user satisfaction.


