Configure AWS PrivateLink
You can send telemetry data from your AWS Virtual Private Cloud (VPC) to Grafana Cloud via AWS PrivateLink.
Sending your data via AWS PrivateLink can:
- Reduce your AWS egress costs
- Improve security by keeping your data within the Amazon network
To use this feature, configure an interface endpoint in your AWS VPC. Your local agents can use this to route data to Grafana Cloud via AWS PrivateLink.
Prerequisites
In order to use AWS PrivateLink, you will need:
A Grafana Cloud stack hosted on AWS. Check where your stack is hosted by navigating to it in the My Account section of grafana.com and clicking on Details for a given service, like Prometheus or Loki. If the region matches one of the AWS regions where Grafana Cloud is hosted, then your stack is hosted on AWS.
If your stack is not hosted on AWS, you can create a new stack, forward telemetry to it, and query it from your existing stack.
An AWS VPC, where you will create an interface endpoint to forward your telemetry data.
When connecting within the same region (for example, both your infrastructure and your Grafana Cloud stack are in
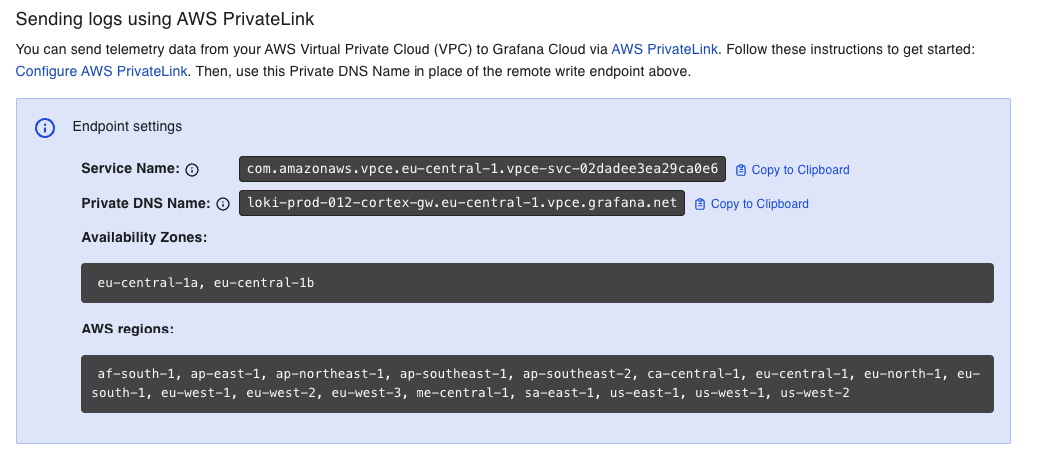
eu-central-1), you must connect to all of the Availability Zones exposed by our PrivateLink VPC Endpoint Service. This limitation does not apply when connecting from a different region. To check which Availability Zones are exposed:- Sign in to your Grafana Cloud account.
- Click the Details button on a service tile.
- Scroll down to the Sending metrics using AWS PrivateLink section, which lists the supported AWS Availability Zones for your stack.
Other regions
AWS PrivateLink supports native cross-region connectivity in selected AWS Regions, allowing you to connect to services hosted in other AWS Regions over Interface endpoints.
This is a opt-in feature and regions are enabled for specific Grafana Cloud stacks on a case by case basis.
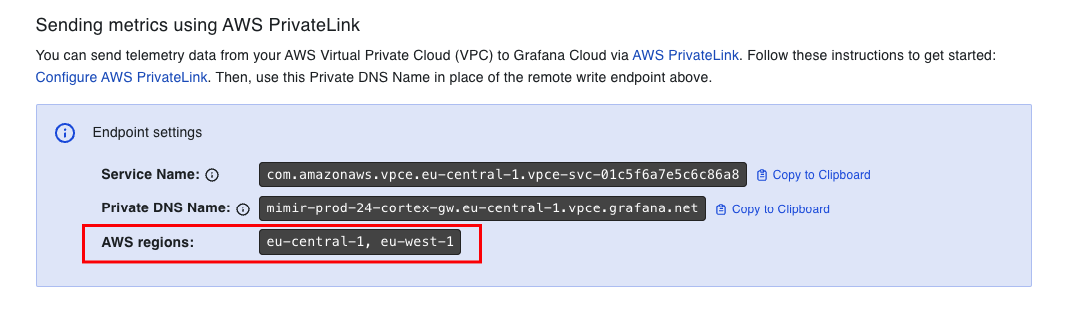
If you would like to send telemetry data from services running in a different region than the one where your Grafana Cloud stack is hosted (for example, the infrastructure or service you want to monitor is in us-east-1 and your Grafana Cloud stack is in us-east-2), you first need to check if your source region is enabled for that Grafana Cloud stack:
- Sign in to your Grafana account.
- Click Details on a service tile.
- Scroll down to the Sending metrics using AWS PrivateLink section, where supported AWS Regions for that specific stack are listed.
- If your source region is listed, you can connect right away.
- If your source region is not listed, contact Grafana Support to request to add your source region to all your desired Grafana Cloud Stacks.
For more information, refer to AWS Private Link cross-region connectivity.
On-premises infrastructure
If you manage some services on your own infrastructure, you can route traffic from your on-prem network into AWS using Direct Connect, and then you can use AWS PrivateLink to send the data to Grafana Cloud.
Note
Direct Connect might incur some AWS fees. For more information, refer to [AWS Direct Connect Pricing (https://aws.amazon.com/directconnect/pricing/).
Set up a VPC Endpoint
You can create a VPC endpoint in the AWS console, or provision one using Terraform.
Using the AWS Console
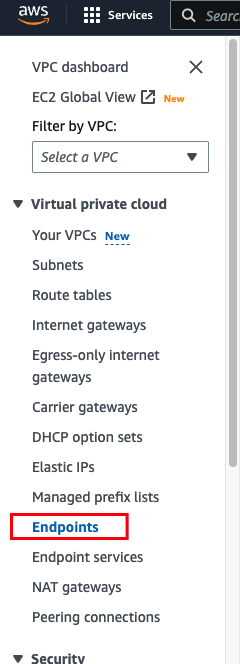
Open your AWS Console and navigate to VPC -> Endpoints.
![Select Virtual Private Clouds > Endpoints]()
Choose Create Endpoint.
![Choose “Create Endpoint”]()
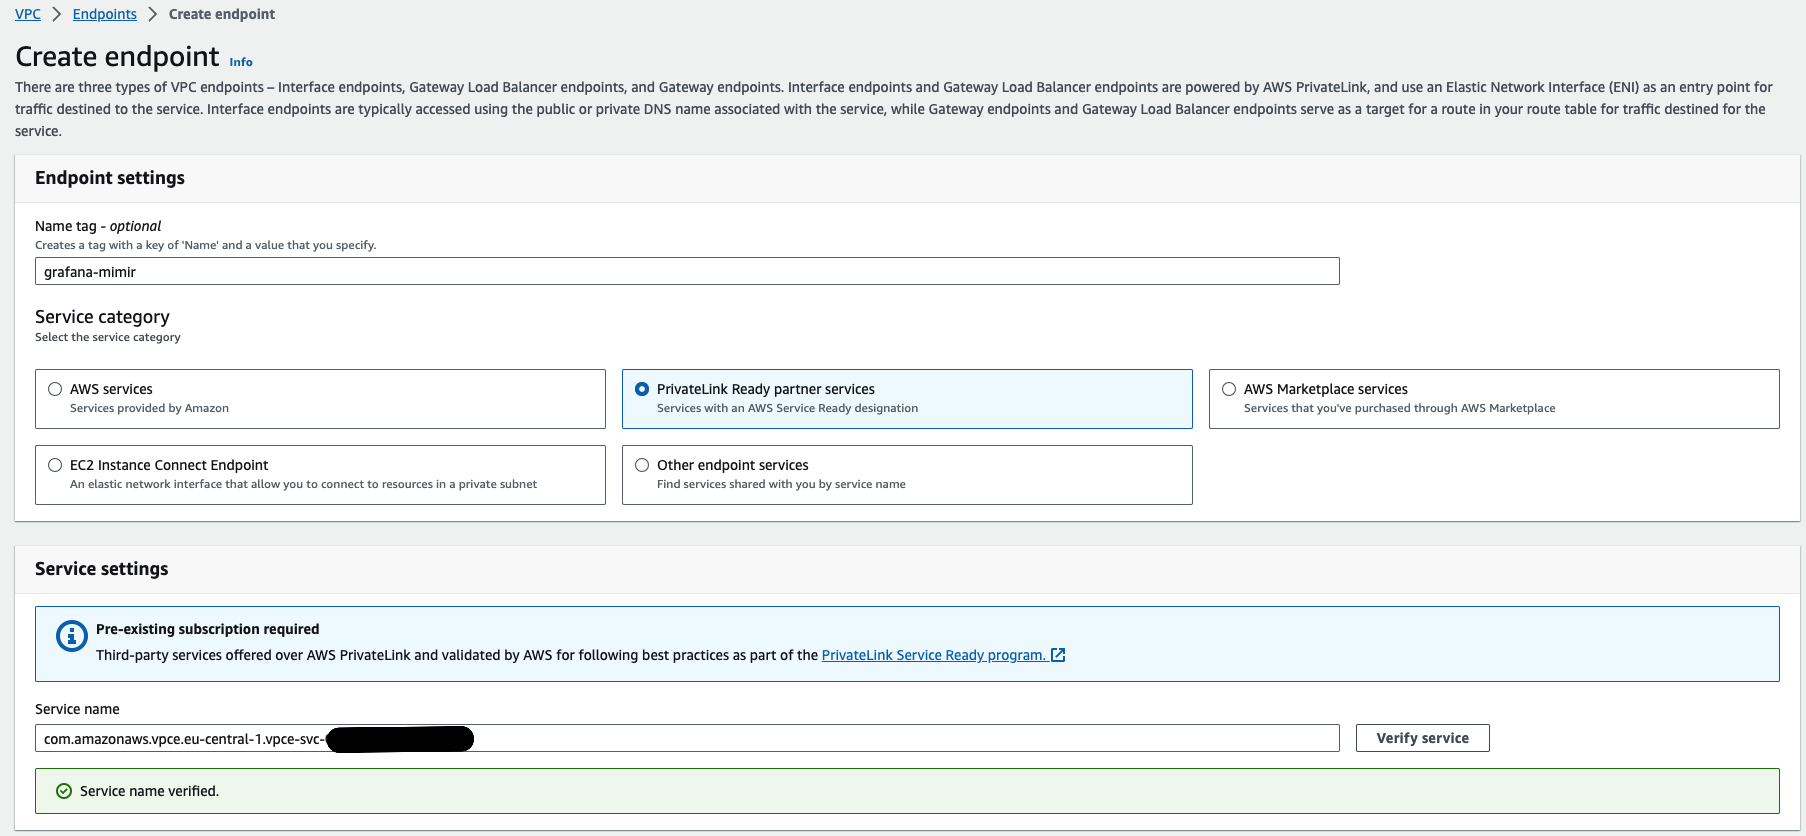
Give the endpoint a name, for example,
grafana-mimir.Choose PrivateLink Ready partner services.
In the Service Name field, enter the service name from your Grafana Cloud stack.
Navigate to your Grafana Cloud stack at grafana.com, select your stack, and click Details for the service you would like to use; for example Prometheus, Loki, Tempo, or Graphite. Under the header “Send (Metrics, Logs, or Traces) using AWS PrivateLink,” copy the Service Name and paste it into the Service Name field in the AWS console. Service Name follows the pattern
com.amazonaws.vpce.<region>.vpce-svc-<random id>.To connect to an endpoint service hosted in another region, enable Enable Cross Region endpoint and select the region where the Grafana service is hosted.
Click on Verify Service. A green message should be displayed:
Service name verified..![“Service Name Verified” message]()
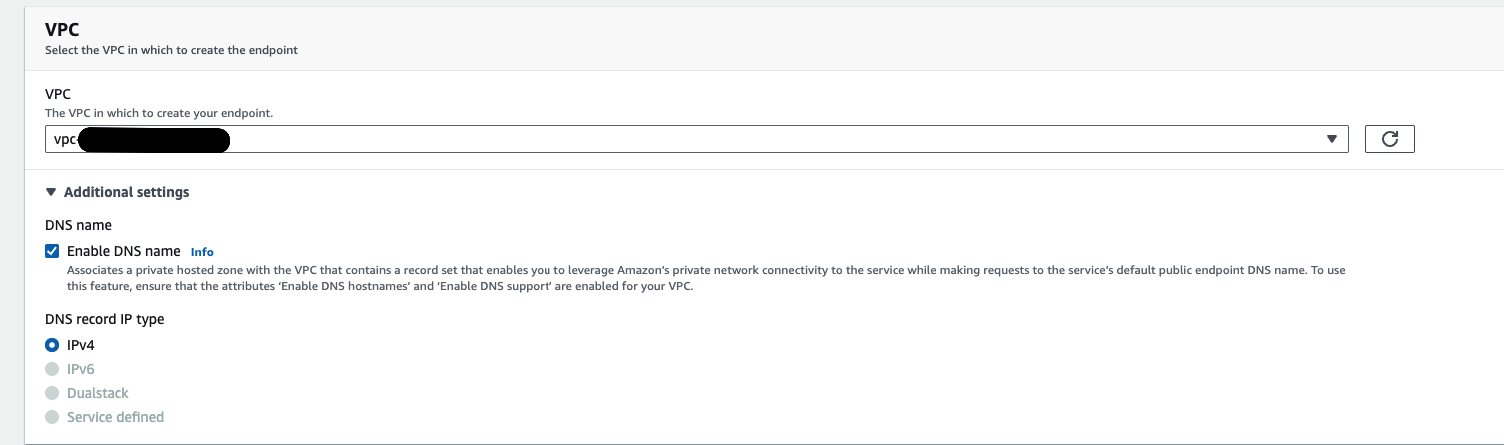
Select your VPC.
Expand the Additional settings section and select Enable DNS name.
![Check “Enable DNS name”]()
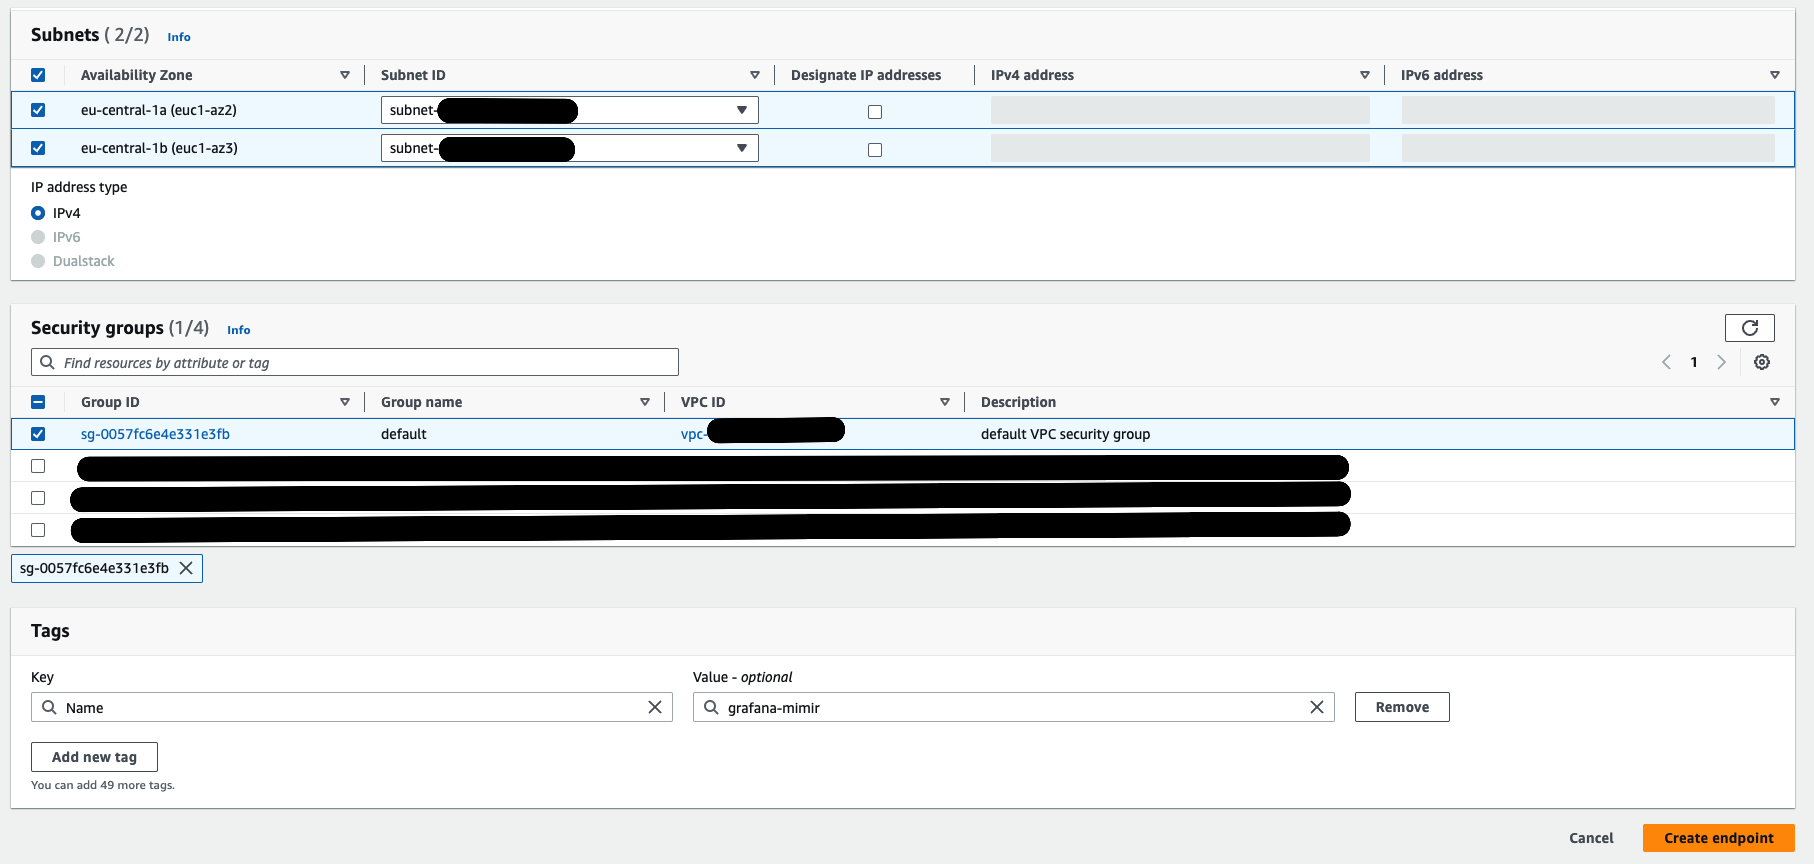
Select your desired Subnets and Security Groups.
![Select subnets and security groups]()
Choose Create Endpoint.
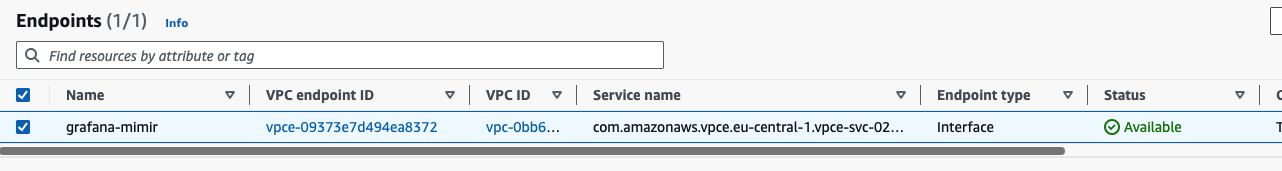
The new Endpoint is created and in
PendingStatus, wait until the status isAvailable. This can take up to 10 minutes.![An endpoint with Status: “Available”]()
Send telemetry to Grafana Cloud using the given private DNS name, in place of the normal
remote_writeendpoint or forwarding URL configured for Grafana Alloy, Prometheus, or other tools you use to connect your data to Grafana Cloud.To retrieve the Private DNS Name, navigate to your Grafana Cloud stack at grafana.com, select your stack, and click Details for the service you would like to use; for example Prometheus, Loki, Tempo, or Graphite. Under the header Send (Metrics, Logs, Traces, or Profiles) using AWS PrivateLink, you will find the service’s Private DNS Name. Private DNS name follows the pattern
<cell name>.<region>.vpce.grafana.net.Repeat this VPC Endpoint creation process for each type of telemetry you would like to send to Grafana Cloud. For example, create one VPC Endpoint each for Cloud Metrics, Logs, Traces, and Profiles.

Using Terraform
Use the following snippet to automate VPC Endpoint setup in AWS using Terraform:
locals {
    vpc_id             = "<your-vpc-id>"
    subnet_ids         = [<your subnet ids>]
    security_groups_id = [<your security group ids>]

    endpoint_name          = "grafana-mimir"
    grafana_service_name   = "<Endpoint Service Name provided by Grafana>"
    grafana_service_region = "<AWS region where Grafana service is available. eg. `us-east-2`>"
}

resource "aws_vpc_endpoint" "grafana_service" {
  vpc_id            = local.vpc_id
  service_name      = local.grafana_service_name
  // service_region is only required if you are connecting cross region
  service_region    = local.grafana_service_region
  vpc_endpoint_type = "Interface"

  security_group_ids = local.security_groups_id

  subnet_ids          = local.subnet_ids
  private_dns_enabled = true

  tags = {
    Name = local.endpoint_name
  }
}

