Apache Tomcat integration for Grafana Cloud
Apache Tomcat is an open source web server and servlet container that can run Java-based web applications. This integration for Grafana Cloud allows users to collect metrics and logs for monitoring an Apache Tomcat instance.
Metrics include virtual memory and cpu usage, traffic sent and received, total requests and processing time, threads, sessions and session processing time, and servlet requests and servlet processing time.
This integration includes 4 useful alerts and 3 pre-built dashboards to help monitor and visualize Apache Tomcat metrics and logs.
Before you begin
In order for the integration to properly work, you must set up the JMX Exporter for Prometheus to export metrics from Tomcat.
Set up JMX Exporter
Use this Apache Tomcat JMX Exporter configuration file. You can deploy it as either a Java agent (recommended) or standalone exporter.
When using the Java agent, you do not need to configure jmxUrl in the exporter config. For JVM options, agent arguments, or standalone configuration details, see the JMX Exporter documentation.
Once deployed, Grafana Alloy should be able to reach the JMX Exporter HTTP endpoint in order to scrape metrics.
Install Apache Tomcat integration for Grafana Cloud
- In your Grafana Cloud stack, click Connections in the left-hand menu.
- Find Apache Tomcat and click its tile to open the integration.
- Review the prerequisites in the Configuration Details tab and set up Grafana Alloy to send Apache Tomcat metrics and logs to your Grafana Cloud instance.
- Click Install to add this integration’s pre-built dashboards and alerts to your Grafana Cloud instance, and you can start monitoring your Apache Tomcat setup.
Configuration snippets for Grafana Alloy
Simple mode
These snippets are configured to scrape a single Apache Tomcat node running locally with default ports.
Manually copy and append the following snippets into your Grafana Alloy configuration file.
Metrics snippets
discovery.relabel "metrics_integrations_tomcat" {
    targets = [{
        __address__ = "localhost:9010",
    }]

    rule {
        target_label = "instance"
        replacement  = constants.hostname
    }
}
prometheus.scrape "metrics_integrations_tomcat" {
    targets    = discovery.relabel.metrics_integrations_tomcat.output
    forward_to = [prometheus.remote_write.metrics_service.receiver]
    job_name   = "integrations/tomcat"
}
Logs snippets
darwin
local.file_match "logs_integrations_tomcat_linux" {
    path_targets = [{
        __address__ = "localhost",
        __path__    = "/{var,opt,usr/local}/{log,*tomcat*}/{*tomcat*,logs}/catalina.out",
        instance    = constants.hostname,
        job         = "integrations/tomcat",
    }]
}
loki.source.file "logs_integrations_tomcat_linux" {
    targets    = local.file_match.logs_integrations_tomcat_linux.targets
    forward_to = [loki.write.grafana_cloud_loki.receiver]
}
linux
local.file_match "logs_integrations_tomcat_linux" {
    path_targets = [{
        __address__ = "localhost",
        __path__    = "/{var,opt,usr/local}/{log,*tomcat*}/{*tomcat*,logs}/catalina.out",
        instance    = constants.hostname,
        job         = "integrations/tomcat",
    }]
}
loki.source.file "logs_integrations_tomcat_linux" {
    targets    = local.file_match.logs_integrations_tomcat_linux.targets
    forward_to = [loki.write.grafana_cloud_loki.receiver]
}
windows
local.file_match "logs_integrations_tomcat_windows" {
    path_targets = [{
        __address__ = "localhost",
        __path__    = "/Program Files/Apache Software Foundation/Tomcat *.*/logs/catalina.out",
        instance    = constants.hostname,
        job         = "integrations/tomcat",
    }]
}
loki.source.file "logs_integrations_tomcat_windows" {
    targets    = local.file_match.logs_integrations_tomcat_windows.targets
    forward_to = [loki.write.grafana_cloud_loki.receiver]
}
Advanced mode
To instruct Grafana Alloy to scrape your Apache Tomcat nodes, go though the subsequent instructions.
The snippets provide examples to guide you through the configuration process.
First, manually copy and append the following snippets into your Grafana Alloy configuration file.
Then follow the instructions below to modify the necessary variables.
Advanced metrics snippets
discovery.relabel "metrics_integrations_tomcat" {
    targets = [{
        __address__ = "localhost:9010",
    }]

    rule {
        target_label = "instance"
        replacement  = constants.hostname
    }
}
prometheus.scrape "metrics_integrations_tomcat" {
    targets    = discovery.relabel.metrics_integrations_tomcat.output
    forward_to = [prometheus.remote_write.metrics_service.receiver]
    job_name   = "integrations/tomcat"
}
After enabling the JMX exporter in your Apache Tomcat node, instruct Grafana Alloy to scrape it.
One discovery.relabel must be added for each Apache Tomcat node.
Configure the following properties within each discovery.relabel component:
__address__: The address to the JMX exporter metrics endpoint.instance:constants.hostnamesets theinstancelabel to your Grafana Alloy server hostname. If that is not suitable, change it to a value uniquely identifies this Apache Tomcat instance. Make sure this label value is the same for all telemetry data collected for this instance.
Finally, reference each discovery.relabel component within the targets property of the prometheus.scrape component.
Advanced logs snippets
darwin
local.file_match "logs_integrations_tomcat_linux" {
    path_targets = [{
        __address__ = "localhost",
        __path__    = "/{var,opt,usr/local}/{log,*tomcat*}/{*tomcat*,logs}/catalina.out",
        instance    = constants.hostname,
        job         = "integrations/tomcat",
    }]
}
loki.source.file "logs_integrations_tomcat_linux" {
    targets    = local.file_match.logs_integrations_tomcat_linux.targets
    forward_to = [loki.write.grafana_cloud_loki.receiver]
}
To collect logs from unix-like systems, you need a pair of loki.source.file, and local.file_match components of Grafana Alloy.
The provided snippet is pre-configured with the default log write location for unix-like environments.
If you wish to capture other log files, you must add new maps to the path_targets list parameter of the local.file_match component, and include it in the targets list of loki.source.file component. Make sure that the new entry has the same instance and job labels, so it is matched to the correct instance to be shown in the Logs dashboard.
linux
local.file_match "logs_integrations_tomcat_linux" {
    path_targets = [{
        __address__ = "localhost",
        __path__    = "/{var,opt,usr/local}/{log,*tomcat*}/{*tomcat*,logs}/catalina.out",
        instance    = constants.hostname,
        job         = "integrations/tomcat",
    }]
}
loki.source.file "logs_integrations_tomcat_linux" {
    targets    = local.file_match.logs_integrations_tomcat_linux.targets
    forward_to = [loki.write.grafana_cloud_loki.receiver]
}
To collect logs from unix-like systems, you need a pair of loki.source.file, and local.file_match components of Grafana Alloy.
The provided snippet is pre-configured with the default log write location for unix-like environments.
If you wish to capture other log files, you must add new maps to the path_targets list parameter of the local.file_match component, and include it in the targets list of loki.source.file component. Make sure that the new entry has the same instance and job labels, so it is matched to the correct instance to be shown in the Logs dashboard.
windows
local.file_match "logs_integrations_tomcat_windows" {
    path_targets = [{
        __address__ = "localhost",
        __path__    = "/Program Files/Apache Software Foundation/Tomcat *.*/logs/catalina.out",
        instance    = constants.hostname,
        job         = "integrations/tomcat",
    }]
}
loki.source.file "logs_integrations_tomcat_windows" {
    targets    = local.file_match.logs_integrations_tomcat_windows.targets
    forward_to = [loki.write.grafana_cloud_loki.receiver]
}
To collect logs from Windows systems, you need a pair of loki.source.file, and local.file_match components of Grafana Alloy.
The provided snippet is pre-configured with the default log write location for Windows environments.
If you wish to capture other log files, you must add new maps to the path_targets list parameter of the local.file_match component, and include it in the targets list of loki.source.file component. Make sure that the new entry has the same instance and job labels, so it is matched to the correct instance to be shown in the Logs dashboard.
Kubernetes instructions
Before you begin with Kubernetes
Please note: These instructions assume the use of the Kubernetes Monitoring Helm chart
In order for the integration to properly work, you must set up the JMX Exporter for Prometheus to export metrics from Tomcat.
To enable JMX collection, make sure your Tomcat instance is configured with the following CATALINA_OPTS:
-Dcom.sun.management.jmxremote
-Dcom.sun.management.jmxremote.port=9010
-Dcom.sun.management.jmxremote.authenticate=false
-Dcom.sun.management.jmxremote.ssl=false
Set up JMX Exporter
The JMX Exporter can be run with this Apache Tomcat JMX Exporter configuration file.
For more information on how to configure the JVM, please refer to the JMX Exporter documentation for further configuration.
Apache Tomcat exposes 9010 for JMX by default, but feel free to change the port to match your environment. The JMX URL for the exporter should be properly configured to match e.g. jmxUrl: service:jmx:rmi:///jndi/rmi://localhost:9010/jmxrmi
Configuration snippets for Kubernetes Helm chart
The following snippets provide examples to guide you through the configuration process.
To scrape your Apache Tomcat instances, manually modify your Kubernetes Monitoring Helm chart with these configuration snippets.
Replace any values between the angle brackets <> in the provided snippets with your desired configuration values.
Metrics snippets
alloy-metrics:
    extraConfig: |-
        discovery.kubernetes "tomcat_service_jmx" {
            role = "service"
            selectors {
                role = "service"
                field = "metadata.name=<tomcat-service-name>"
            }
            namespaces {
                names = [<tomcat-namespace>]
            }
        }

        discovery.relabel "tomcat_service_jmx" {
            targets = discovery.kubernetes.tomcat_service_jmx.targets

            rule {
            source_labels = ["__meta_kubernetes_service_port_name"]
            action        = "keep"
            regex         = "<jmx-port-name>"
            }

            rule {
            replacement  = "integrations/apache-tomcat"
            target_label = "job"
            }
        }

        prometheus.scrape "tomcat_metrics" {
        targets    = discovery.relabel.tomcat_service_jmx.output
        job_name   = "integrations/apache-tomcat"
        forward_to = [prometheus.remote_write.grafana_cloud_metrics.receiver]
        }
Logs snippets
podLogs:
    extraDiscoveryRules: |-
        rule {
            source_labels = ["__meta_kubernetes_namespace", "__meta_kubernetes_pod_name", "__meta_kubernetes_pod_container_name"]
            separator     = ":"
            regex         = "(<tomcat-namespace>:<tomcat-pod-name>:<tomcat-container-name>)"
            replacement   = "apache-tomcat"
            target_label  = "integration"
        }
        rule {
            source_labels = ["integration"]
            regex         = "apache-tomcat"
            replacement   = "catalina.out"
            target_label  = "log_type"
        }
        rule {
            source_labels = ["integration"]
            regex         = "apache-tomcat"
            replacement   = "<tomcat-service-name>.<tomcat-namespace>.svc:<jmx-exporter-port>"
            target_label  = "instance"
        }
        rule {
            source_labels = ["integration"]
            regex         = "apache-tomcat"
            replacement   = "integrations/apache-tomcat"
            target_label  = "job"
        }
Dashboards
The Apache Tomcat integration installs the following dashboards in your Grafana Cloud instance to help monitor your system.
- Apache Tomcat hosts
- Apache Tomcat logs
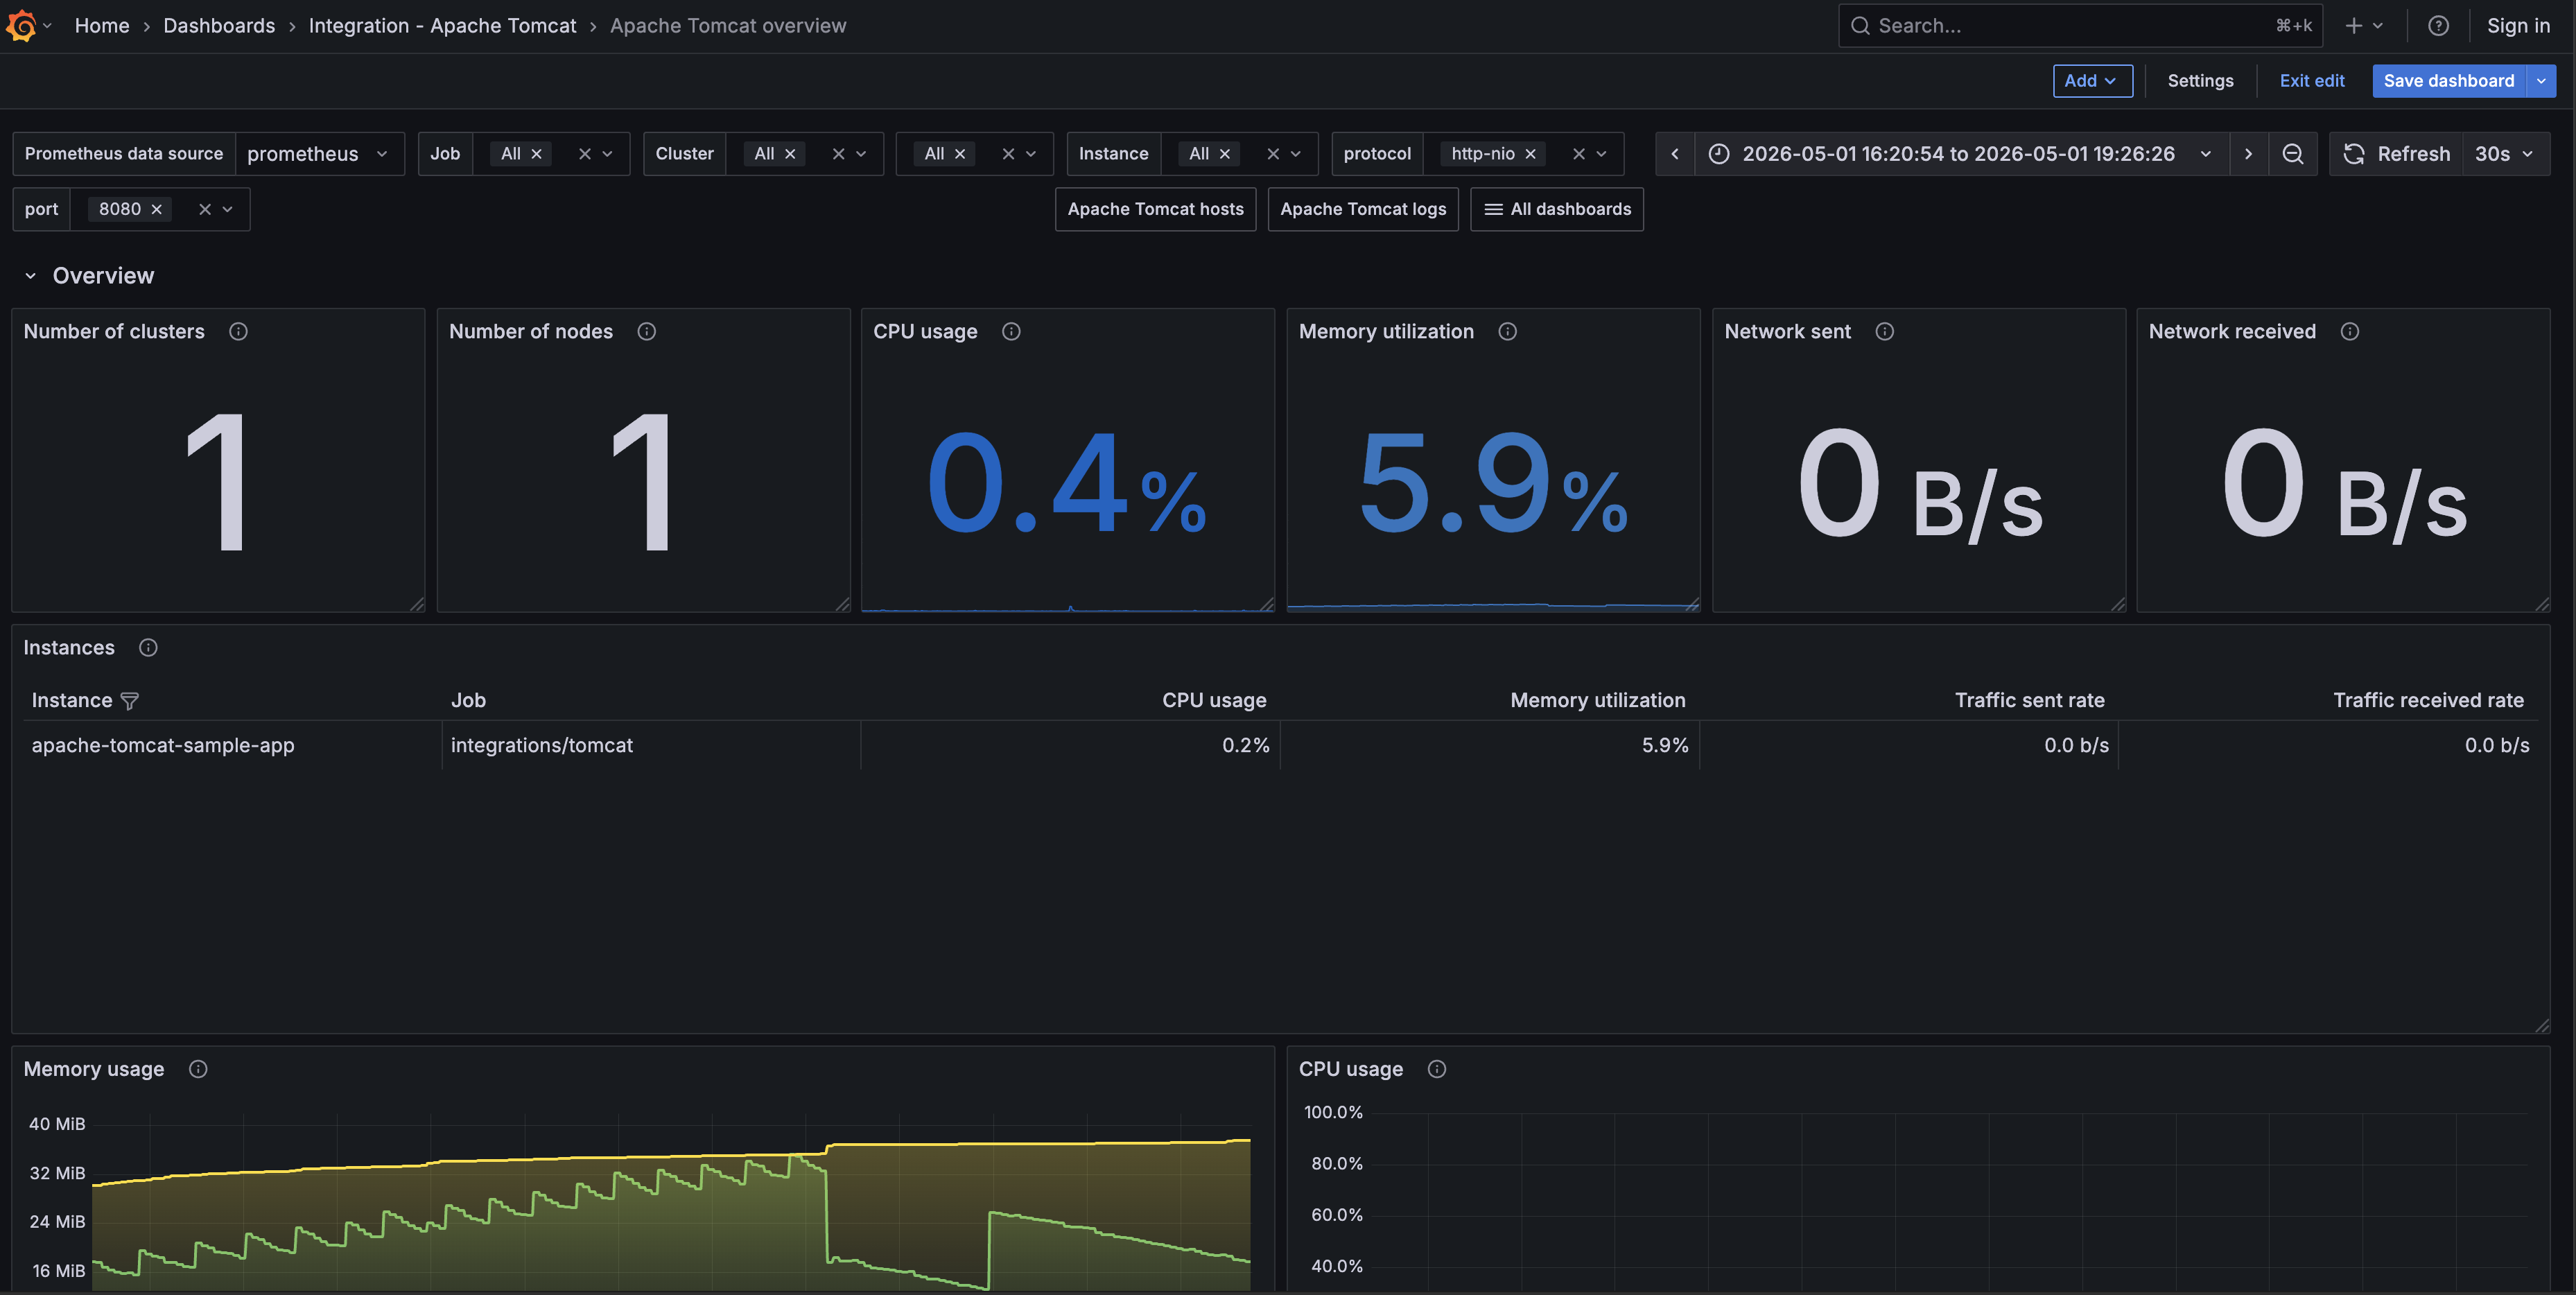
- Apache Tomcat overview
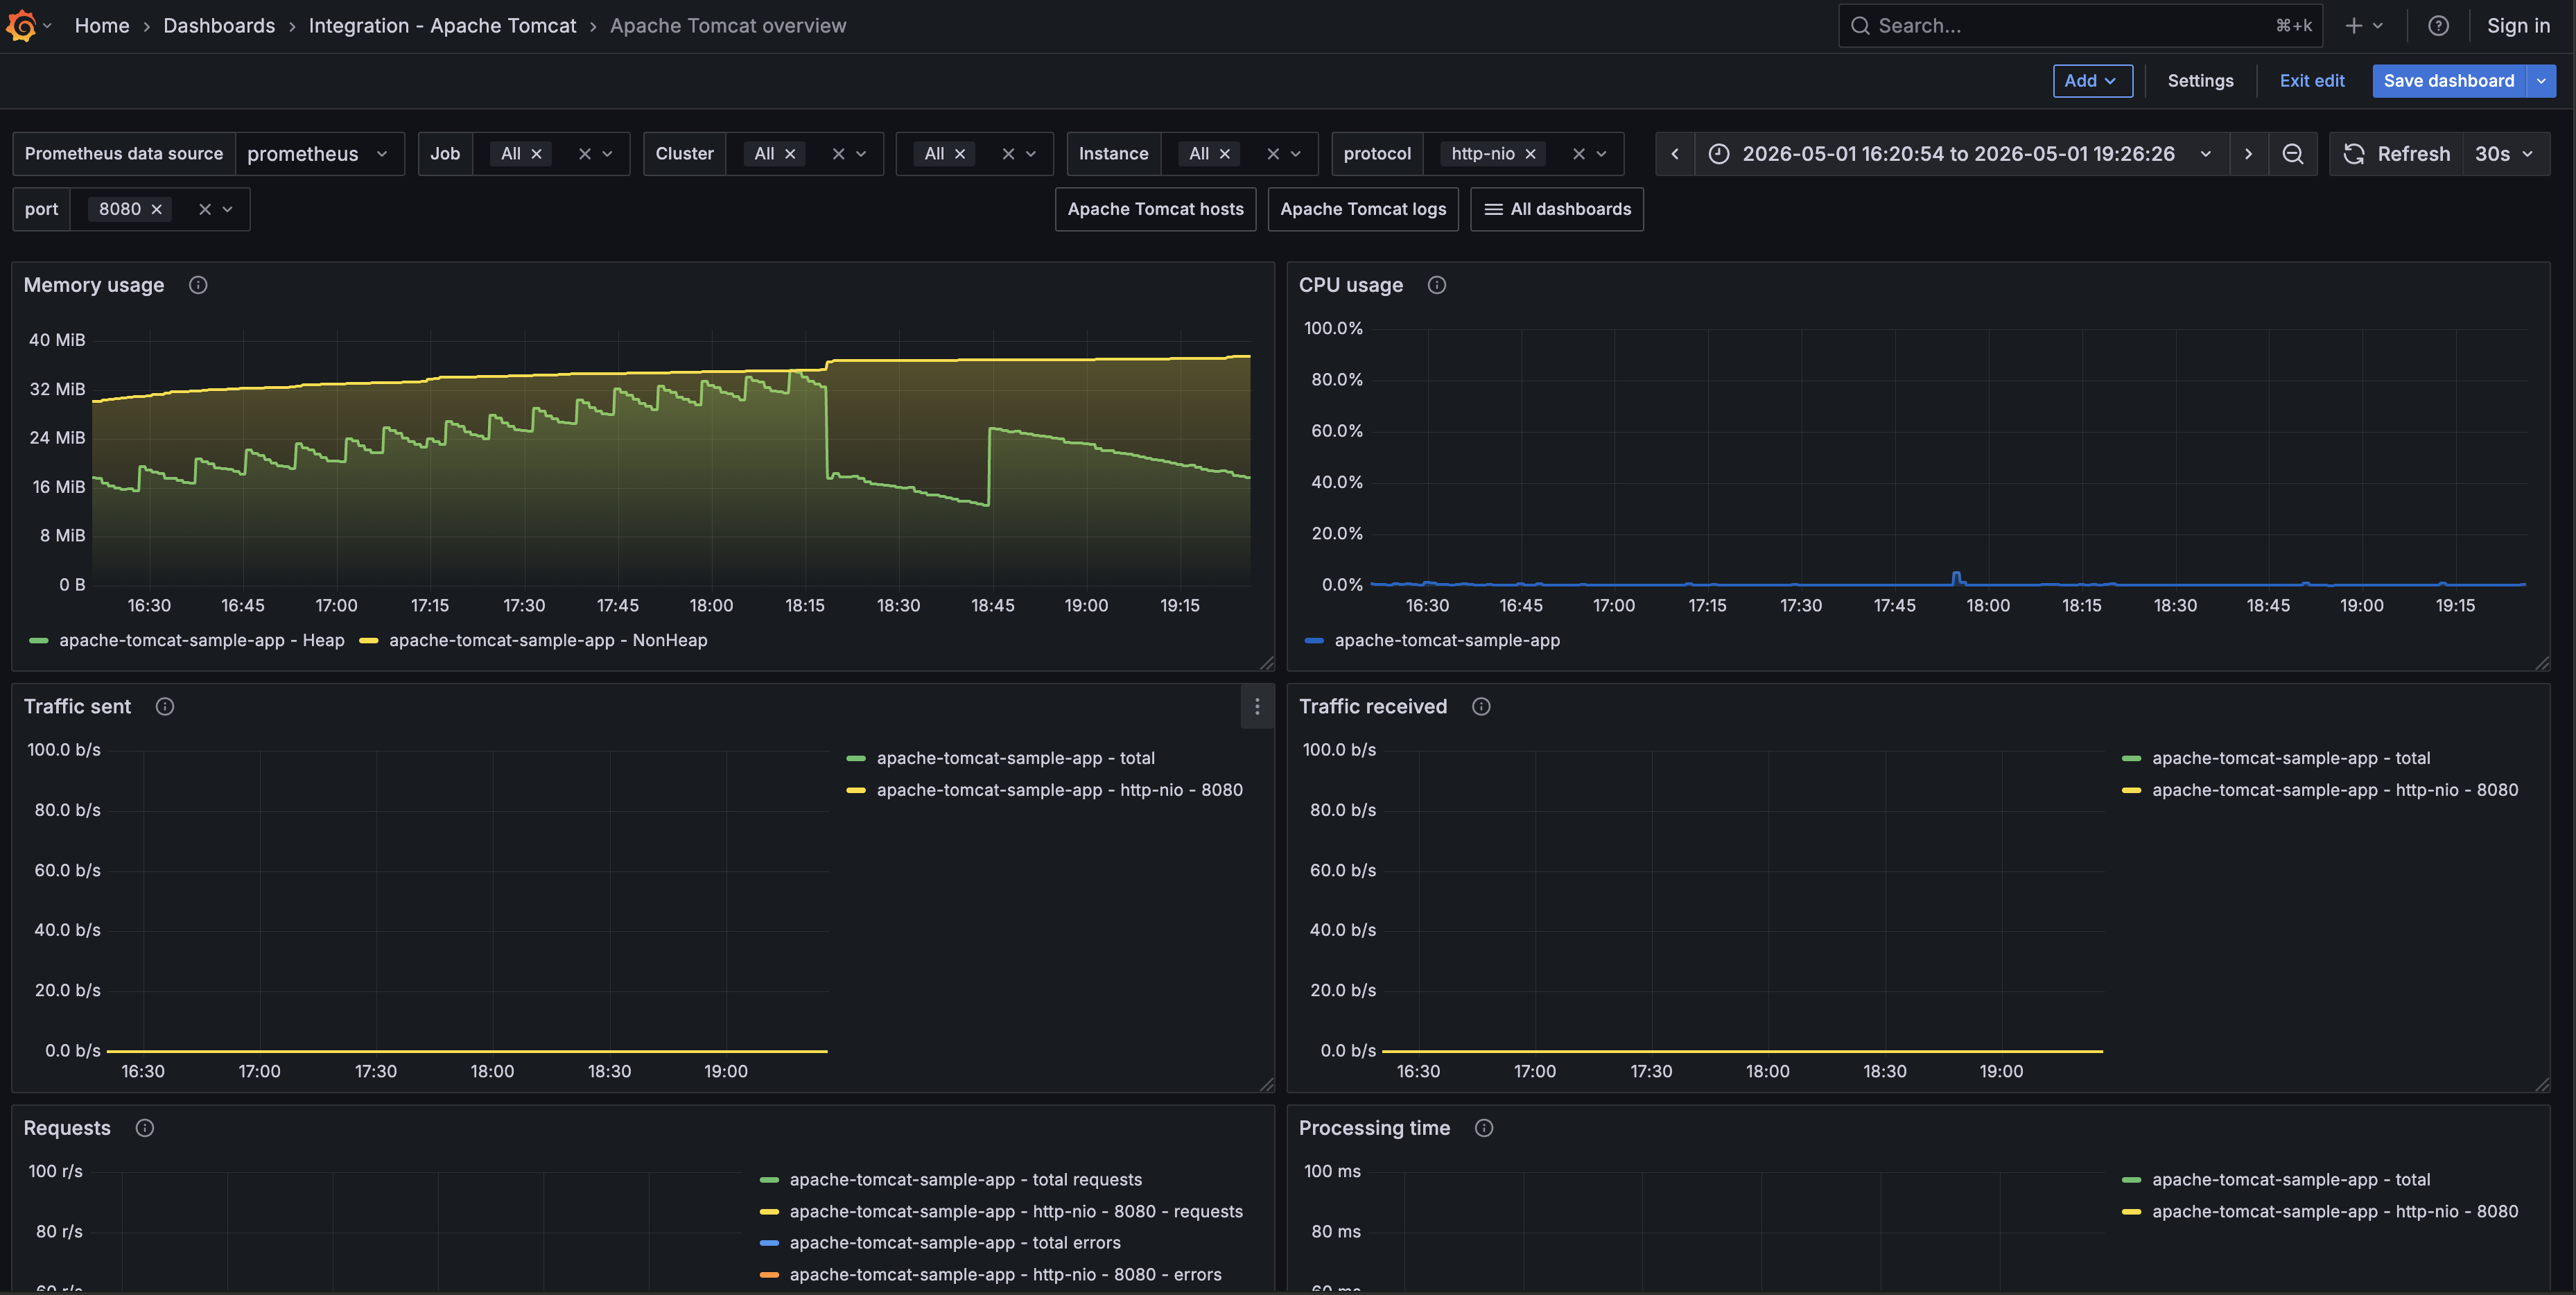
Apache Tomcat overview dashboard 1
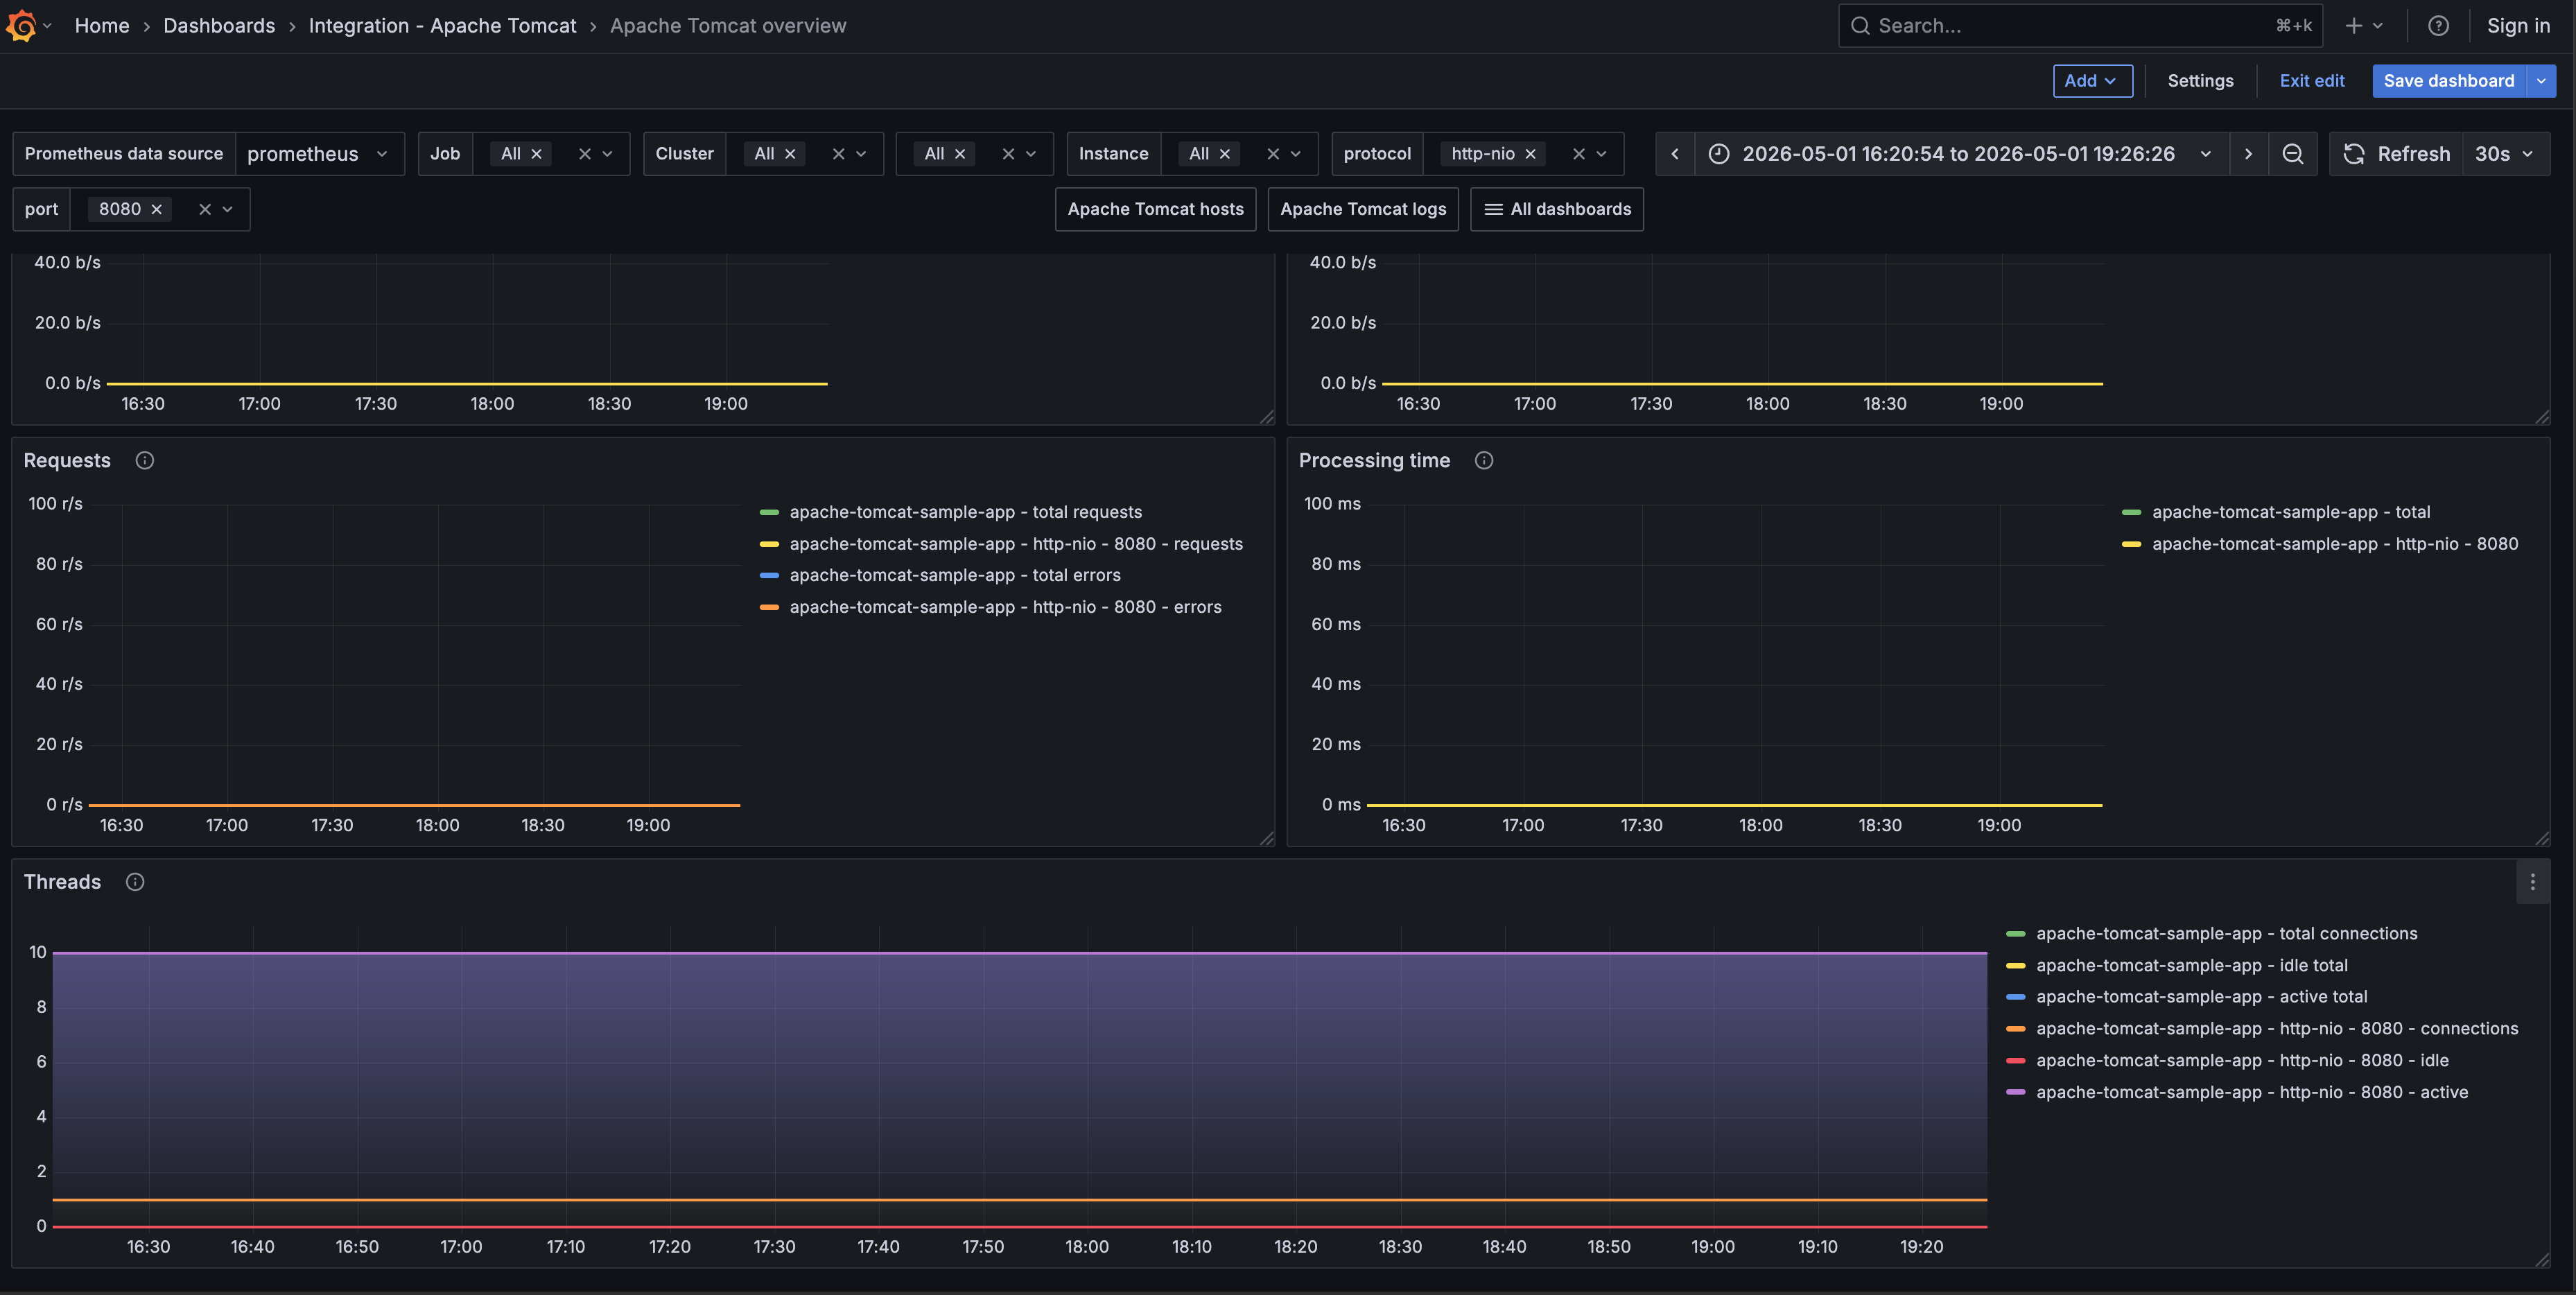
Apache Tomcat overview dashboard 2
Apache Tomcat overview dashboard 3
Alerts
The Apache Tomcat integration includes the following useful alerts:
Metrics
The most important metrics provided by the Apache Tomcat integration, which are used on the pre-built dashboards and Prometheus alerts, are as follows:
- jvm_memory_usage_used_bytes
- jvm_physical_memory_bytes
- jvm_process_cpu_load
- tomcat_bytesreceived_total
- tomcat_bytessent_total
- tomcat_errorcount_total
- tomcat_processingtime_total
- tomcat_requestcount_total
- tomcat_servlet_errorcount_total
- tomcat_servlet_processingtime_total
- tomcat_servlet_requestcount_total
- tomcat_session_expiredsessions_total
- tomcat_session_processingtime_total
- tomcat_session_rejectedsessions_total
- tomcat_session_sessioncounter_total
- tomcat_threadpool_connectioncount
- tomcat_threadpool_currentthreadcount
- tomcat_threadpool_keepalivecount
- tomcat_threadpool_pollerthreadcount
- up
Changelog
# 1.2.0 - May 2026

* Updated dashboards to follow new stylistic standards
* Renamed alert `ApacheTomcatAlertsHighRequestErrorPercent` to `ApacheTomcatAlertsRequestErrors`
* Renamed alert `ApacheTomcatAlertsModeratelyHighProcessingTime` to `ApacheTomcatAlertsHighProcessingTime`
* Added an `Apache Tomcat logs` dashboard

# 1.1.1 - November 2024

* Fix metric & log check queries

# 1.1.0 - September 2024

* Added Asserts support

# 1.0.1 - March 2024

* Updated to latest Mixin to fix CPU and Memory Alert queries

# 1.0.0 - October 2023

* Added Grafana Agent Operator configuration snippet to support Tomcat in kubernetes cluster
* Added cluster selector to dashboard for kubernetes support

# 0.0.4 - September 2023

* New Filter Metrics option for configuring the Grafana Agent, which saves on metrics cost by dropping any metric not used by this integration. Beware that anything custom built using metrics that are not on the snippet will stop working.
* New hostname relabel option, which applies the instance name you write on the text box to the Grafana Agent configuration snippets, making it easier and less error prone to configure this mandatory label.

# 0.0.3 - August 2023

* Add regex filter for logs datasource

# 0.0.2 - July 2023

* Update mixin to latest version
  - Adds an `instance` and `job` filter for the logs panel to only show this integration's logs

# 0.0.1 - April 2023

* Initial release
Cost
By connecting your Apache Tomcat instance to Grafana Cloud, you might incur charges. To view information on the number of active series that your Grafana Cloud account uses for metrics included in each Cloud tier, see Active series and dpm usage and Cloud tier pricing.


