View alerting insights
Alerting insights provides a series of pre-built dashboards that allow you to monitor your alerting data. You can identify patterns in why things go wrong and discover trends in alerting performance within your organization.
To view Alerting Insights, complete the following steps.
- In your Grafana Cloud stack, click Alerts & IRM in the left-side menu.
- Click Alerting.
- On the Alerting landing page, view the Insights tab.
Dashboards
Insights are divided into five sections, each section containing preconfigured panels to help you monitor the status of your alerting system.
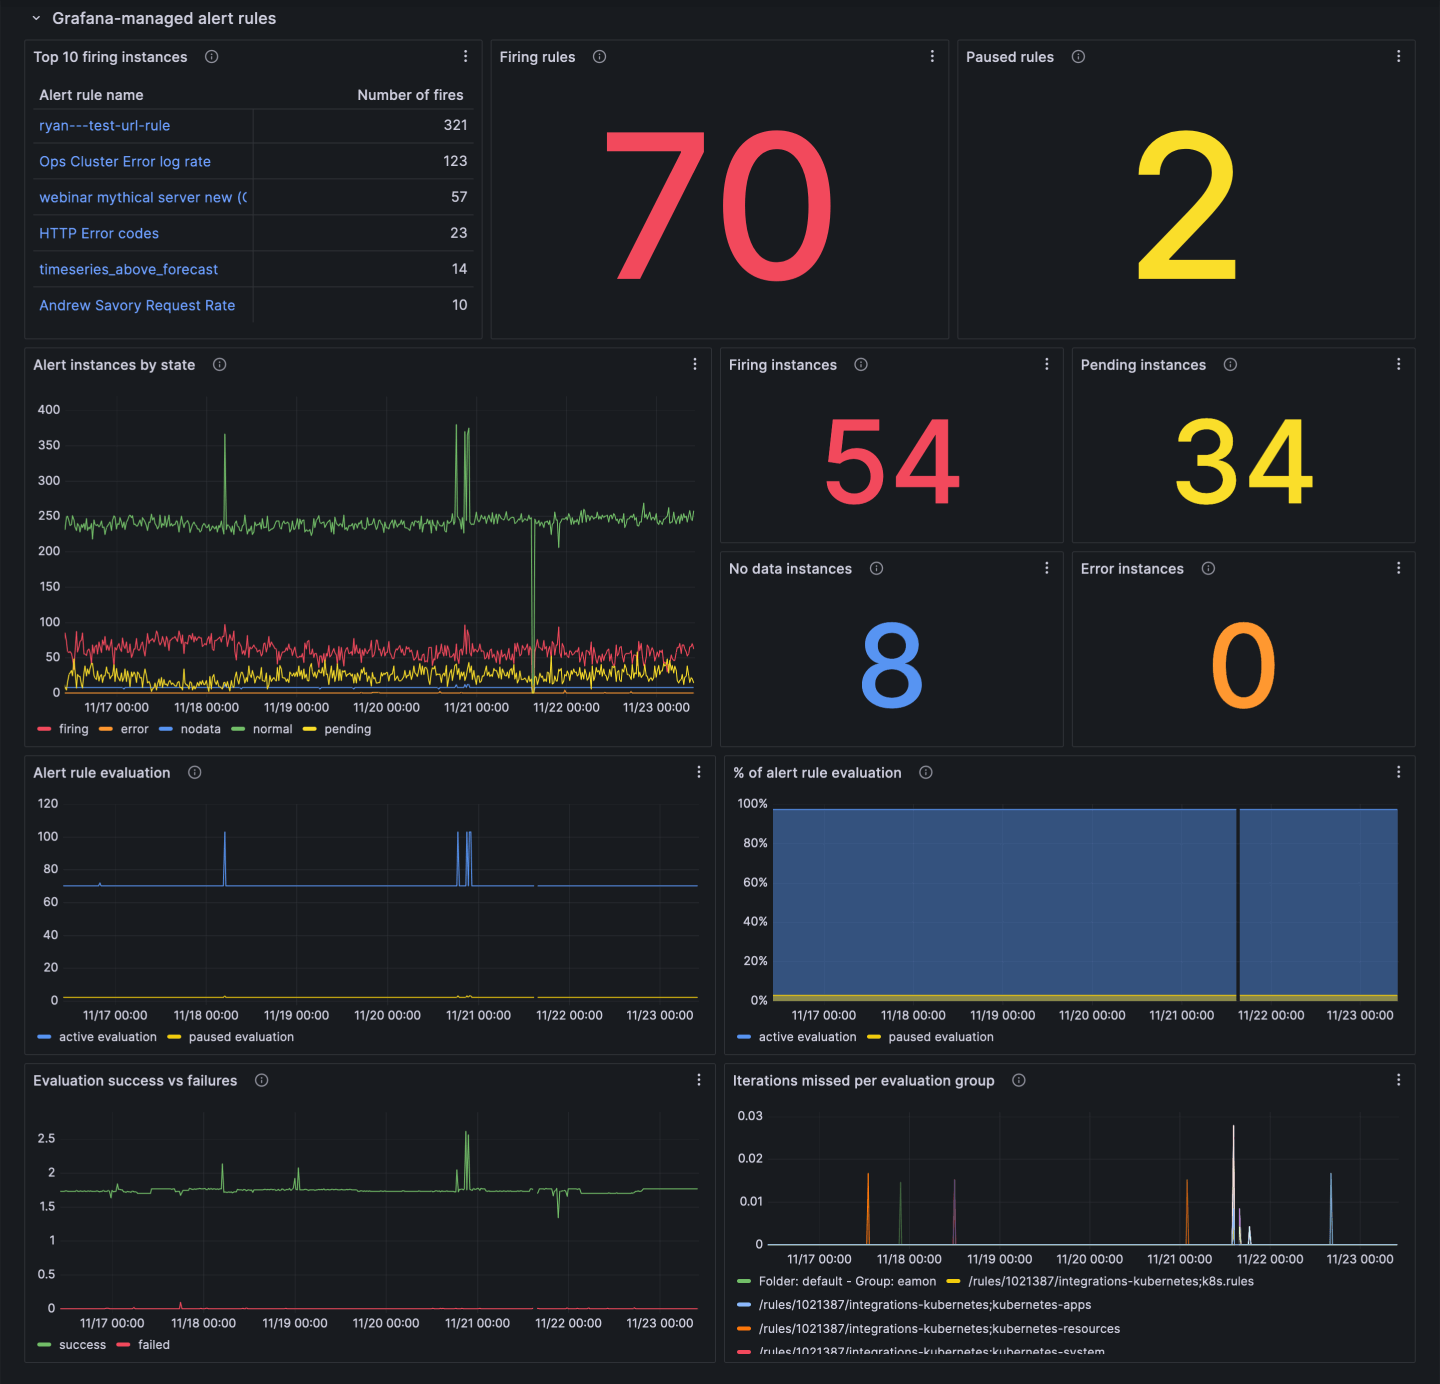
The Grafana-managed alert rules section displays:
- The top 10 alert rule instances that have fired most frequently.
- The number of currently firing alert rules.
- A breakdown of alert rule instances by state.
- The number of active or paused alert rules.
- Information on evaluation failures and missed evaluations.
The Grafana Alertmanager section displays:
- A breakdown of firing alert rule instances based on their status: active, suppressed (silenced or muted), or unprocessed.
- Information on the types of silences in your system.
The Mimir-managed alert rules section displays:
- The top 10 alert rules that have fired most frequently.
- The number of currently firing or pending alert rule instances.
- Information on evaluation failures and missed evaluations.
The Mimir-managed alert rules - per rule group section displays:
- The number of successful and failed evaluations.
- The current and historical evaluation interval.
- The number of alert rules in the group.
- Evaluation duration for alert rules in the group.
- The percentage of the evaluation interval spent evaluating alert rules.
The Mimir Alertmanager section displays:
- A breakdown of firing alert rule instances by status: active, suppressed (silenced or muted), or unprocessed.
- Information on the types of silences in your system.
- The number of successful and failed notifications.
- The current state of your Alertmanager configuration.
Explore insights metrics and logs
The panels in Alerting Insights query metrics and logs from various data sources within your Grafana Cloud stack. For more details on querying this data, refer to Meta monitoring.


