Configure the Tempo data source
The Tempo data source connects Grafana to your Tempo database and lets you configure features and integrations with other telemetry signals.
You can configure the data source using either the data source interface in Grafana or using a configuration file. This page explains how to connect Grafana to Tempo, set up authentication, and enable streaming. For trace correlation features, provisioning, and other settings, refer to the linked sub-pages.
Depending upon your tracing environment, you may have more than one Tempo instance. Grafana supports multiple Tempo data sources.
Before you begin
To configure a Tempo data source, you need:
- Administrator rights to your Grafana instance.
- A Tempo instance configured to send tracing data to Grafana.
- An application or service instrumented to emit traces. Refer to Instrument for tracing if you haven’t set this up yet.
If you’re provisioning a Tempo data source, you also need administrative rights on the server hosting your Grafana instance. Refer to Provision the Tempo data source for provisioning instructions.

Note
You can’t modify a provisioned data source from the Grafana UI. The settings form is read-only and the Save & test button is replaced by Test (you can test the connection but not save changes).
To make changes, you can either:
- Clone the data source: Create a new data source of the same type and copy the settings from the provisioned data source. Refer to Clone a provisioned data source for Grafana Cloud.
- Update the provisioning file: Edit the YAML configuration file. Refer to Provision the Tempo data source.
Add or modify a data source
You can use these procedures to configure a new Tempo data source or to edit an existing one.
Add a new data source
Follow these steps to set up a new Tempo data source:
Select Connections in the main menu.
Enter
Tempoin the search bar.Select Tempo.
Select Add new data source in the top-right corner of the page.
On the Settings tab, complete the Name, Connection, and Authentication sections.
- Use the Name field to specify the name used for the data source in panels, queries, and Explore. Toggle the Default switch for the data source to be pre-selected for new panels.
- Under Connection, enter the URL of the Tempo instance. Refer to the connection section for URL format examples.
- Complete the Authentication section.
Optional: Configure other sections to add capabilities to your tracing data. Refer to the Configure trace correlations and Other settings sections for available options.
Select Save & test.
This video explains how to add data sources, including Loki, Tempo, and Mimir, to Grafana and Grafana Cloud. Tempo data source setup starts at 4:58 in the video.
Update an existing data source
To modify an existing Tempo data source:
- Select Connections in the main menu.
- Select Data sources to view a list of configured data sources.
- Select the Tempo data source you want to modify.
- Configure or update additional sections to add capabilities to your tracing data.
- After completing your updates, select Save & test.
Connection
The URL format depends on your environment:
The default port depends on the protocol: 3200 for HTTP, 9095 for gRPC.
Note
Grafana Cloud includes Grafana Cloud Traces, a pre-configured tracing data source backed by Tempo. Add a Tempo data source manually when you need to connect to a self-managed Tempo instance or require custom configuration beyond what Grafana Cloud Traces provides.
The URLs in this table are for querying traces from Grafana. To configure how your applications send traces to Tempo (OTLP endpoints), refer to Set up tracing for Grafana Cloud or Instrument for tracing for self-managed Tempo.
Authentication
Use this section to select an authentication method to access the data source.
Note
Use Transport Layer Security (TLS) for an additional layer of security when working with Tempo. For additional information on setting up TLS encryption with Tempo, refer to Configure TLS communication and Tempo configuration.
To set up authentication:
Select an authentication method from the drop-down list:
- Basic authentication: Authenticates your data source using a username and password
- Forward OAuth identity: Forwards the OAuth access token and the OIDC ID token, if available, of the user querying to the data source
- No authentication: No authentication is required to access the data source
For Basic authentication only: Enter the User and Password.
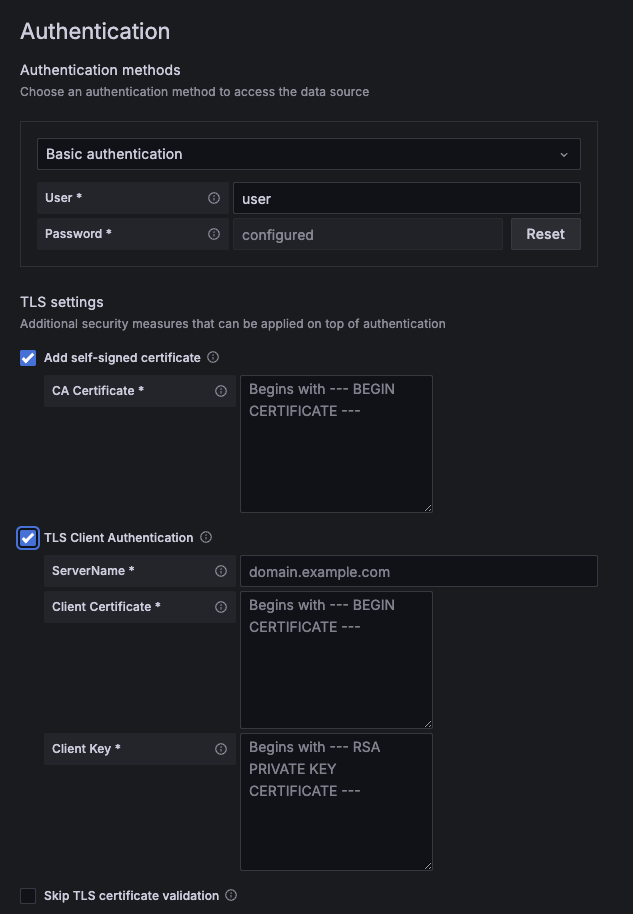
Optional: Complete the TLS settings for additional security methods.
- TLS Client Authentication
- Toggle on to use client authentication. When enabled, it adds the Server name, Client cert, and Client key fields. The client provides a certificate that is validated by the server to establish the client’s trusted identity. The client key encrypts the data between client and server. These details are encrypted and stored in the Grafana database.
- Add self-signed certificate
- Activate this option to use a self-signed TLS certificate. You can add your own Certificate Authority (CA) certificate on top of one generated by the certificate authorities for additional security measure.
- Skip TLS certification validation
- When activated, it bypasses TLS certificate verification. Not recommended, unless absolutely necessary for testing.
![Authentication section showing the TLS client certificate options]()
Optional: Add HTTP Headers. You can pass along additional context and metadata data about the request and response. Select Add header to add Header and Value fields.
Select Save & test to preserve your changes.
Connecting to Grafana Cloud Traces: Select Basic authentication. Use your Grafana Cloud stack’s instance ID (shown in the Tempo data source URL on the Cloud Portal) as the User, and a Cloud Access Policy token with traces:read scope as the Password. Don’t use your Grafana login credentials.
Self-managed Tempo: If Tempo is configured without authentication, select No authentication. If your Tempo instance uses basic auth, enter the credentials configured in your Tempo server block or reverse proxy.
Multi-tenancy
If you’re using a multi-tenant Tempo deployment, you need to send a tenant ID with each request so Tempo routes queries to the correct tenant.
To configure multi-tenancy:
- In the Tempo data source settings, scroll to the Authentication section.
- Expand the HTTP Headers subsection.
- Add a header with the name
X-Scope-OrgIDand the value set to your tenant ID.
This header is set in the Grafana data source for querying. The same header must also be set on the write path (in your Alloy or OpenTelemetry Collector configuration) to route trace data to the correct tenant on ingest.
For more information, refer to the Tempo multi-tenancy documentation.
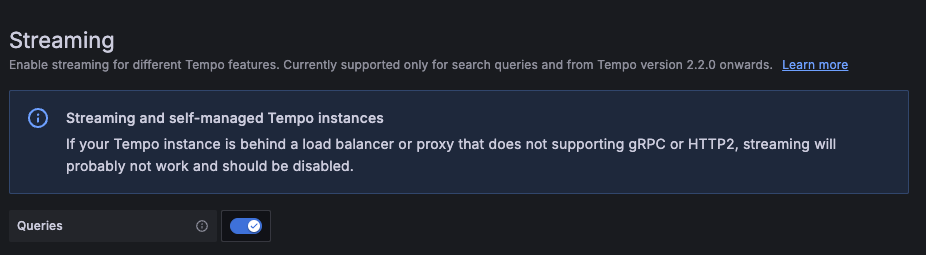
Streaming
Streaming enables TraceQL query results to be displayed as they become available. Without streaming, no results are displayed until all results have returned.
To use streaming, you need to:
Run Tempo version 2.2 or later, or Grafana Enterprise Traces (GET) version 2.2 or later, or use Grafana Cloud Traces.
Grafana Cloud Traces: Streaming is supported out of the box. No additional infrastructure configuration is required.
Self-managed Tempo or GET: Tempo must have
stream_over_http_enabled: truein its configuration for streaming to work. If your Tempo or GET instance is behind a load balancer or proxy that doesn’t support gRPC or HTTP2, streaming may not work and should be deactivated.For more information, refer to Tempo gRPC API.
Activate streaming
Streaming is available in Grafana and Grafana Cloud. The Streaming section has two toggles:
- Search queries: Streams TraceQL search results as they arrive.
- Metrics queries: Streams TraceQL metrics query results as they arrive.
Enable one or both depending on which query types you use.
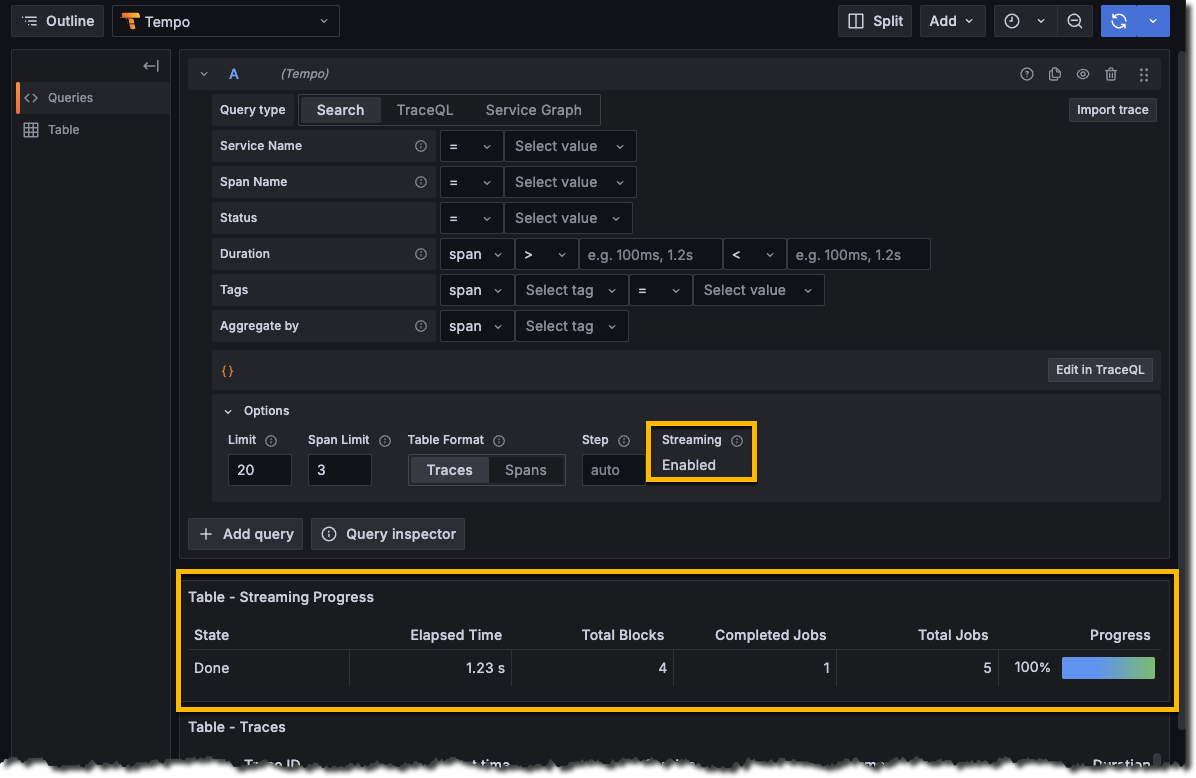
When streaming is active, it shows as Enabled in Explore. To check the status, select Explore in the menu, select your Tempo data source, and expand the Options section.
Troubleshoot streaming
If streaming isn’t working, refer to Streaming issues in the troubleshooting guide.
Connect traces to other signals
Grafana provides several ways to link traces to other telemetry signals. The following diagram shows the available correlation mechanisms, the direction each goes, and where each is configured.

The Tempo data source settings page includes three sections for linking from spans to other signals. Each corresponds to a section in the settings form:
- Trace to logs: Navigate from spans to related logs in Loki or another log data source.
- Trace to metrics: Link spans to metrics queries in Prometheus or other metrics data sources.
- Trace to profiles: Link spans to profiling data in Grafana Pyroscope with embedded flame graphs.
For more flexible, rule-based correlations that can target any data source or external URL, use Grafana Trace correlations. Trace correlations are configured under Configuration > Correlations, not in the Tempo data source settings.
To link from logs or metrics to traces (the reverse direction), refer to:
- Derived fields in the Loki data source (for logs to traces). The trace to logs page also covers this setup.
- Exemplars in the Prometheus data source (for metrics to traces).
Other settings
- Additional settings: Configure Service graph, node graph, search, TraceID query, span bar, and other settings.
- Provision the Tempo data source: Configure the Tempo data source using a YAML file and clone provisioned data sources.
Custom query variables
To use a variable in your trace to logs, metrics, or profiles configuration, you need to wrap it in ${}.
For example, ${__span.name}.


