Cloudflare integration for Grafana Cloud
Cloudflare is a globally distributed network infrastructure and cybersecurity company that provides content delivery, DDoS mitigation, internet security, and other related services to enhance the performance and security of websites and internet applications. This integration for Grafana Cloud allows users to collect and analyze metrics for Cloudflare Analytics - account and zone analytics, a description of which is found here.
Metrics include requests, bandwidth, CPU utilization, HTTP response codes, pool health, and colocation information. These are used to provide valuable visualizations for zones, workers, and pools.
This integration requires Pro Plan or better Cloudflare subscriptions.
This integration includes 5 useful alerts and 3 pre-built dashboards to help monitor and visualize Cloudflare metrics.
Before you begin
In order for the integration to properly work, you must set up the Cloudflare Prometheus exporter to export metrics from Cloudflare.
Get an API token
It is recommended to authenticate the exporter using an API token, which can be created by following this guide.
This newly created token will also need to be given certain permissions so the exporter can retrieve metrics. These permissions are:
Account Analytics: ReadAccount Settings: ReadAnalytics: Read
Set up Cloudflare exporter
The exporter can be configured by following this guide.
To build and run the exporter, use the following commands.
This command will build the exporter binary with the name cloudflare_exporter.
make buildThis uses the API token authentication method, so be sure to replace <cloudflare-api-token> with the token generated in the previous step. It also uses the useful flag -listen which will set the port metrics are served at. The default port is 8080 which may be an issue if you have a pre-existing process using that port.
./cloudflare_exporter -listen=:<port_number> -cf_api_token=<cloudflare-api-token>Install Cloudflare integration for Grafana Cloud
- In your Grafana Cloud stack, click Connections in the left-hand menu.
- Find Cloudflare and click its tile to open the integration.
- Review the prerequisites in the Configuration Details tab and set up Grafana Alloy to send Cloudflare metrics to your Grafana Cloud instance.
- Click Install to add this integration’s pre-built dashboards and alerts to your Grafana Cloud instance, and you can start monitoring your Cloudflare setup.
Configuration snippets for Grafana Alloy
Advanced mode
The following snippets provide examples to guide you through the configuration process.
To instruct Grafana Alloy to scrape your Cloudflare instances, manually copy and append the snippets to your alloy configuration file, then follow subsequent instructions.
Advanced metrics snippets
prometheus.scrape "metrics_integrations_integrations_cloudflare" {
	targets = [{
		__address__ = "<exporter_hostname>:<exporter_port>",
		instance    = constants.hostname,
	}]
	forward_to = [prometheus.remote_write.metrics_service.receiver]
	job_name   = "integrations/cloudflare"
}
To monitor your Cloudflare instance, you must use a discovery.relabel component to discover your Cloudflare Prometheus endpoint and apply appropriate labels, followed by a prometheus.scrape component to scrape it.
Configure the following properties within each discovery.relabel component:
__address__: The address to your Cloudflare Prometheus metrics endpoint.instancelabel:constants.hostnamesets theinstancelabel to your Grafana Alloy server hostname. If that is not suitable, change it to a value uniquely identifies this Cloudflare instance.
If you have multiple Cloudflare servers to scrape, configure one discovery.relabel for each and scrape them by including each under targets within the prometheus.scrape component.
Dashboards
The Cloudflare integration installs the following dashboards in your Grafana Cloud instance to help monitor your system.
- Cloudflare geomap overview
- Cloudflare worker overview
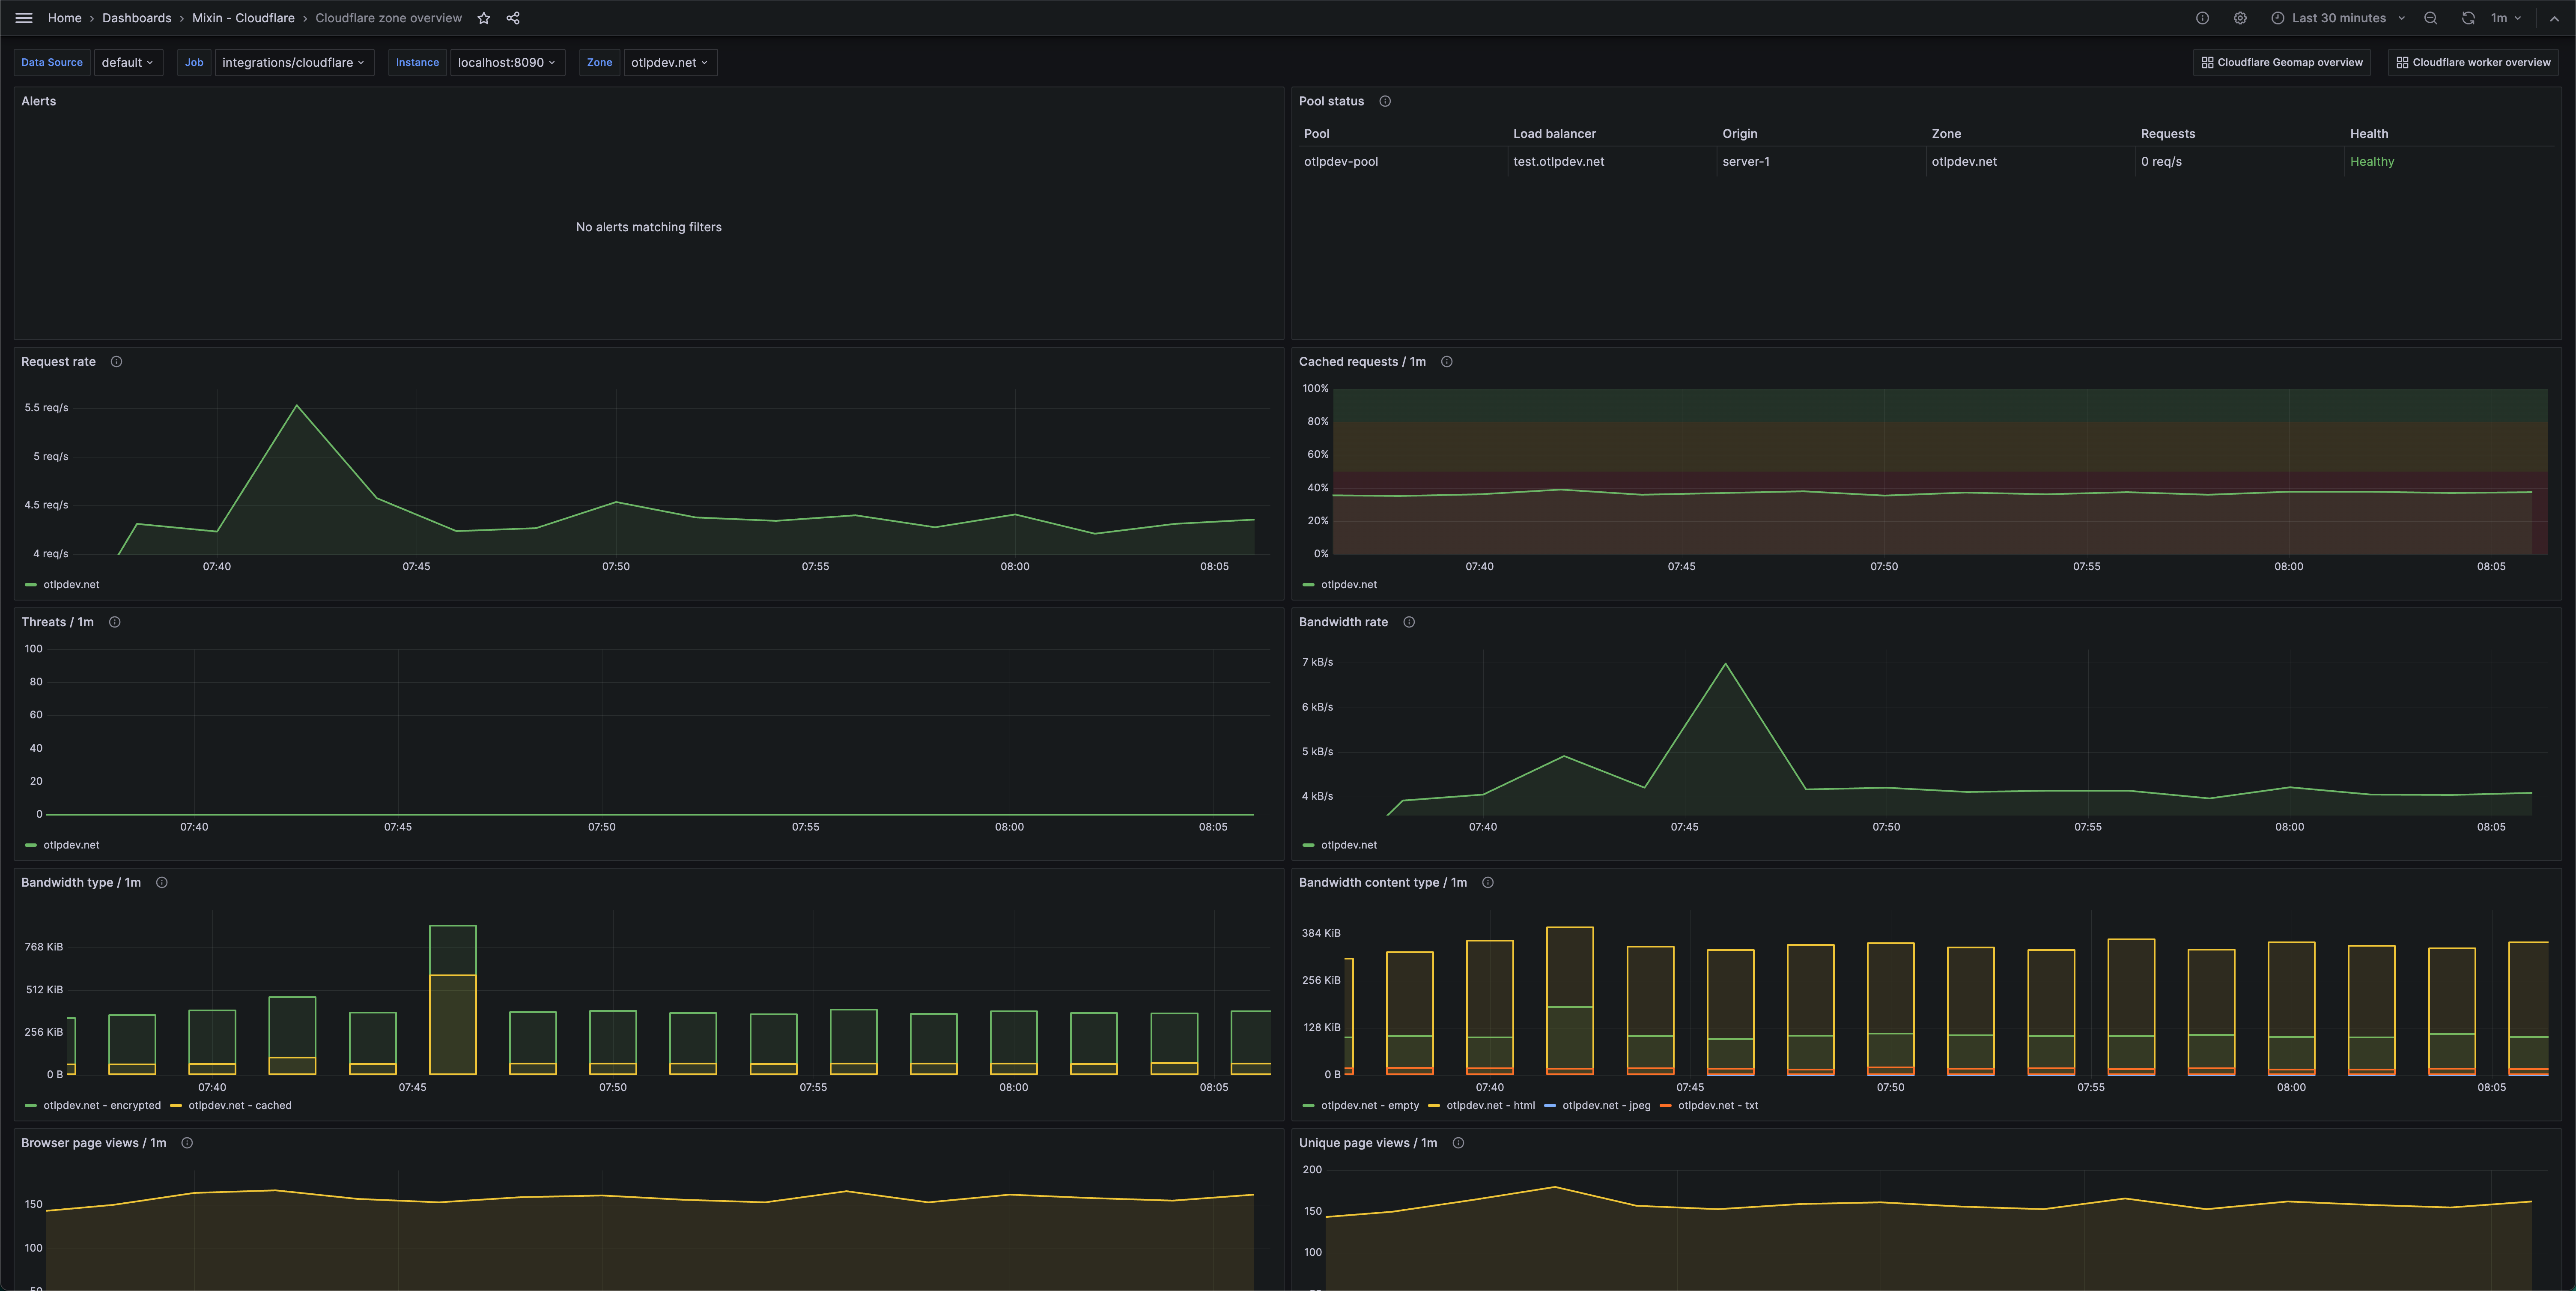
- Cloudflare zone overview
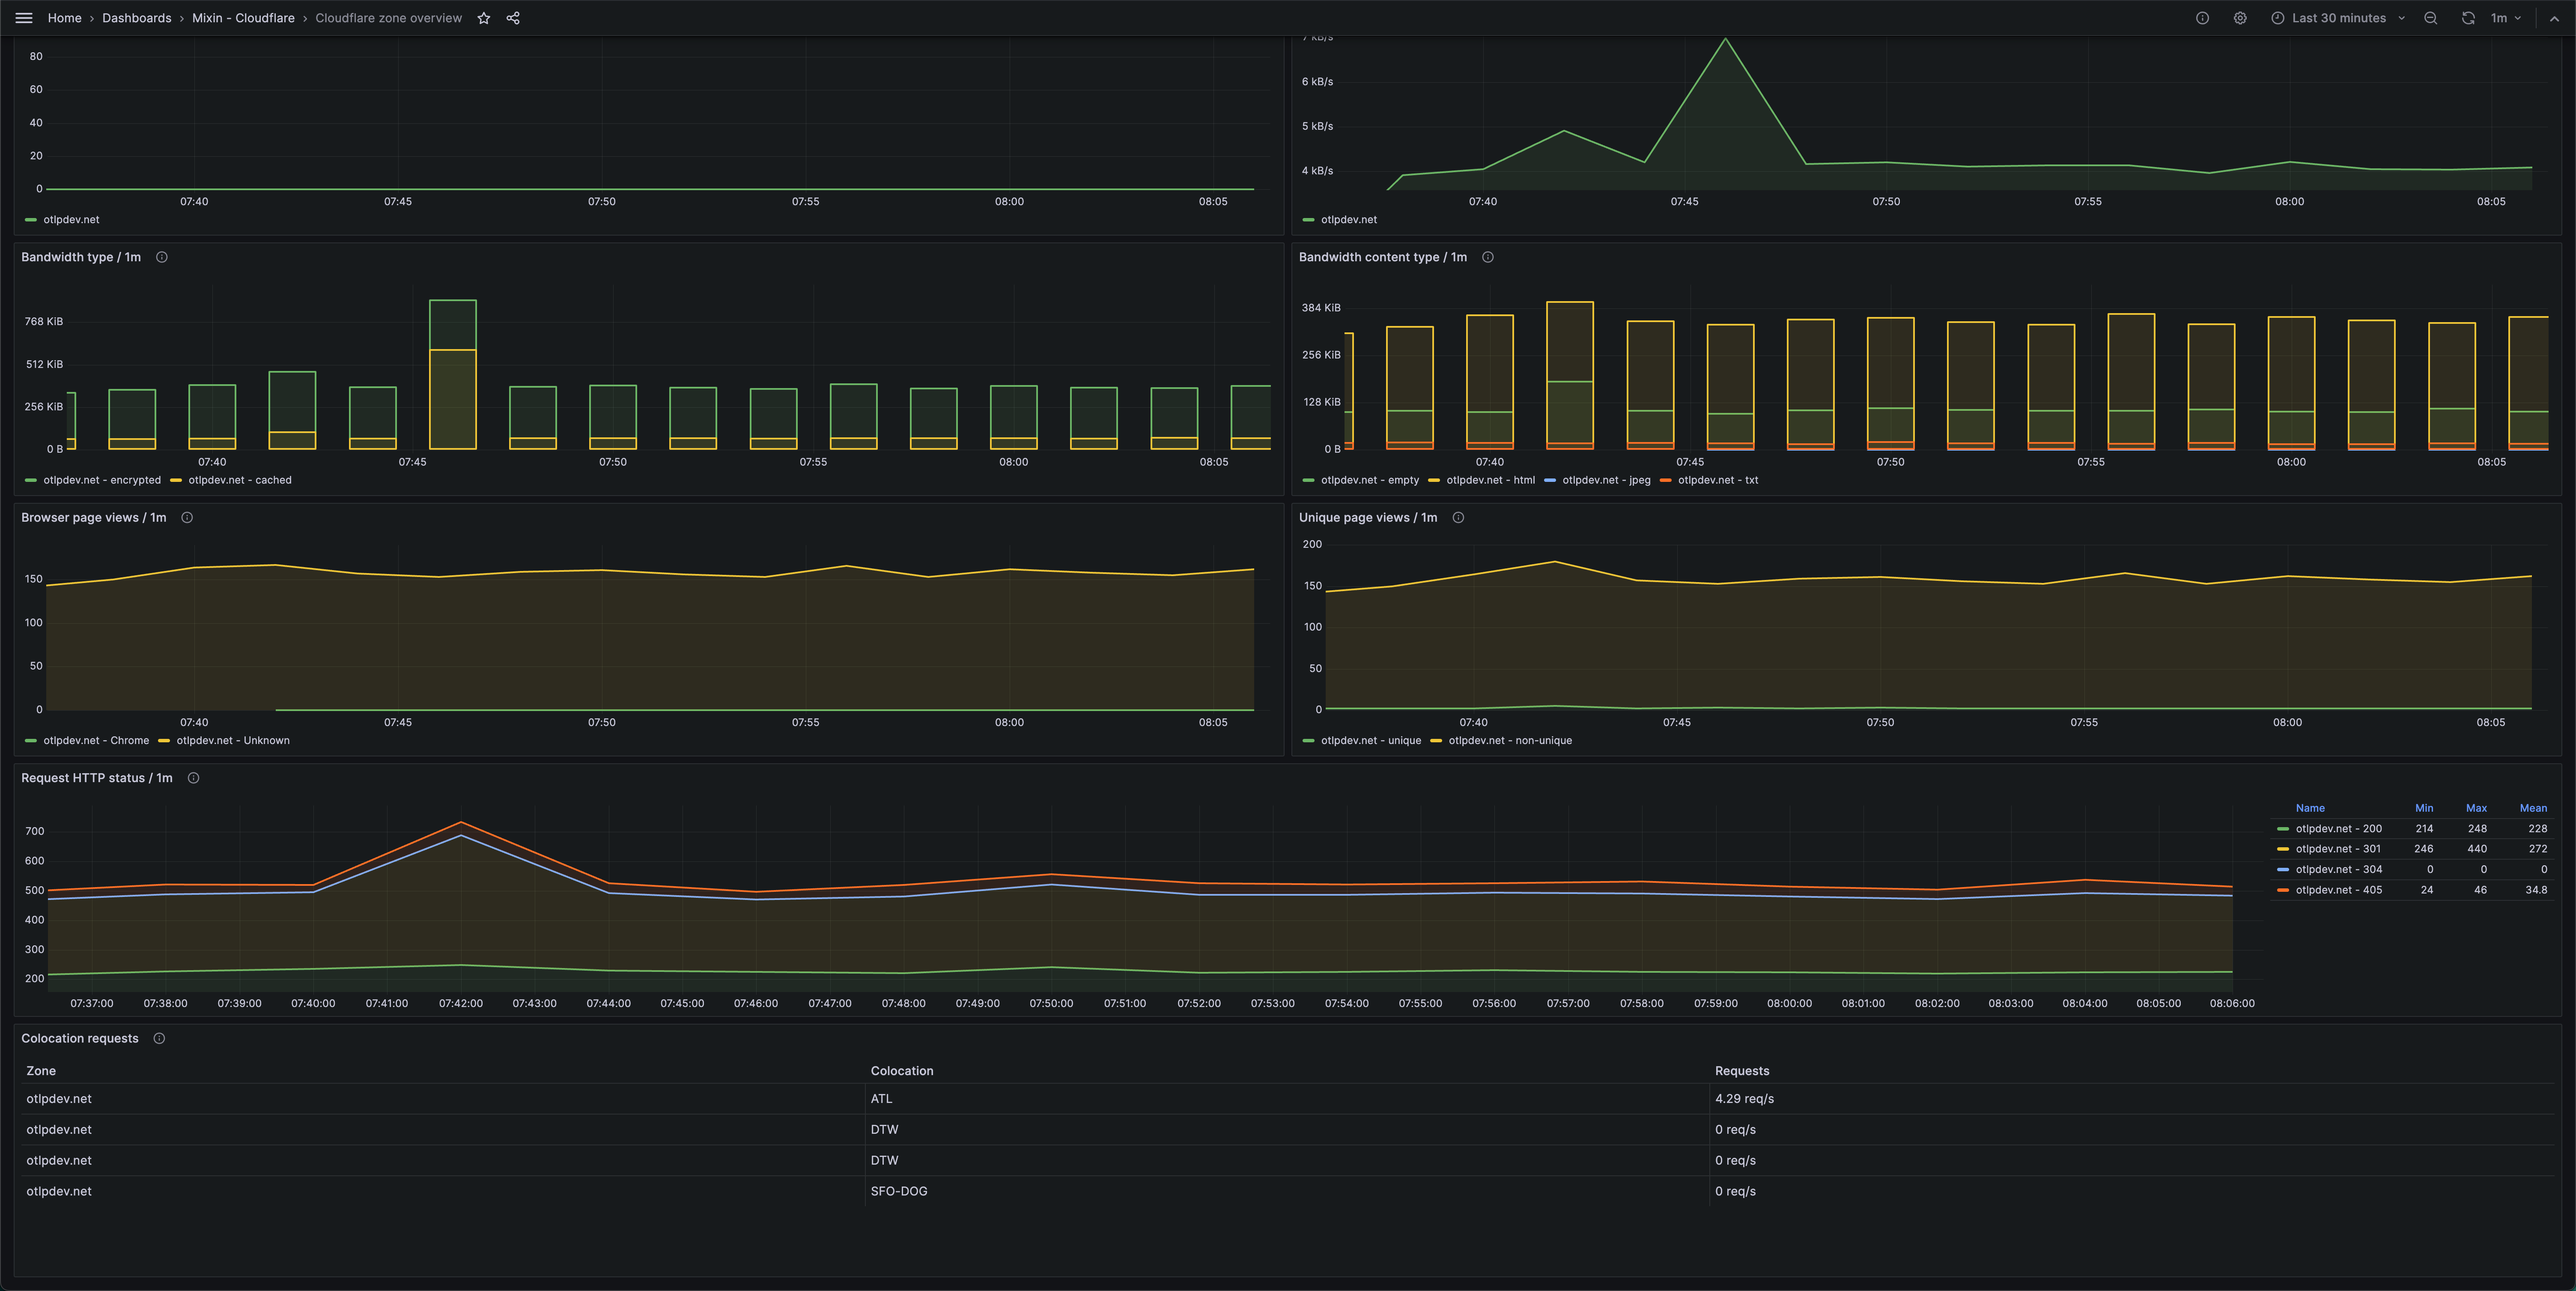
Cloudflare zone overview 1
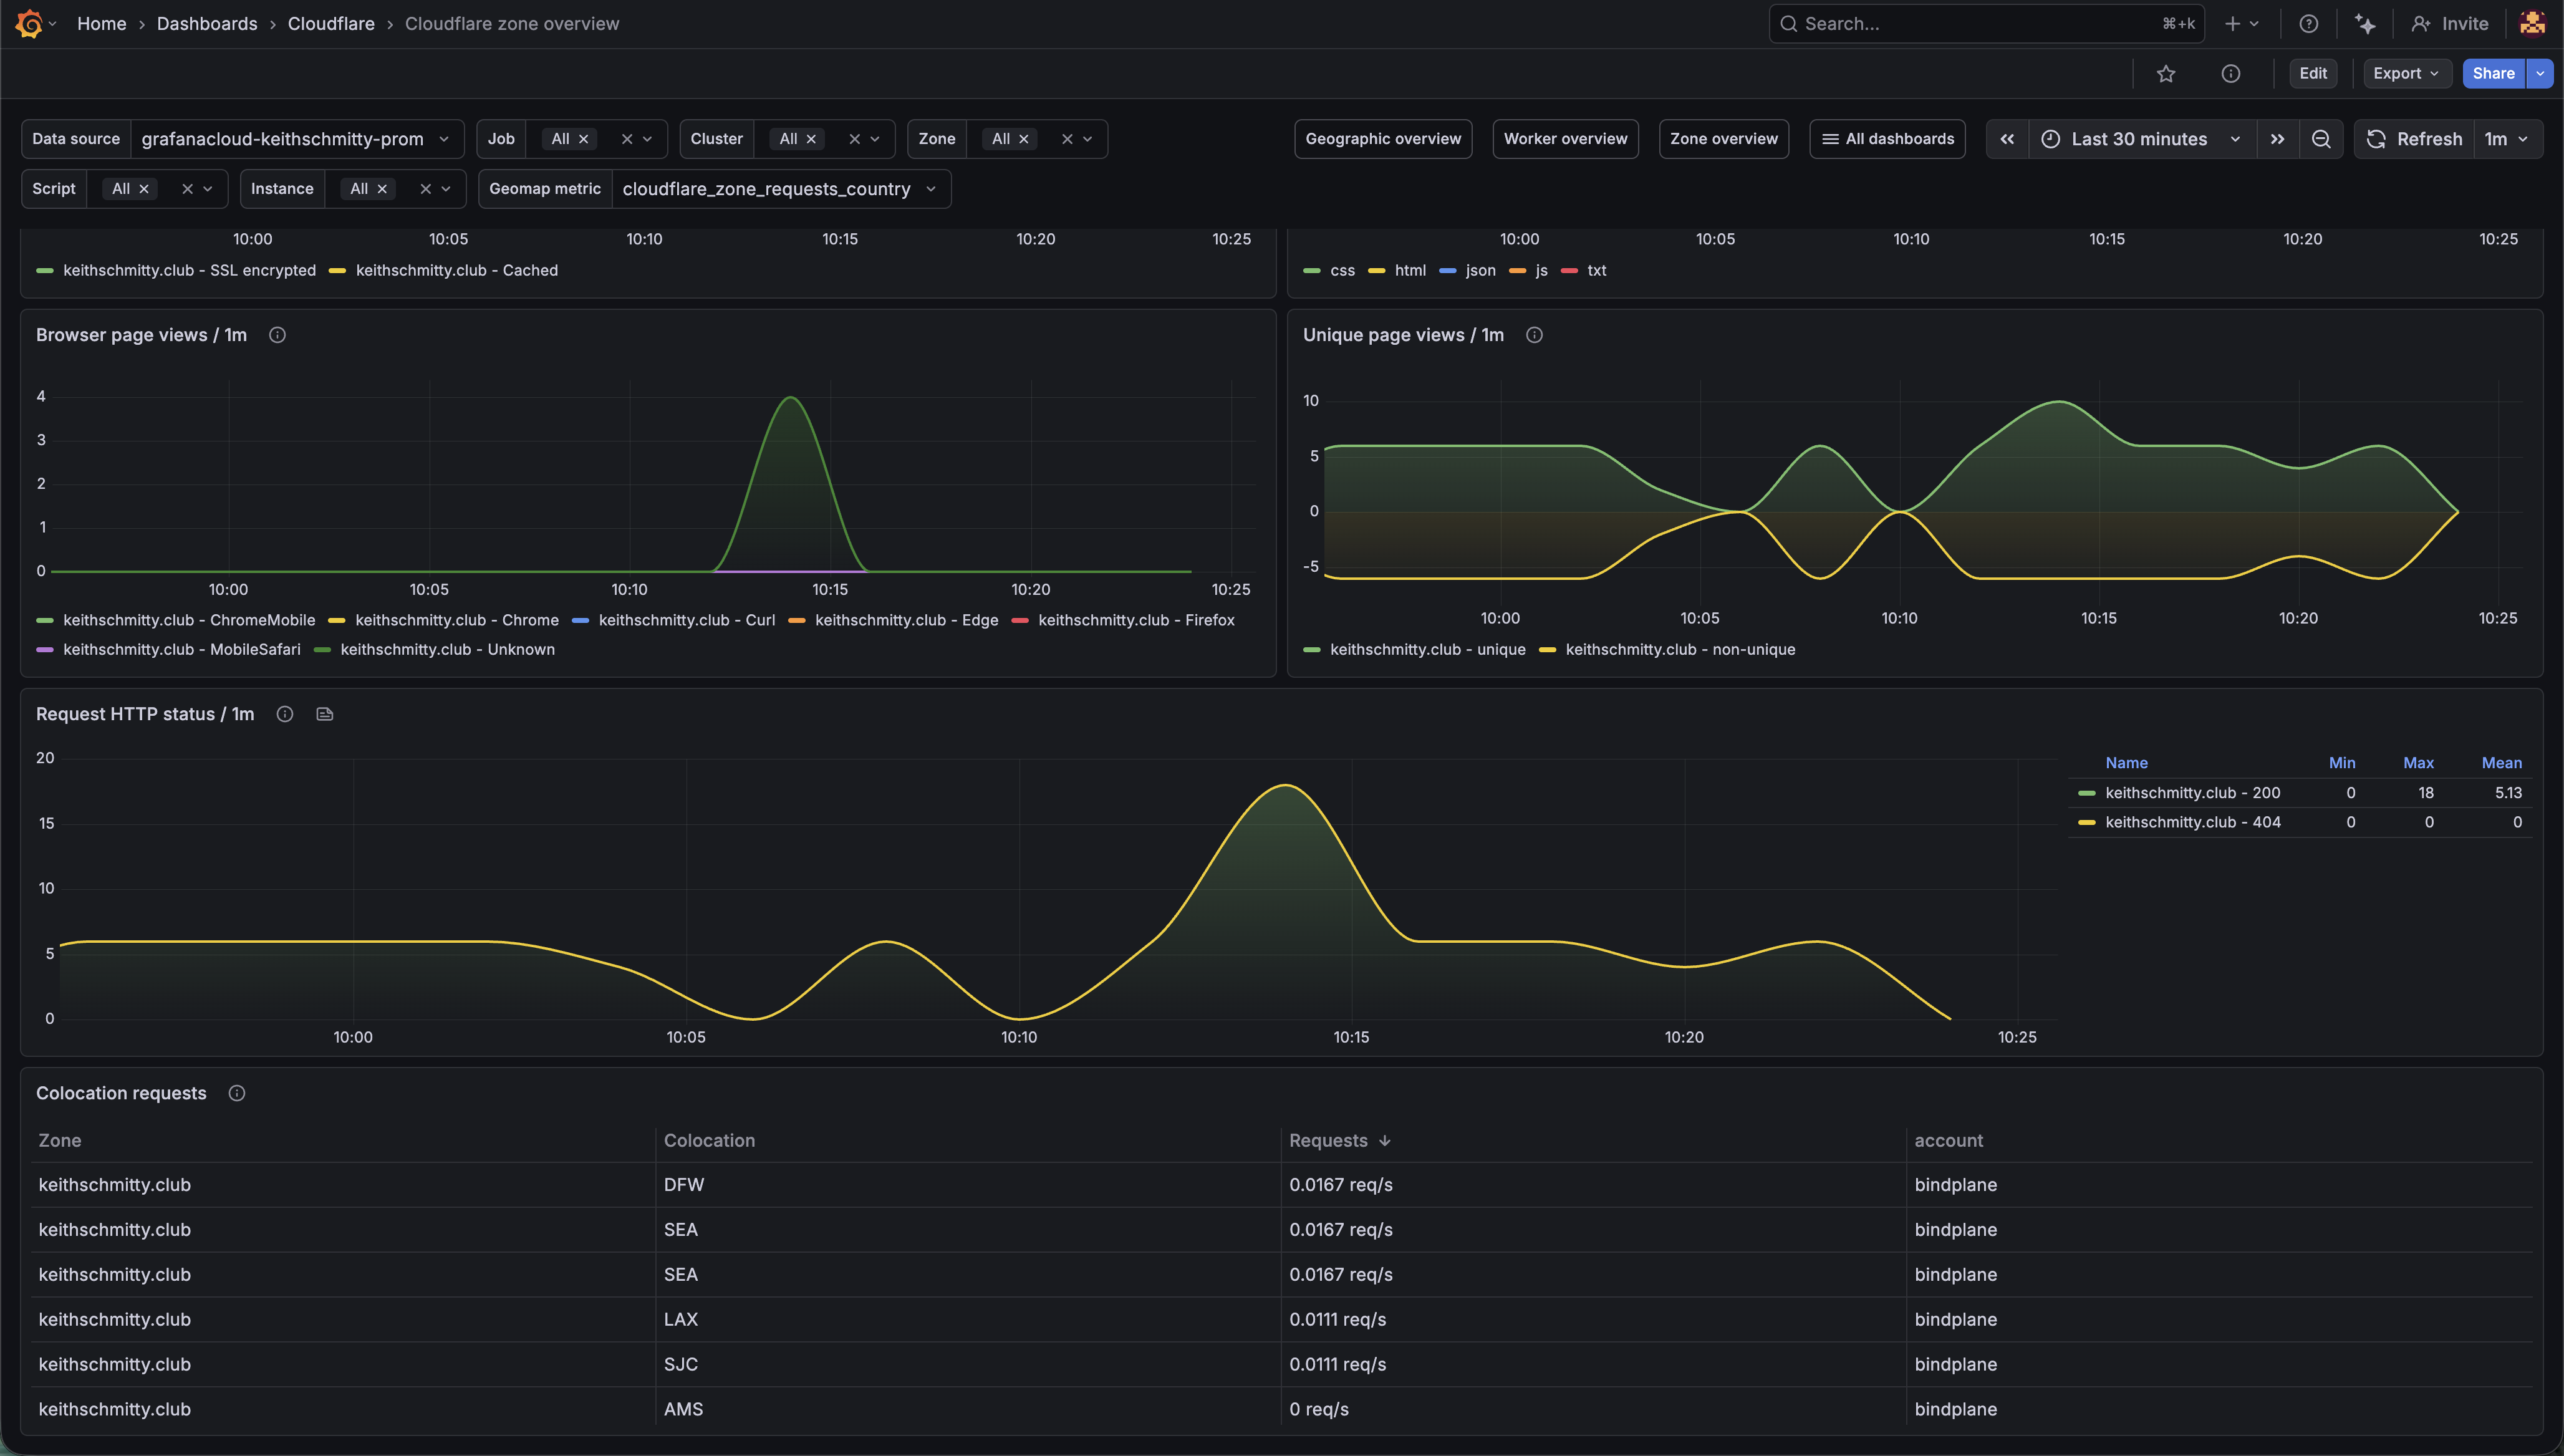
Cloudflare zone overview 2
Cloudflare zone overview 3
Alerts
The Cloudflare integration includes the following useful alerts:
Metrics
The most important metrics provided by the Cloudflare integration, which are used on the pre-built dashboards and Prometheus alerts, are as follows:
- cloudflare_worker_cpu_time
- cloudflare_worker_duration
- cloudflare_worker_errors_count
- cloudflare_worker_requests_count
- cloudflare_zone_bandwidth_cached
- cloudflare_zone_bandwidth_content_type
- cloudflare_zone_bandwidth_ssl_encrypted
- cloudflare_zone_bandwidth_total
- cloudflare_zone_colocation_requests_total
- cloudflare_zone_pageviews_total
- cloudflare_zone_pool_health_status
- cloudflare_zone_pool_requests_total
- cloudflare_zone_requests_browser_map_page_views_count
- cloudflare_zone_requests_cached
- cloudflare_zone_requests_status
- cloudflare_zone_requests_total
- cloudflare_zone_threats_total
- cloudflare_zone_uniques_total
- up
Changelog
# 1.1.1 - June 2026

- Fixed issue with default filtering selectors

# 1.1.0 - May 2026

- Updated dashboards to follow new stylistic standards
- Renamed dashboard "Cloudflare Geomap overview" to "Cloudflare geomap overview"

# 1.0.2 - December 2024

- Only return latest metric in status panel check query

# 1.0.1 - November 2024

- Update status panel check queries

# 1.0.0 - November 2023

* Initial release
Cost
By connecting your Cloudflare instance to Grafana Cloud, you might incur charges. To view information on the number of active series that your Grafana Cloud account uses for metrics included in each Cloud tier, see Active series and dpm usage and Cloud tier pricing.


