Panel editor
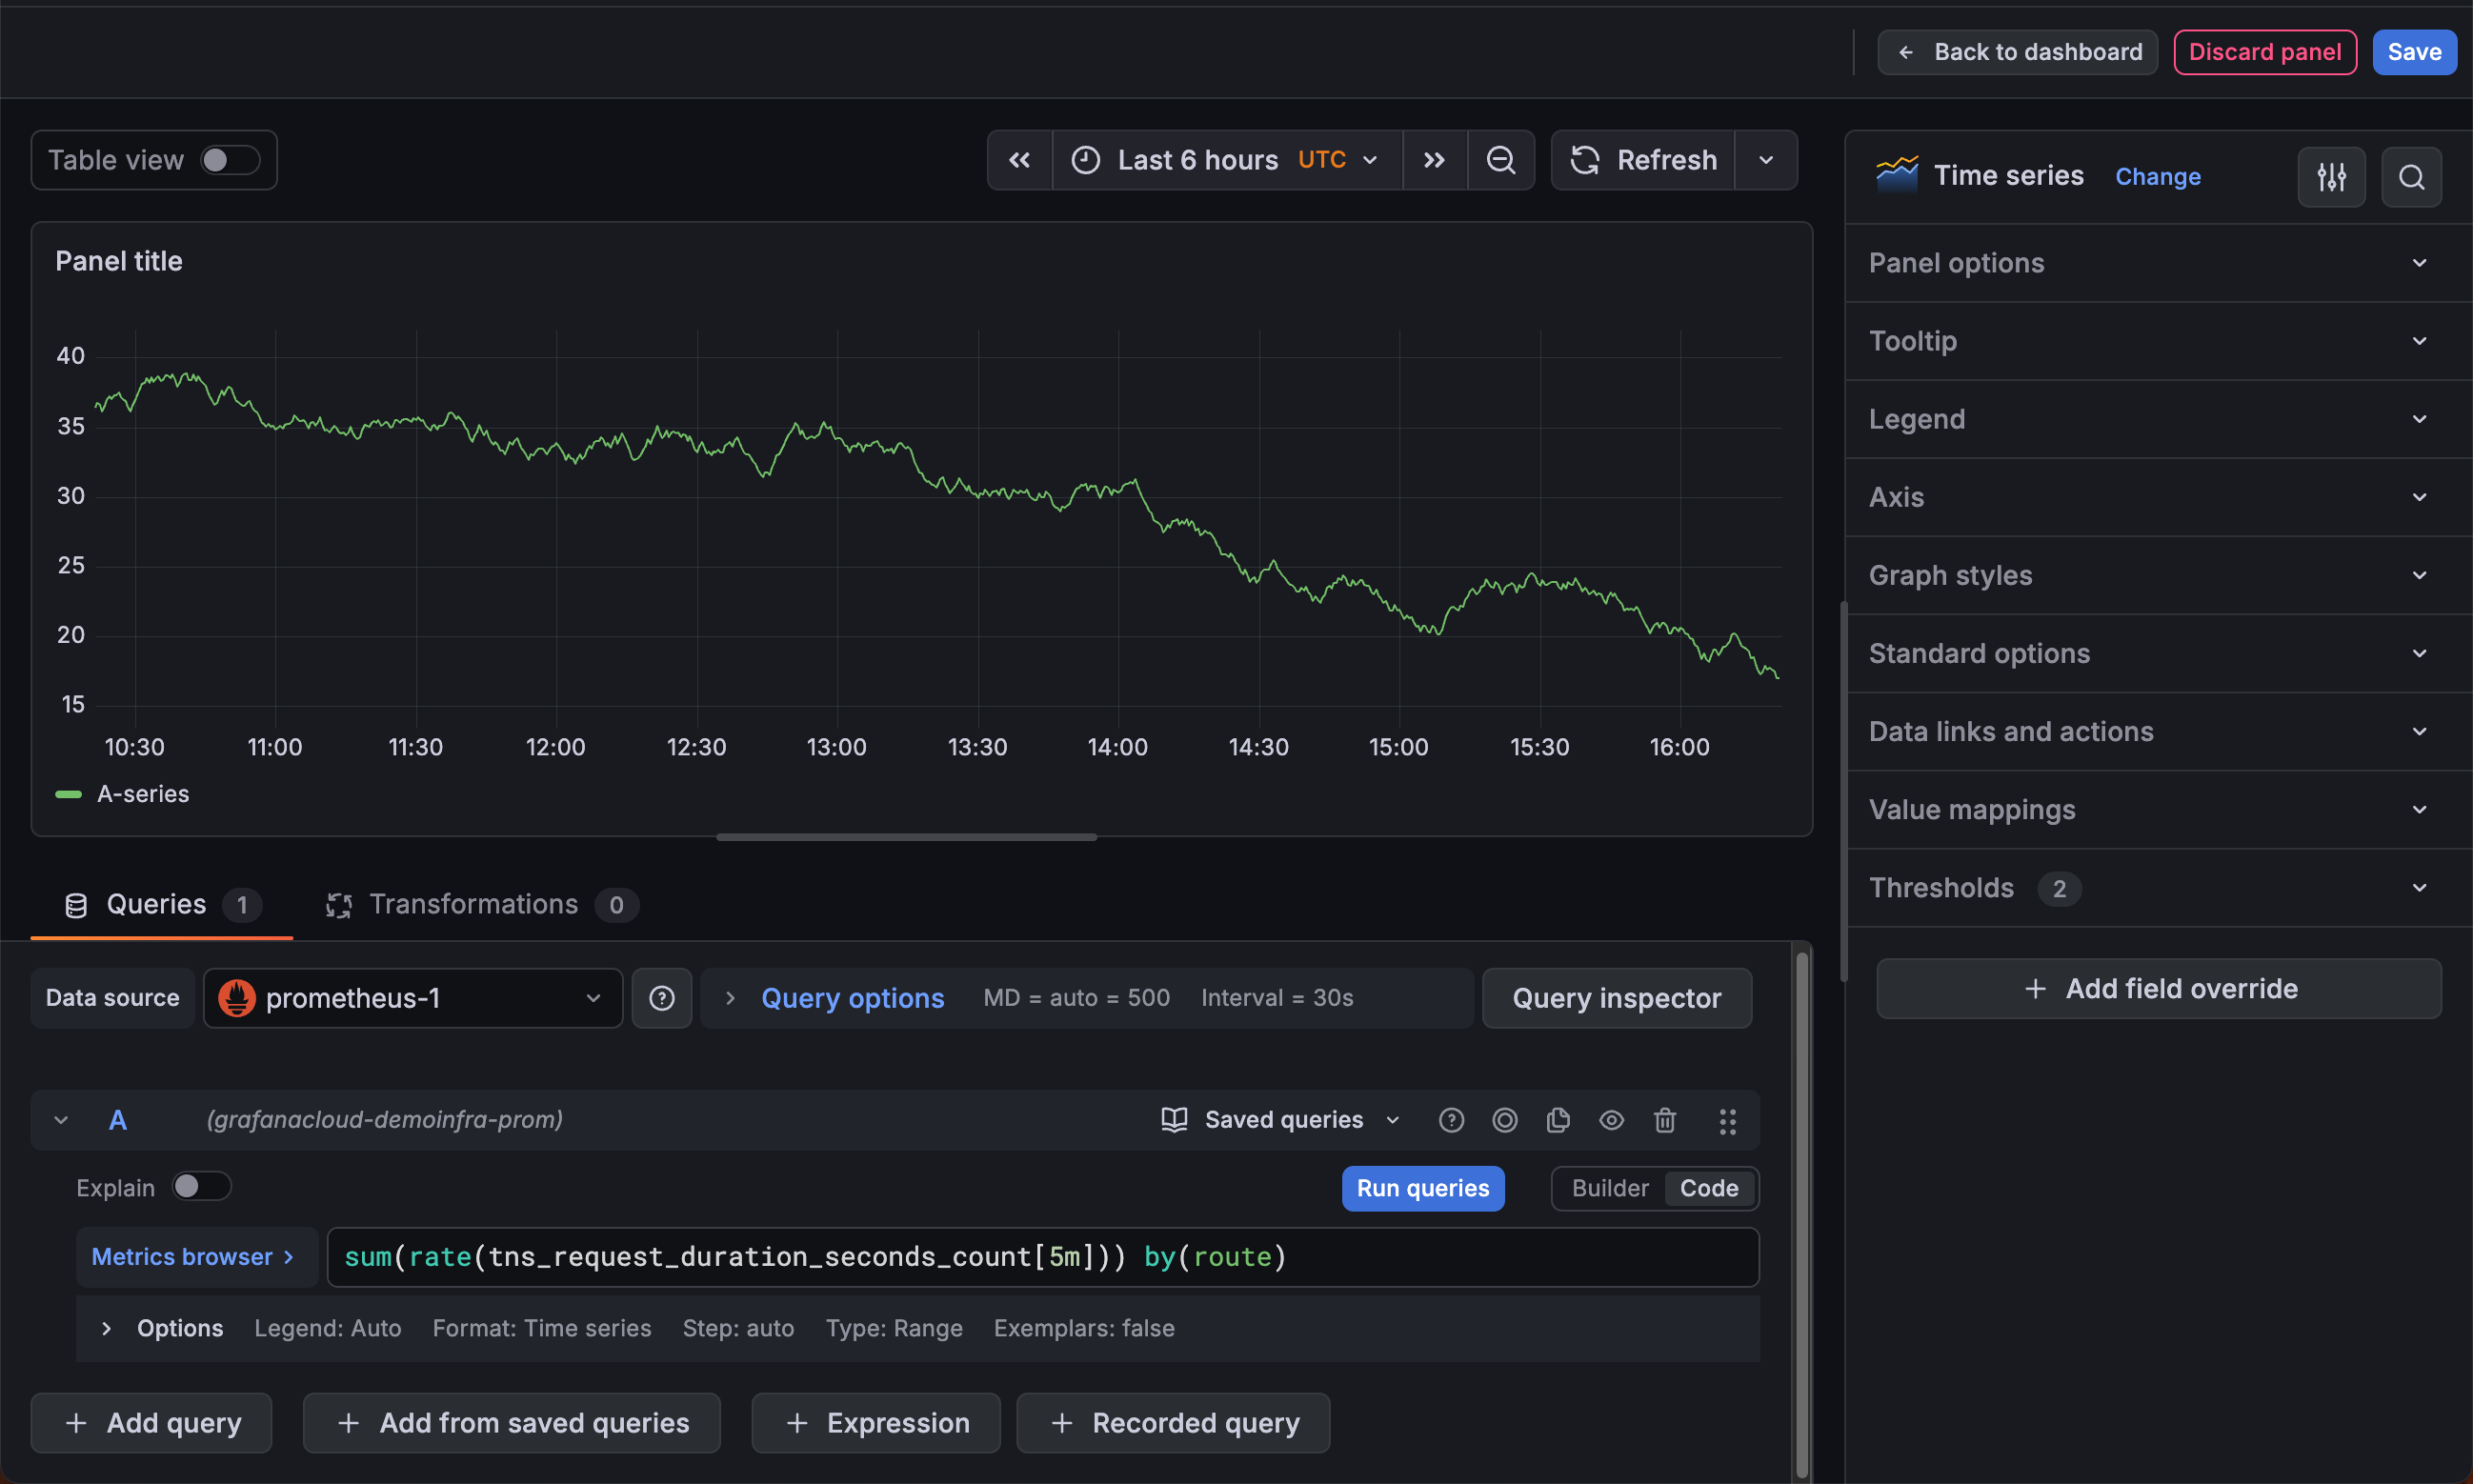
In the panel editor, you can update all the elements of a visualization including the data source, queries, time range, and visualization display options.
This following sections describe the areas of the Grafana panel editor.
Panel header
The header section lists the dashboard in which the panel appears and the following controls:
- Back to dashboard - Return to the dashboard with changes applied, but not yet saved.
- Discard panel changes - Discard changes you have made to the panel since you last saved the dashboard.
- Save - Save your changes to the dashboard.
Visualization preview
The visualization preview section contains the following options:
- Table view - Convert any visualization to a table so you can see the data. Table views are helpful for troubleshooting. This view only contains the raw data. It doesn’t include transformations you might have applied to the data or the formatting options available in the table visualization.
- Time range controls - Default is either the browser local timezone or the timezone selected at a higher level.
- Refresh - Query the data source.
Data section
The data section contains tabs where you enter queries, transform your data, and create alert rules (if applicable).
Queries
- Select your data source. You can also set or update the data source in existing dashboards using the drop-down menu in the Queries tab.
- Saved queries:
- Save query - To save the query for reuse, click the Save query button (or icon).
- Replace query - Reuse a saved query.
- + Add query - Add an additional query.
- + Add from saved queries - Add an additional query by reusing a saved query.
Note
Saved queries is currently in public preview in Grafana Enterprise and Grafana Cloud only.
Transformations - Apply data transformations. For more information, refer to Transform data.
Alert - Write alert rules. For more information, refer to the overview of Grafana Alerting.
Panel display options
The display options section contains tabs where you configure almost every aspect of your data visualization.
When you first open the panel editor, Grafana analyzes your query results and suggests visualizations that suit the shape of the data. You can select a suggested visualization or click All visualizations to browse the full list of available panel types. After you’ve selected a visualization, the display options section provides further configuration.
For more information about individual visualizations, refer to Visualizations options.
Panel styles
While visualization suggestions help you choose which panel type to use, panel styles help you decide how that panel should look. The Panel styles section of the panel editor sidebar contains preconfigured options for the currently selected visualization. It appears after you’ve selected a visualization and the panel has data.
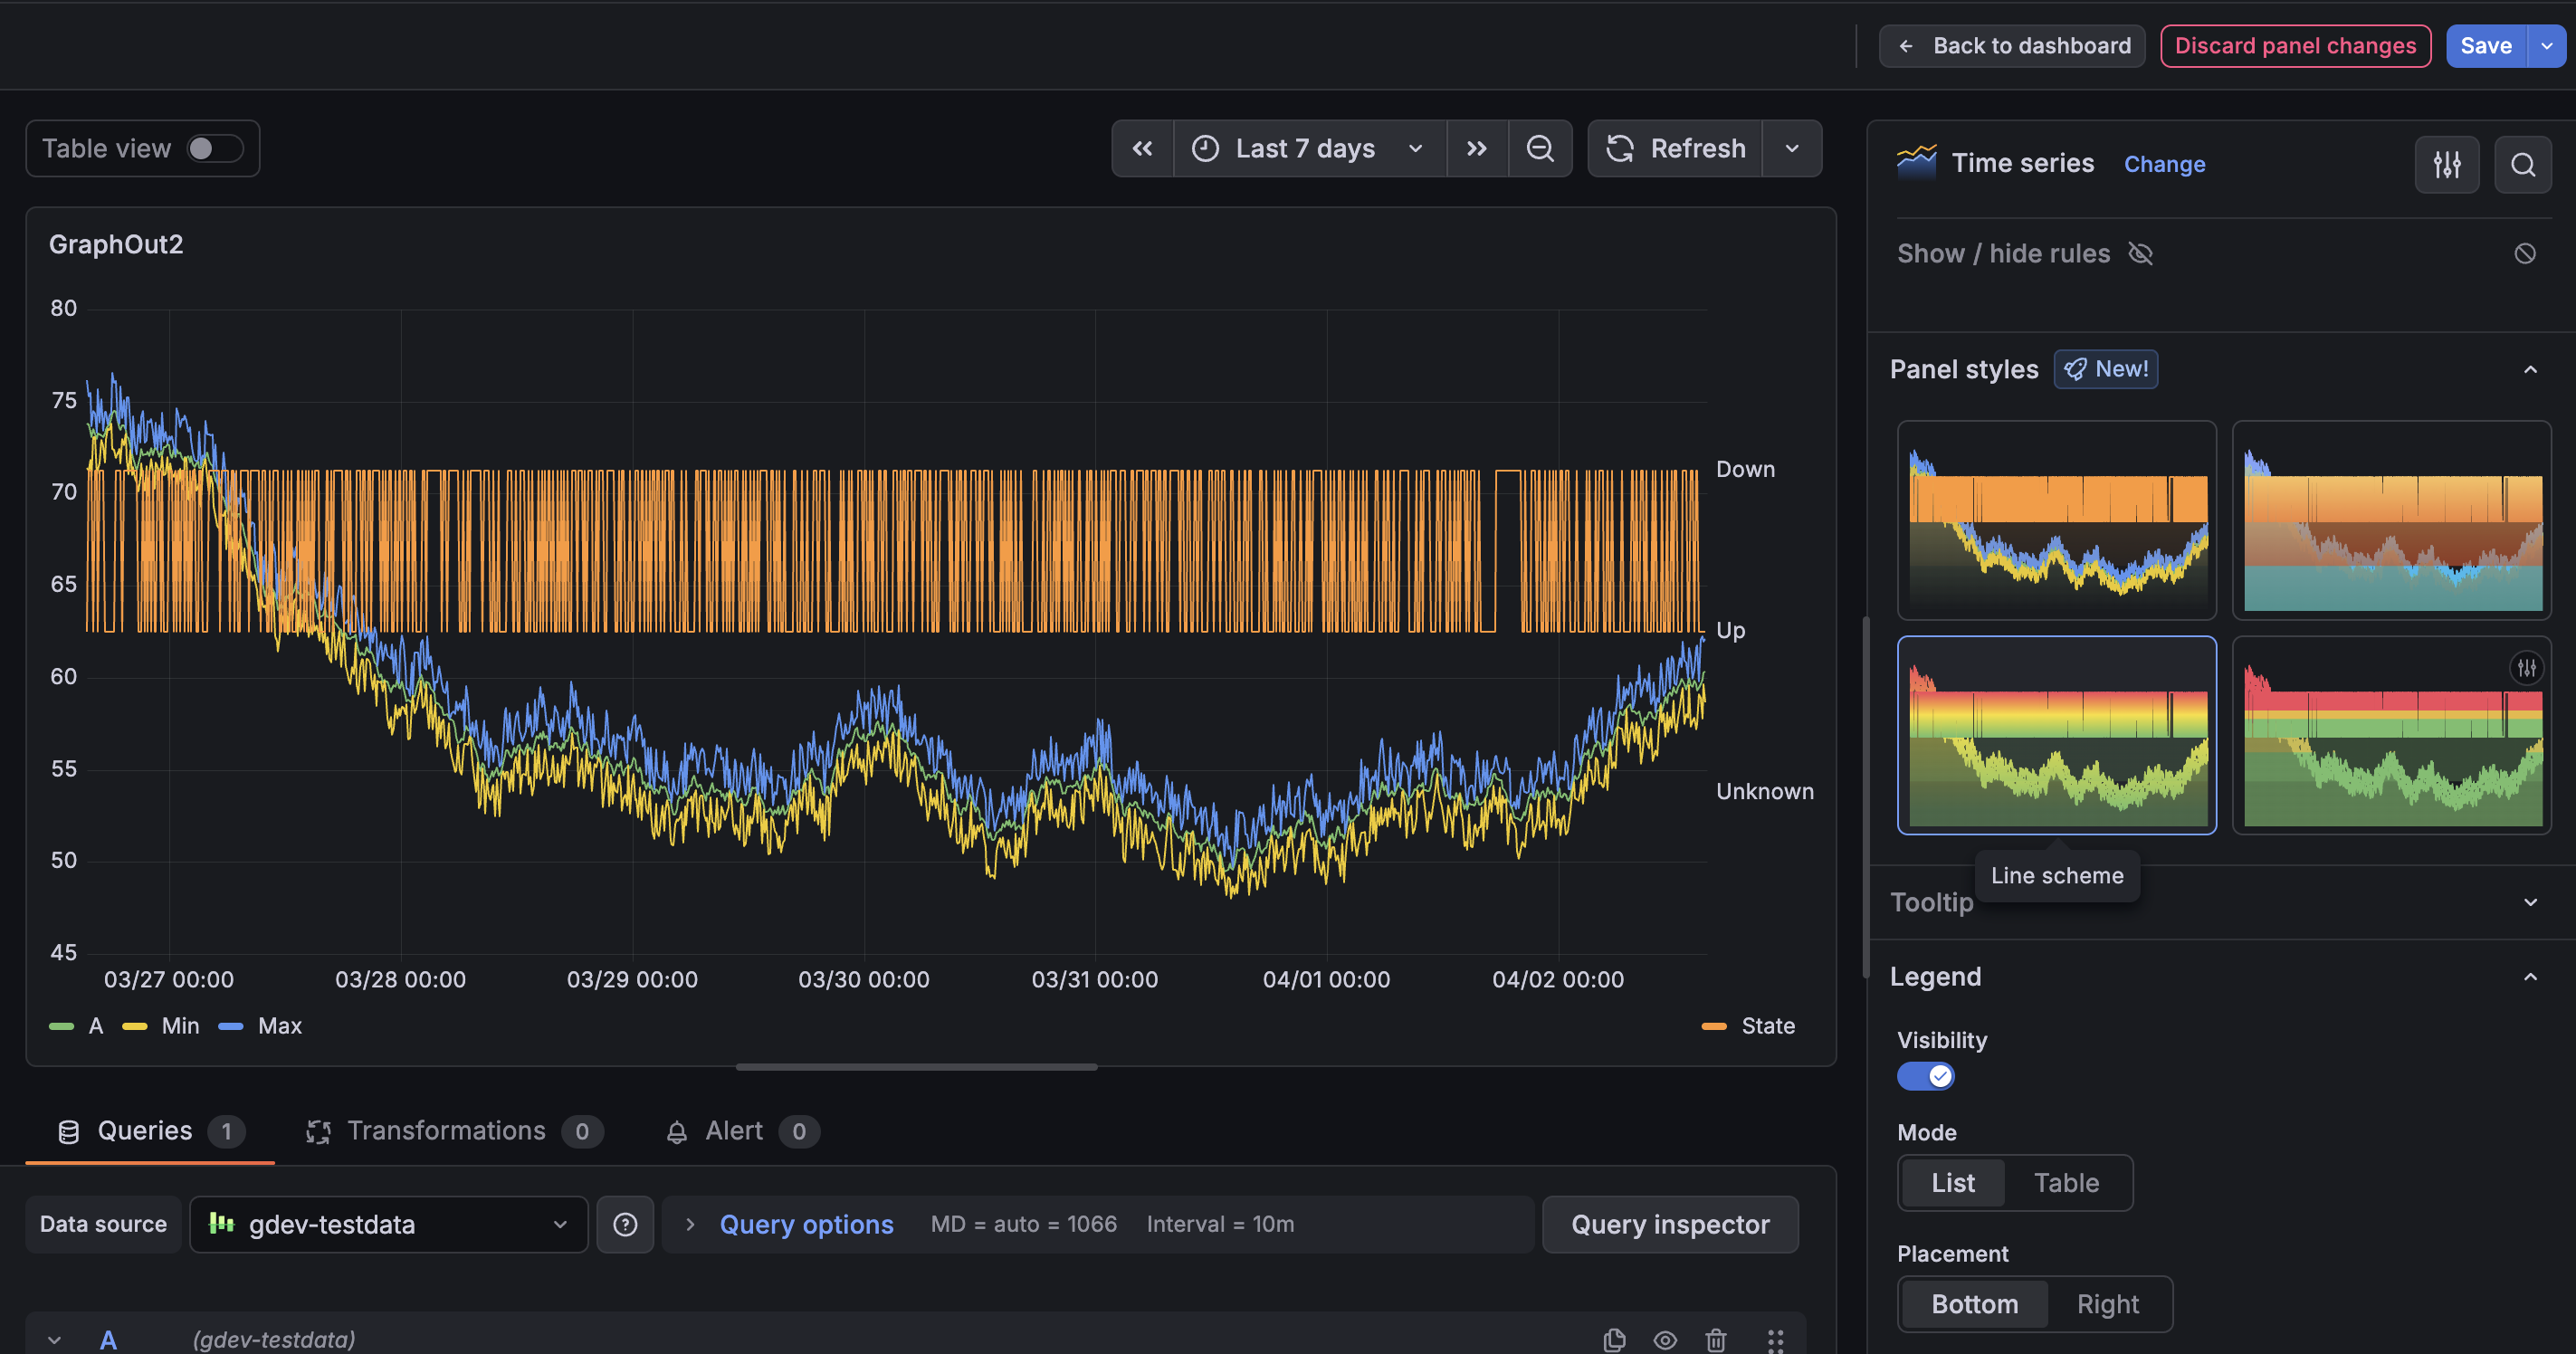
Each style is displayed as a live preview card that shows how it changes the visualization. Clicking a style applies a combination of display options and field configuration to the panel. For example, changing a style might switch a time series visualization from a line chart with a gradient fill to a stacked bar chart, or update the color scheme and graph mode of a stat visualization.
Panel styles merge their settings with the panel’s existing defaults as follows:
- Only the fields the style defines are changed.
- Styles can modify thresholds and color settings—any preset that modifies thresholds displays a badge on the preview card.
- Styles don’t affect field overrides
You can further customize the panel after applying a style.
Panel styles are available for the following visualizations:
- Bar chart
- Bar gauge
- Candlestick
- Gauge
- Heatmap
- Histogram
- Pie chart
- Stat
- State timeline
- Status history
- Time series
- Trend
- XY chart
However, plugin authors can add panel styles support to their own panel plugins as well.
Copy and paste panel styles
You can duplicate the styles of one panel in another panel with the same visualization type. Use the Copy styles and Paste styles options to do so:
To copy and paste a panel style, follow these steps:
- Navigate to the dashboard you want to update.
- Click Edit.
- Navigate to the panel with the style you want to copy.
- Hover over any part of the panel you want to work on to display the menu on the top right corner.
- Click the menu and select Styles > Copy styles.
- Navigate to the panel on which you want to copy the style.
- Click the panel menu and select Styles > Paste styles.
- Save your changes.
Note
Copying and pasting styles doesn’t copy query information or field overrides.


