Metrics Endpoint integration for Grafana Cloud
With the Metrics Endpoint integration, you can automate the scraping of any Prometheus or OpenMetrics compatible publicly accessible URL. The scraped metrics are then stored in Grafana Cloud, without requiring any additional infrastructure. You can set up multiple configurations, known as “scrape jobs”, to simultaneously monitor multiple URLs.
Before you begin
- Authentication - This integration offers authentication through Basic and Bearer Token models.
- IP allow listing - If your network requires external services to be on an allowlist to grant access, add the following IPs listed under ‘Hosted Grafana’ to allow metrics scraping.
Install Metrics Endpoint integration for Grafana Cloud
- In your Grafana Cloud stack, click Connections in the left-hand menu.
- Find and select the Metrics Endpoint tile to open the integration.
- Review the prerequisites on the Configuration page and follow the steps in the next section to configure scrape jobs and start sending your metrics to Grafana Cloud.
- Once scrape jobs are configured, click Install to add any available pre-built dashboards to your Grafana Cloud instance.
Configuration
You must create a scrape job describing your configuration to set up the Metrics Endpoint integration. Scrape jobs enable you to create multiple instances of the integration that can collect metrics from distinct targets using unique authentication details. You can also query and filter your metrics by their specific job.
Create scrape jobs
To configure scrape jobs for the Metrics Endpoint integration, follow these steps:
- Give a unique name to your scrape job using only alphanumeric characters, dashes, and underscores. All metric series that this scrape job collects will be labeled with the associated scrape job name.
For example,
my_metric{job=myUniqueJobName}. - Input the public URL endpoint compatible with Prometheus or OpenMetrics that you want to scrape.
- Choose the scrape interval for your job. The default value of 1 minute should serve most use cases. A lower value will increase the DPM of the series collected - this may have billing implications. For more information refer to cost management and billing documentation.
- Choose the authentication method for the service you wish to scrape, either
BasicorBearer. If you select bearer, be sure to exclude the “Bearer” prefix. Note that it is mandatory to provide authentication details, and Grafana Cloud won’t accept a public URL that is not protected by authentication. - Test the connection to ensure that Grafana Cloud can connect to the public URL and scrape your metrics. If there is an error, an error message will specify the reason for the failure.
- Save the scrape job, which will automatically begin scraping your metrics and push them into your Grafana Cloud Metrics instance.
After installation, visit the Metrics Endpoint Overview dashboard to check the status of your scrape job or explore your metrics.
Troubleshooting errors
If there is an error creating scrape job, an error message will specify the reason for the failure. Common errors include:
- The domain name cannot be resolved. Only publicly accessible URLs served over https are allowed (no IP addresses or private network URLs)
- The URL redirects to somewhere else (redirects are not supported)
- The https certificate for the domain is not valid (for example, the certificate is self-signed, or it is expired, or it refers to the wrong hostname)
- The credentials provided are incorrect, or the URL authentication is misconfigured (for example, the URL can be accessed without authentication or it redirects to a login page)
Terraform support
You can use the Grafana Terraform Provider to manage Grafana Connections resources such as metrics endpoint scrape jobs. Check out the docs.
Dashboards
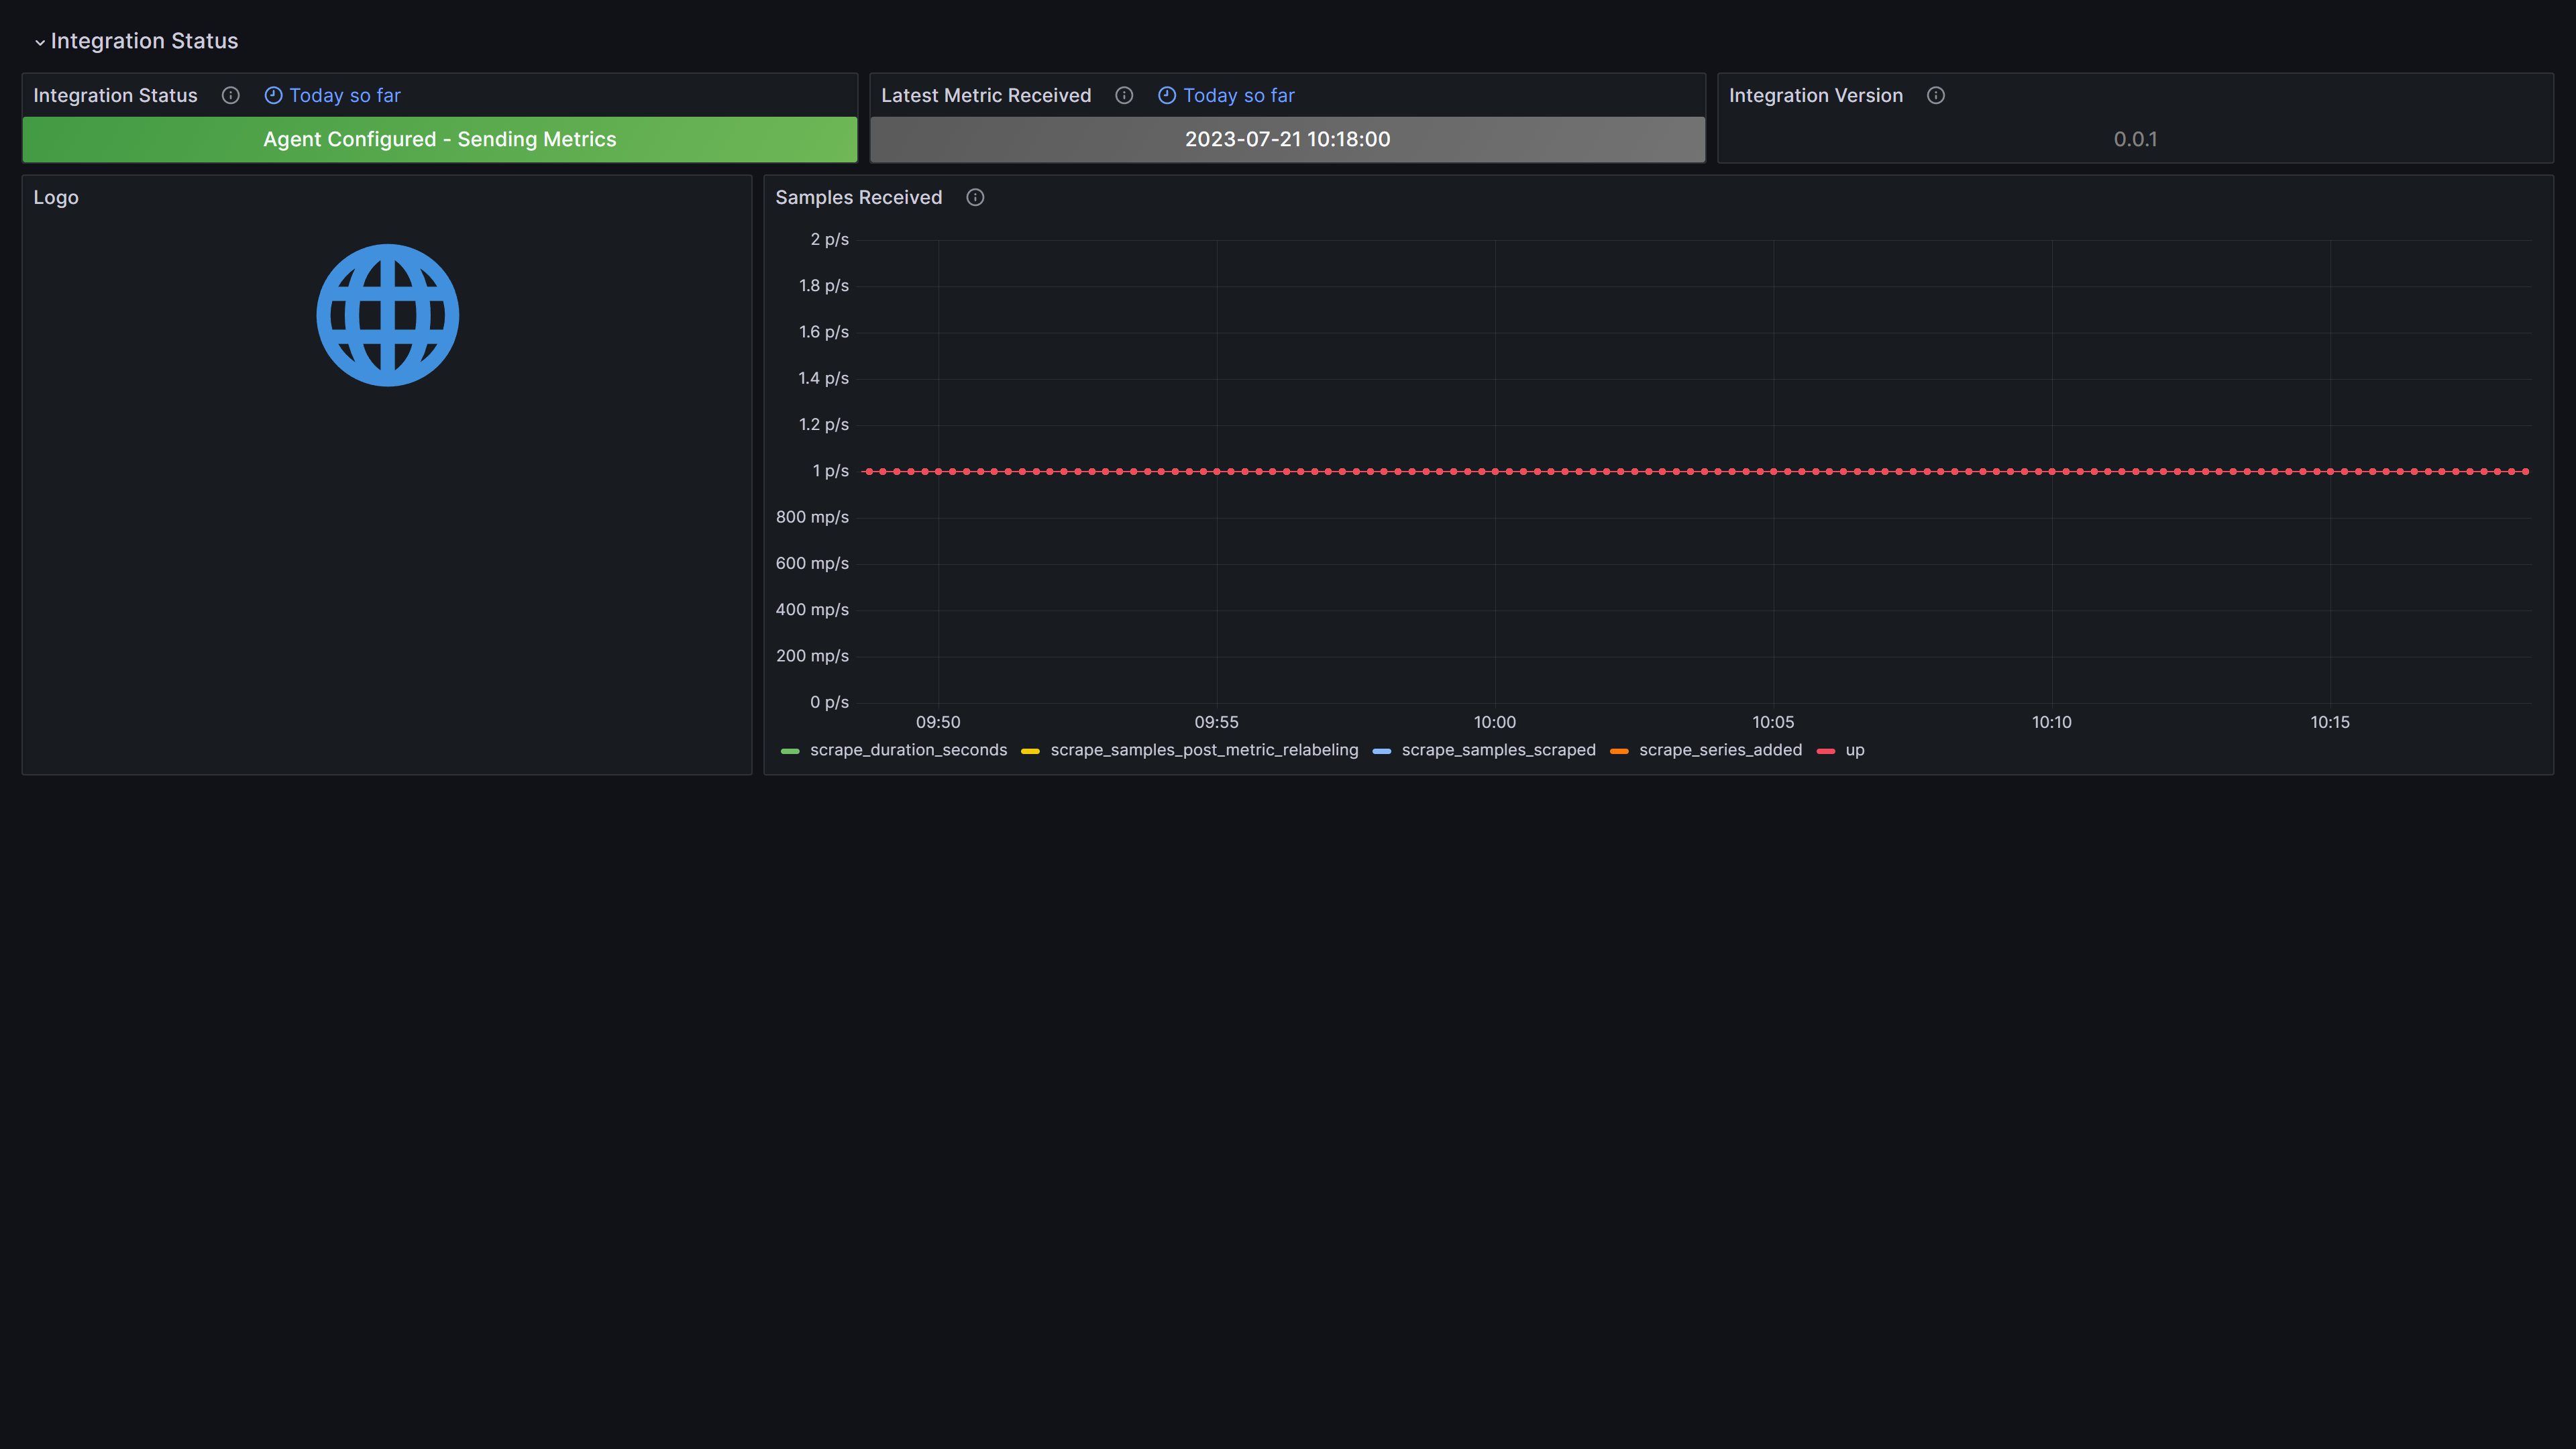
The Metrics Endpoint integration installs the following dashboard in your Grafana Cloud instance. This dashboard is designed to help monitor the rate of metrics being scraped as a mechanism for meta monitoring.
- Metrics Endpoint Overview
Metrics Endpoint Integration overview dashboard
Changelog
# 1.0.0 - December 2025

* Chore: Fix incorrect semver to 1.0.0. No further changes

# 0.0.2 - May 2024

Fix 'Overview' Dashboard reporting no data on 'Samples Received' panel

# 0.0.1 - September 2023

* Initial release

