Set up Grafana Cloud Traces using Grafana Alloy
The Grafana Cloud Hosted traces provides a convenient configuration guide for sending trace data via Grafana Alloy to your Grafana Cloud Traces instance.
To set up and use tracing in Grafana Cloud, you need to:
- Install Grafana Alloy
- Configure Grafana Alloy to send traces to Grafana Cloud Traces
- Verify traces are being received using visualizations

Grafana Learning Paths provide a clear, structured path that leads you from beginner concepts to advanced use cases. Learn about this Grafana feature on Send traces to Grafana Cloud.
Before you begin
To set up Grafana Cloud Traces, you need:
- A Grafana Cloud account (documentation)
- A Grafana Cloud stack, with an active Grafana instance (documentation)
- Elevated privileges on the host or hosts where Grafana Alloy is installed
- An app instrumented for tracing (refer to the Tempo instrumentation page)
Add traces to your Grafana instance
To start your Grafana instance and add Hosted traces:
- Sign in to your Grafana Cloud account in the Grafana Cloud Portal.
- Verify that your Organization is selected in the Organization drop-down in the upper left.
- Select Launch on the Grafana tile to access your instance.
- From the home page, select Connect data.
- Search for hosted traces. Select the Hosted traces tile.
Install Grafana Alloy
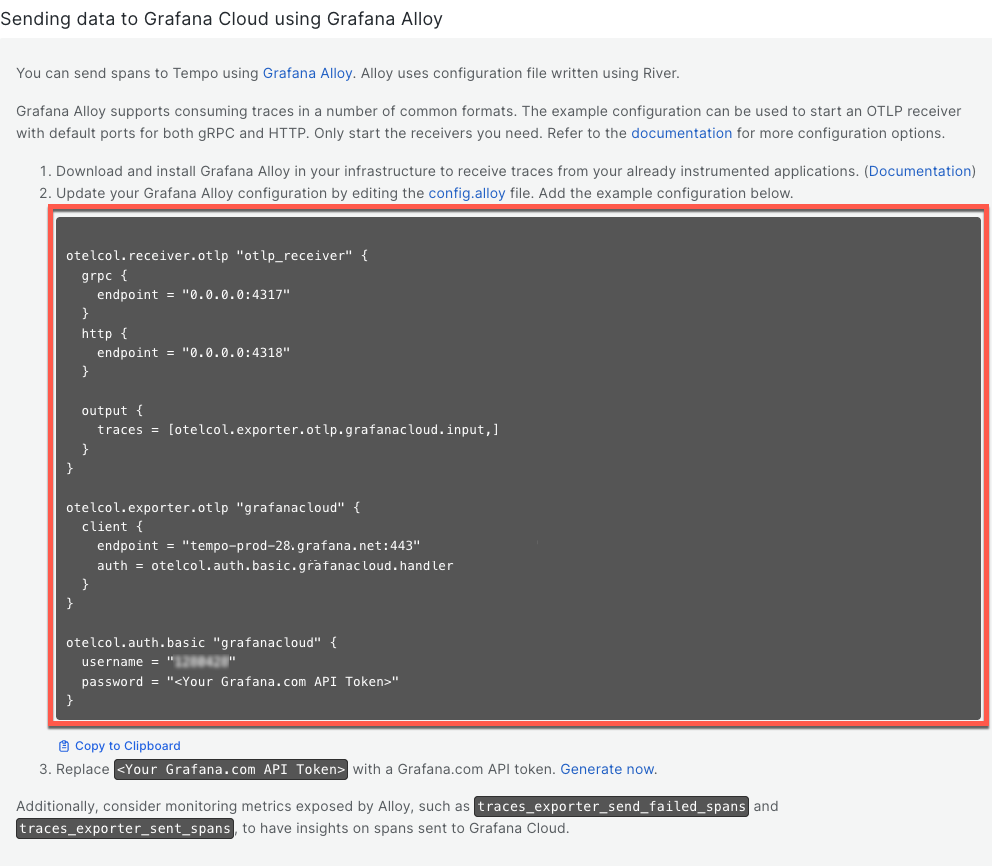
You can send spans to Grafana Cloud using Grafana Alloy. Alloy uses configuration file written using River. Grafana Alloy supports consuming traces in a number of common formats. The example configuration can be used to start an OTLP receiver with default ports for both gRPC and HTTP. Only start the receivers you need.
Installing Grafana Alloy differs for each operating system. Using the Grafana Alloy installation instructions provides additional benefits, such as adding the Grafana Alloy package repository to your system for easier updates.
Select your OS from the links below and follow the installation instructions.
For more information about installation options, refer to Grafana Alloy installation.
Configure Grafana Alloy to send traces to Grafana Cloud
Next, you need to generate the API token and add it to your Grafana Alloy configuration file. The API token is used by your Grafana instance to authenticate with the hosted traces instance.
For more information about Grafana Alloy configuration and syntax, refer to Alloy configuration syntax.
For an example basic configuration file, refer to Set up and use tracing.
To configure Grafana Alloy to send traces to Grafana Cloud Traces:
Navigate to the Grafana Cloud stack you want to send traces to.
Select Details from the Tempo section.
Generate a new token for sending data by selecting Generate now in the Sending data to Grafana Cloud using Grafana Alloy section. Copy the token.
Open or create an Alloy configuration file. The file location varies depending on your operating system. If the file doesn’t exist, you need to create it. Refer to Configure Grafana Alloy for more information.
- Linux:
/etc/alloy/config.alloy - macOS:
$(brew --prefix)/etc/alloy/config.alloy - Windows:
%ProgramFiles%\GrafanaLabs\Alloy\config.alloy
- Linux:
Copy the example configuration file from the Sending data to Grafana Cloud using Grafana Alloy section.
![Example configuration file]()
Paste your configuration into Alloy configuration file. Refer to Example configuration file for an example.
Save the changes to your configuration file.
Stop and restart Alloy. Refer to the Run Grafana Alloy documentation for details.
Optional: Add the batch processor for production environments
The batch processor is recommended for production environments. It helps to improve performance and reduce the number of requests to Grafana Cloud. Using the batch processor requires a change to the OTLP receiver traces output:
 output {
   traces = [otelcol.processor.batch.default.input]
 }
Add the batch processor to your configuration file by adding the following block before the otelcol.exporter.otlp block:
// Batch traces before exporting
// Recommended for production environments.
otelcol.processor.batch "default" {
  // Wait until receive 1000 samples, up to a maximum of 2000.
  send_batch_size = 1000
  send_batch_max_size = 2000
  // Or until 2 seconds have elapsed.
  timeout = "2s"
  // When the Alloy has enough batched data, send it to the OpenTelemetry exporter named 'tempo' for traces,
  // or the Prometheus exporter for metrics.
  output {
      traces = [otelcol.exporter.otlp.grafanacloud.input]
  }
}
Optional: Add receivers for other trace formats
You can include receivers for other trace formats than just OpenTelemetry OTLP, such as Zipkin, and Jaeger by modifying the configuration file. Add the following receivers to your configuration file:
otelcol.receiver.jaeger "jaeger_receiver" {
  protocols {
    grpc {}
    thrift_http {}
    thrift_binary {}
    thrift_compact {}
  }

  output {
    traces = [otelcol.exporter.otlp.grafanacloud.input,]
  }
}

otelcol.receiver.zipkin "zipkin_receiver" {
  output {
    traces = [otelcol.exporter.otlp.grafanacloud.input,]
  }
}
Optional: Batch processing
This example configuration file is for a Grafana Cloud stack with the default port and protocol and uses the batch processor for production environments.
If you use this example configuration file, replace the placeholder values in your configuration file with your actual Grafana Cloud credentials:
- Change
<YOUR_GRAFANA_CLOUD_TRACES_ENDPOINT>to your Grafana Cloud traces endpoint, for example,https://tempo-us-central1.grafana.net:443 - Change
<YOUR_GRAFANA_CLOUD_INSTANCE_ID>to your instance ID, for example,123456 - Change
<YOUR_GRAFANA_CLOUD_API_TOKEN>to your API token, for example,glc_eyJhbGciOiJIUzI1NiIsInR5cXXXXXXXVCJ9
// Receive OTLP traces on port 4317 (gRPC) and 4318 (HTTP)
otelcol.receiver.otlp "default" {
 grpc {
   endpoint = "0.0.0.0:4317"
 }

 http {
   endpoint = "0.0.0.0:4318"
 }

 output {
   traces = [otelcol.processor.batch.default.input]
 }
}

// Batch traces before exporting
// Recommended for production environments.
otelcol.processor.batch "default" {
   // Wait until receive 1000 samples, up to a maximum of 2000.
   send_batch_size = 1000
   send_batch_max_size = 2000
   // Or until 2 seconds have elapsed.
   timeout = "2s"
   // When the Alloy has enough batched data, send it to the OpenTelemetry exporter named 'tempo' for traces,
   // or the Prometheus exporter for metrics.
   output {
       traces = [otelcol.exporter.otlp.grafanacloud.input]
   }
}

// Export traces to Grafana Cloud
otelcol.exporter.otlp "grafana_cloud_traces" {
 client {
   endpoint = "<YOUR_GRAFANA_CLOUD_TRACES_ENDPOINT>:443"
   auth     = otelcol.auth.basic.grafanacloud.handler
 }
}

// Configure authentication for Grafana Cloud
otelcol.auth.basic "grafana_cloud_traces" {
 username = "<YOUR_GRAFANA_CLOUD_INSTANCE_ID>"
 password = "<YOUR_GRAFANA_CLOUD_API_TOKEN>"
}
Verify traces are received using Search
After you are sending data to Grafana Cloud, perform a search to verify that the data is received and accessible. For information on search, refer to Query tracing data.
Perform a search to check that data is received. For example, search for duration values between 5 and 100 milliseconds in the tracing data:
- Select Explore > Query type and choose Search.
- On the Duration fields, select > from the first drop-down, enter
5msin the first text box, select < from the next drop-down, and then enter100ms. - Select Run query to search for tracing data.
The results should display a list of trace IDs with start time, name, and durations.
Troubleshoot
If your traces don’t appear in Grafana Cloud, use the following troubleshooting tips:
- Verify that Grafana Alloy is running and check the logs for any errors. The Run Grafana Alloy documentation for your operating system provides the log file location.
- Ensure that your Grafana Cloud credentials are correctly configured in the Alloy configuration file.
Enable Alloy live debugging
Add this to your Alloy configuration file and restart Alloy:
livedebugging {
  enabled = true
}
Refer to Debug Grafana Alloy for details.
Check the configuration file
To validate the configuration file:
Check the Alloy configuration syntax and validate the setup:
alloy fmt /etc/alloy/config.alloyThis command formats your configuration and reports any syntax errors.
Check Alloy component status
To verify Alloy is running and check component status:
Open your web browser and navigate to
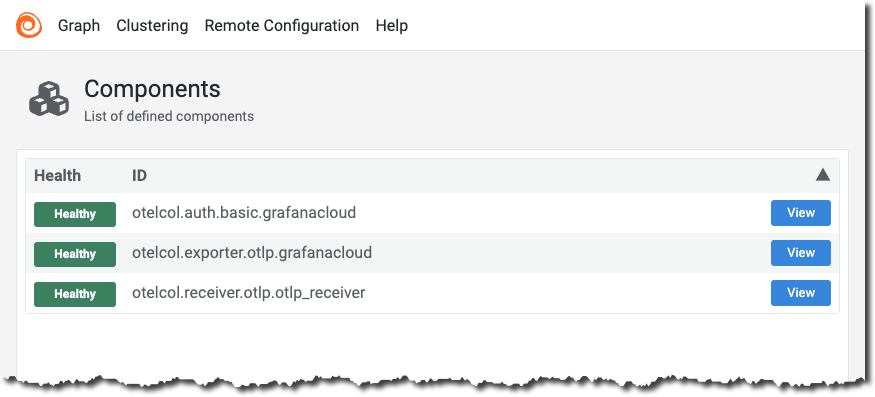
http://localhost:12345to access the Alloy web interface. You can use the web UI to monitor component status and trace flow.The web UI shows the status of each component, including the
otelcol.receiver.otlp,otelcol.processor.batch, andotelcol.exporter.otlpcomponents.![Grafana Alloy web interface showing the status of components including the otelcol.receiver.otlp, otelcol.processor.batch, and otelcol.exporter.otlp components.]()
Verify authentication configuration
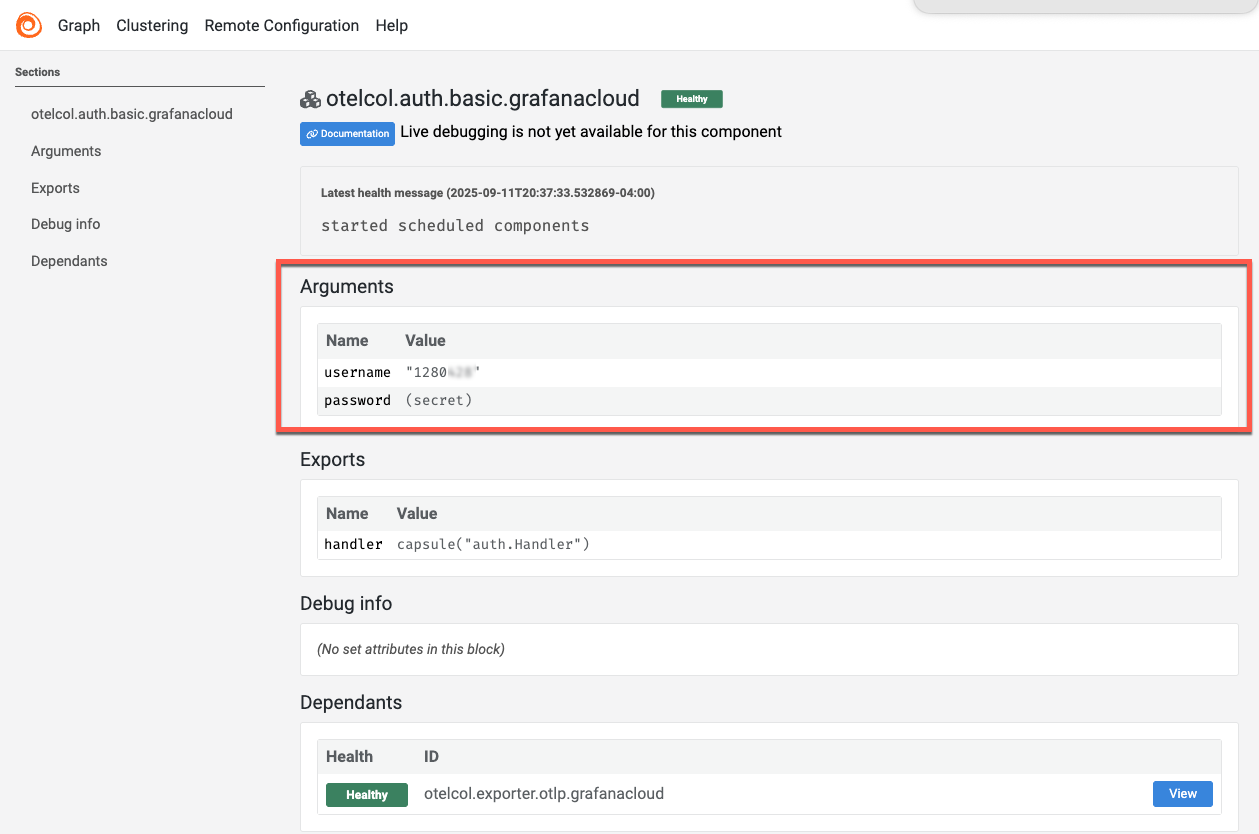
To verify that your Cloud username is correctly passed to Alloy, follow these steps:
- In the Alloy web UI, select
otelcol.auth.basic.grafanacloudfrom the Components list. - Under the Arguments section, verify that the
usernamefield matches your Grafana Cloud instance ID.![Grafana Alloy web interface showing the otelcol.auth.basic.grafanacloud component with the username field under Arguments.]()
Additional help
For more detailed help troubleshooting Alloy, refer to:


