Use traces in Grafana
Using Grafana Cloud Traces, you can search for traces, generate metrics from spans, and link your tracing data with logs, metrics, and profiles.
Use Grafana Assistant to investigate traces
Note
Grafana Assistant is currently in private preview. Grafana Labs offers support on a best-effort basis, and breaking changes might occur prior to the feature being made generally available.
Grafana Assistant is an AI-powered agent in Grafana Cloud that helps you query, build, and troubleshoot faster using natural language. It simplifies common workflows like writing PromQL, LogQL, or TraceQL queries, and creating dashboards.
To get started, either click on the Grafana Assistant symbol in the top-right corner of the Grafana stack UI, or find it in the main navigation on the left side of the page.
To learn more, refer to Investigate traces with Grafana Assistant.
Refer to the Grafana Assistant documentation for more information on how to use Grafana Assistant.
Query your data
Using tracing data in Grafana and Grafana Cloud Traces, you can search for traces, generate metrics from spans, and link your tracing data with logs, metrics, and profiles.
Note
Trace results for matching spans are returned on a first-match basis. These results may not be the latest traces stored by Tempo.
Use Traces Drilldown to investigate tracing data
Grafana Traces Drilldown helps you visualize insights from your Tempo traces data. Using the app, you can:
- Use Rate, Errors, and Duration (RED) metrics derived from traces to investigate issues
- Uncover related issues and monitor changes over time
- Browse automatic visualizations of your data based on its characteristics
- Do all of this without writing TraceQL queries
Expand your observability journey and learn about the Drilldown apps suite.
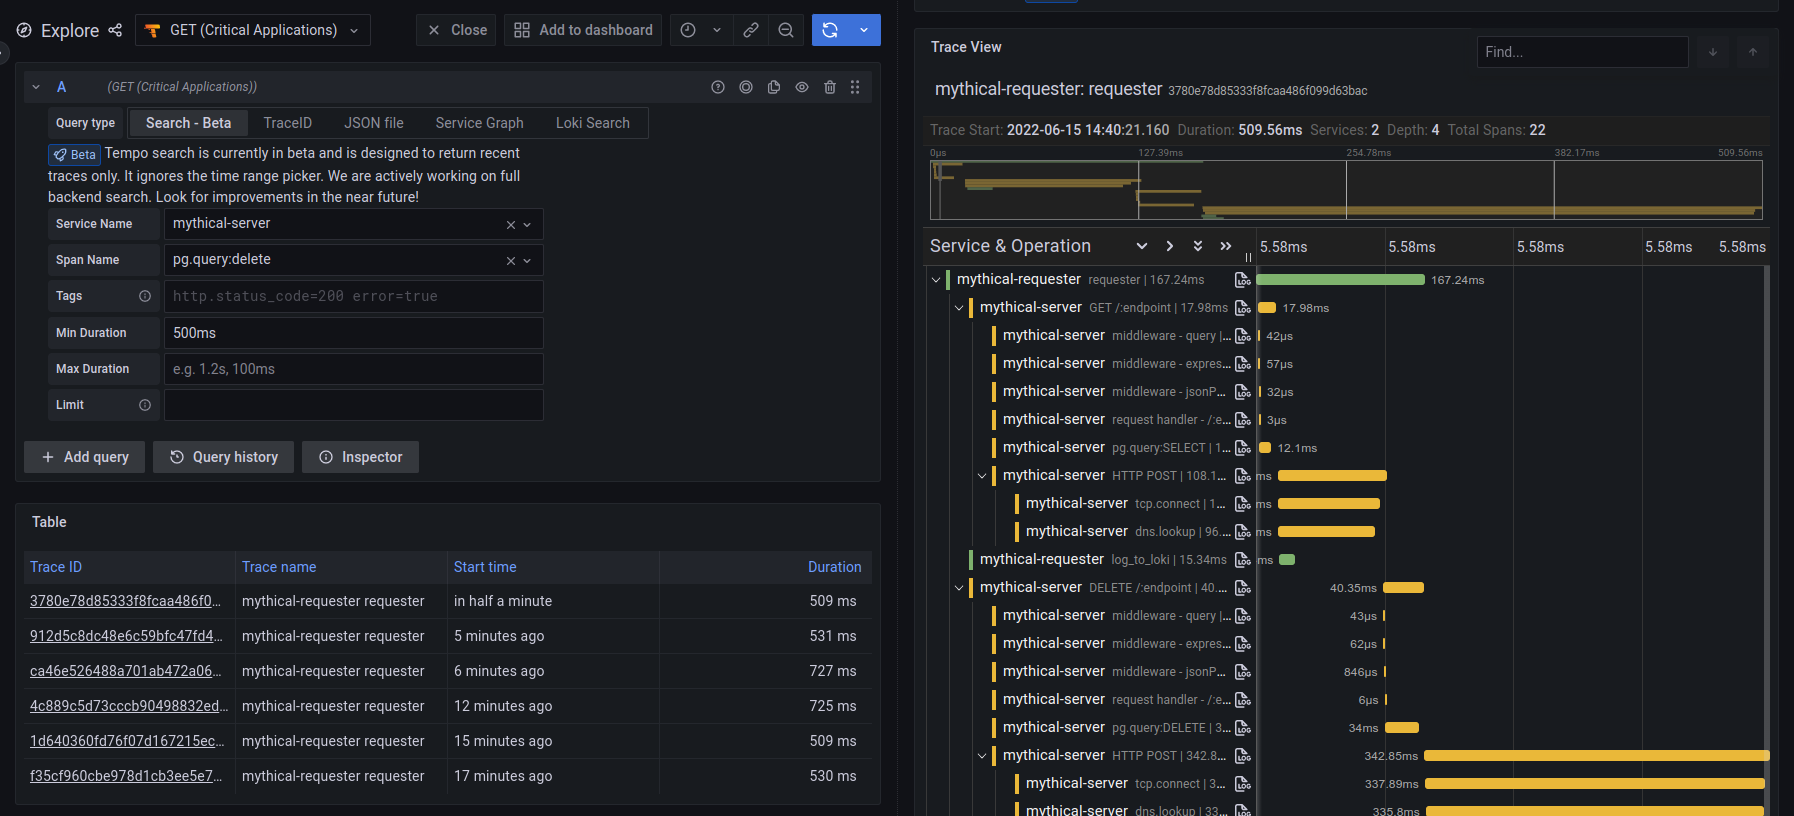
Search for traces
Search for traces using common dimensions such as time range, duration, span tags, service names, etc. Use the Explore trace view to quickly diagnose errors and high latency events in your system.
Search is non-deterministic
Most search functions are deterministic. When given the same criteria, a deterministic algorithm returns consistent results. For example, let’s say that you query a search engine for the definition of “traces.” The results list the same top matches for each query for “traces” in that search engine.
However, Tempo search is non-deterministic. If you perform the same search twice, you’ll get different lists, assuming the possible number of results for your search is greater than the number of results you have your search set to return.
When performing a search, Tempo does a massively parallel search over the given time range, and takes the first N results.
Even identical searches differ due to things like machine load and network latency.
This approach values speed over predictability and is quite simple; enforcing that the search results are consistent would introduce additional complexity (and increase the time the user spends waiting for results).
TraceQL follows the same behavior.
By adding most_recent=true to your TraceQL queries, the search results become deterministic.
For more information, refer to
Retrieve most recent results.
Use trace search results as panels in dashboards
You can embed tracing panels and visualizations in dashboards. You can also save queries as panels. For more information, refer to the Traces Visualization documentation.
For example dashboards, visit play.grafana.org.
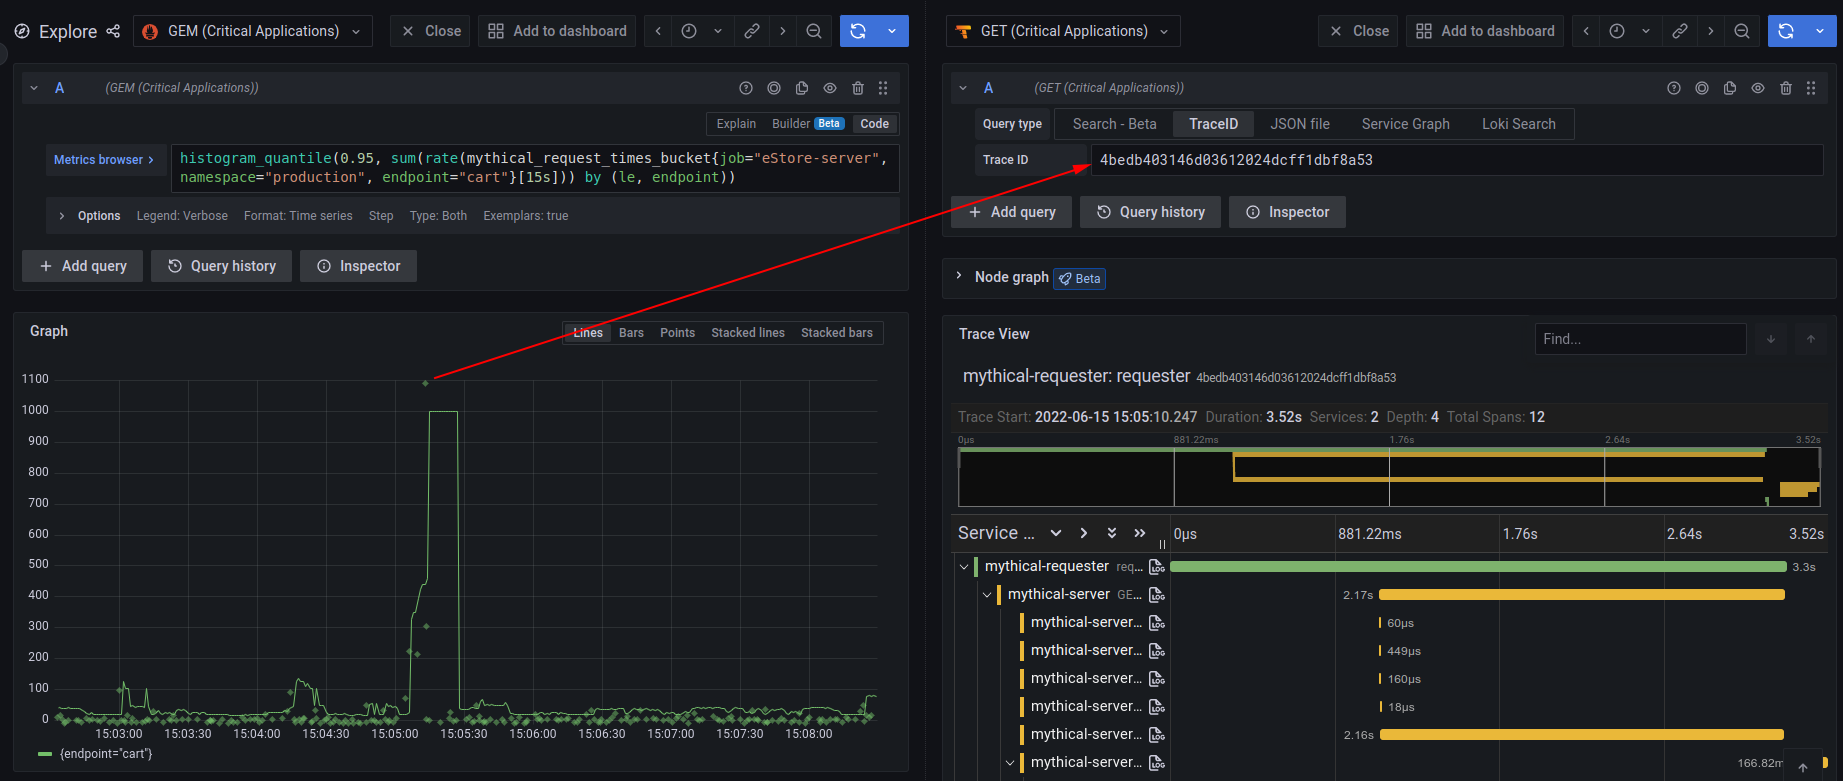
Use TraceQL to query data and generate metrics
Inspired by PromQL and LogQL, TraceQL is a query language designed for selecting traces.
Using Grafana Explore, you can search traces. The default traces search reviews the whole trace. TraceQL provides a method for formulating precise queries so you can zoom in to the data you need. Query results return faster because the queries limit what is searched.
You can construct queries using the TraceQL query editor or use the Search query type.
For details about constructing queries, refer to the TraceQL documentation.
TraceQL metrics queries
TraceQL language provides metrics queries.
Metric queries extend trace queries by applying an aggregate function to trace query results. For example: { span:name = "foo" } | rate() by (span:status)
This powerful feature creates metrics from traces, much in the same way that LogQL metric queries create metrics from logs.
Grafana Traces Drilldown is powered by metrics queries.
For more information about available queries, refer to TraceQL metrics queries.
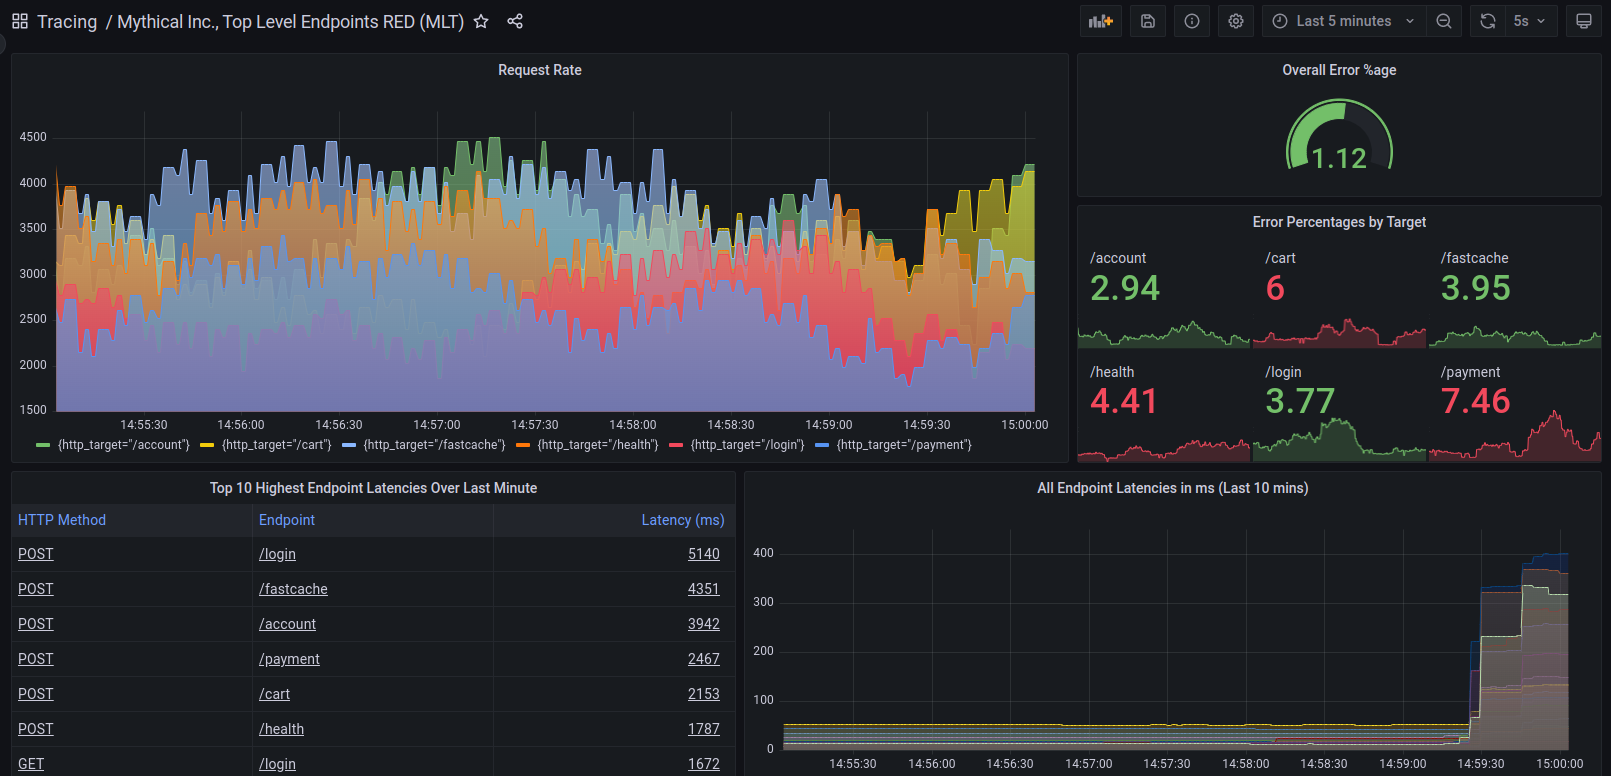
Generate metrics from spans
RED metrics can drive service graphs and other ready-to-go visualizations of your span data. RED metrics represent:
- Rate, the number of requests per second
- Errors, the number of those requests that are failing
- Duration, the amount of time those requests take
For more information about RED method, refer to The RED Method: how to instrument your services.
To enable metrics-generator in Grafana Cloud, refer to Enable metrics-generator.
To enable metrics-generator for Tempo, refer to Configure metrics-generator.
These metrics exist in your Hosted Metrics instance and can also be easily used to generate powerful custom dashboards.
Metrics automatically generate exemplars as well which allows easy metrics to trace linking.
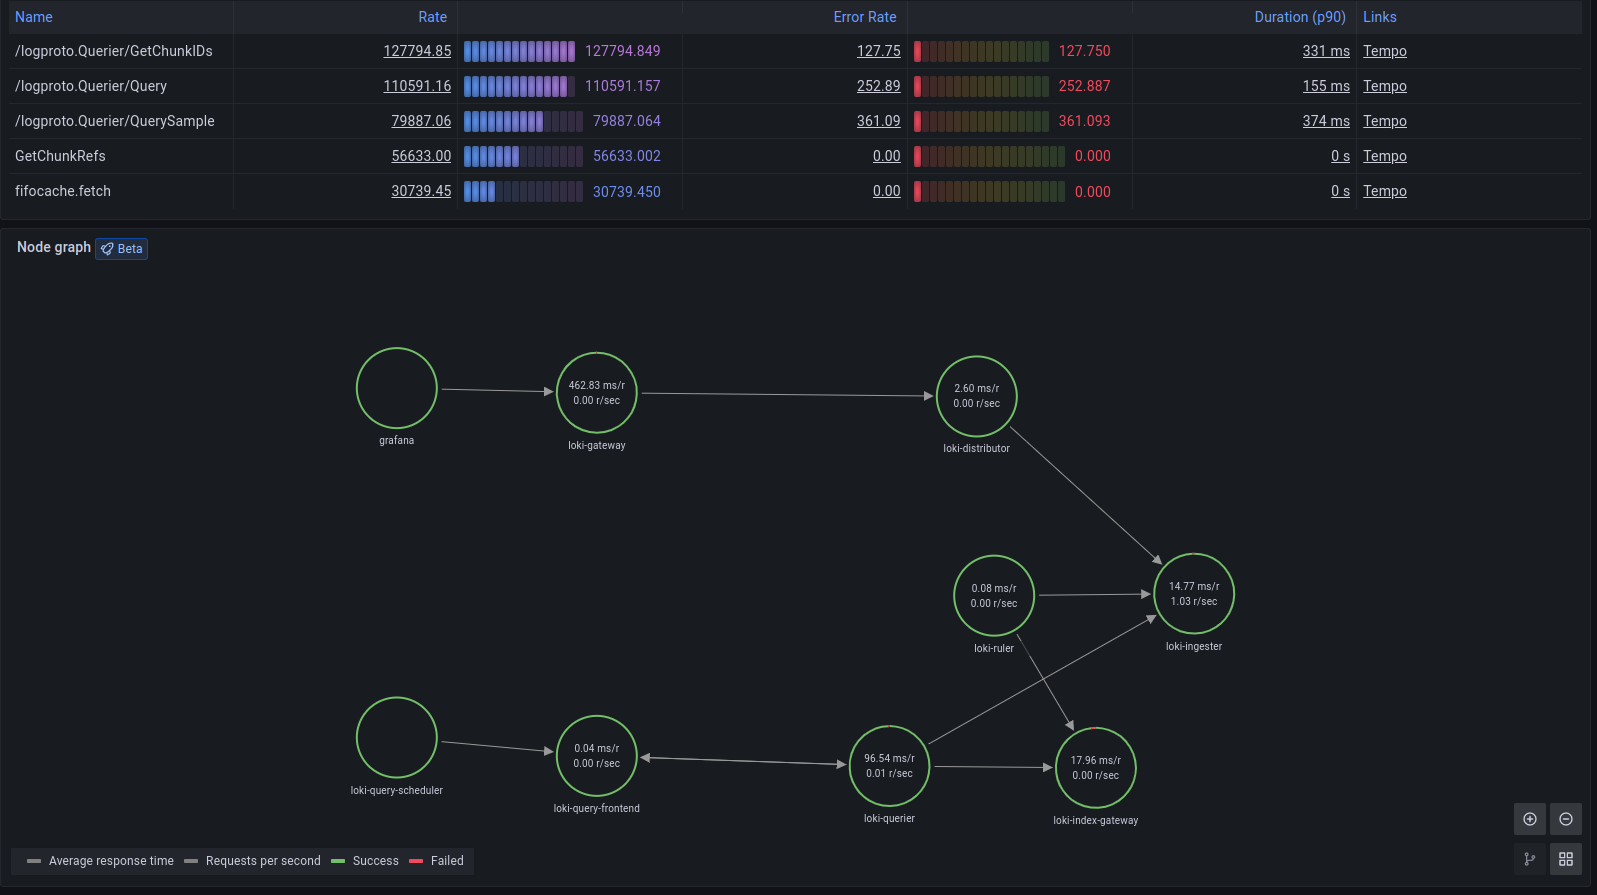
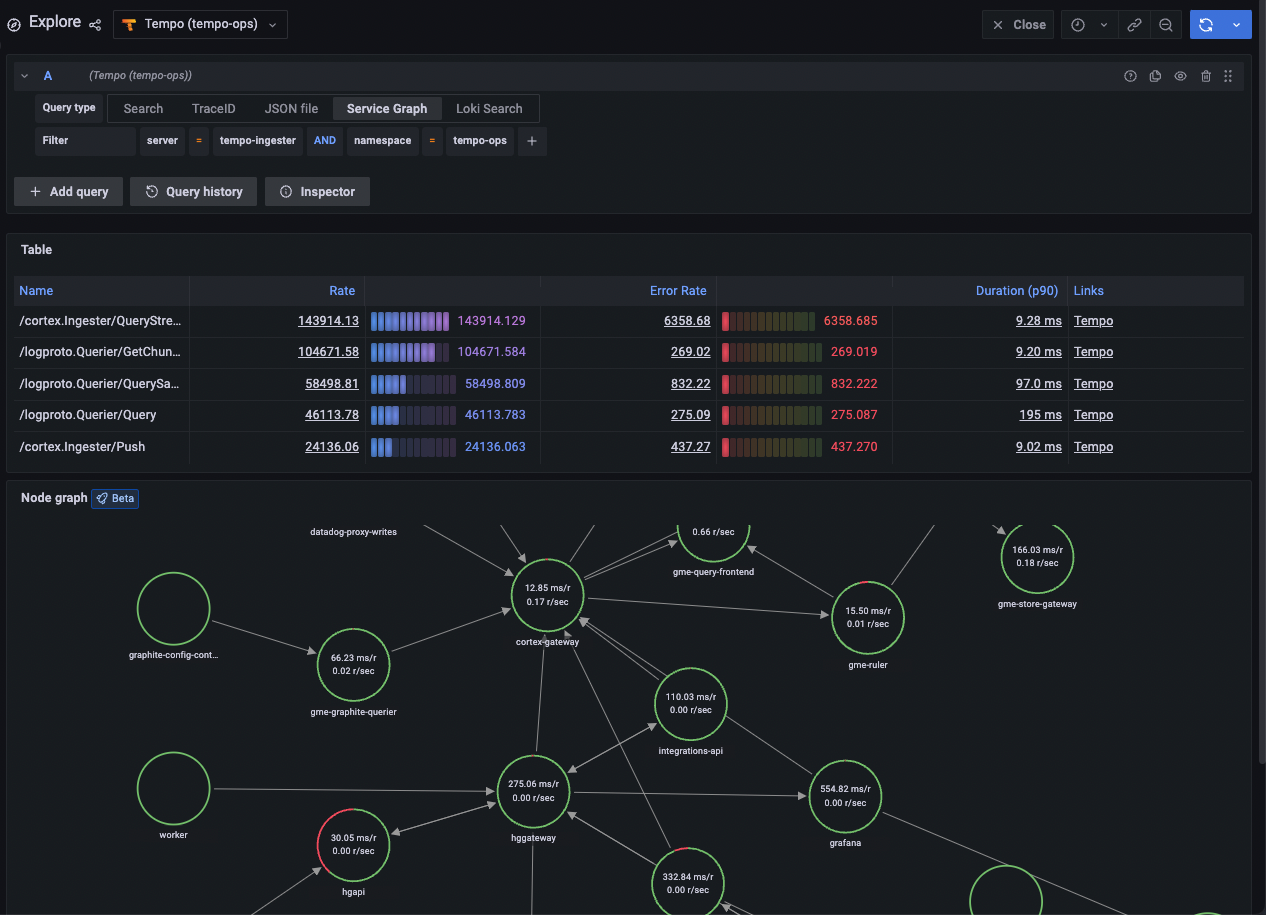
Service graph view
Service graph view displays a table of request rate, error rate, and duration metrics (RED) calculated from your incoming spans. It also includes a node graph view built from your spans.
To use the service graph view, you need to enable service graphs and span metrics. After it’s enabled, this pre-configured view is immediately available in Explore > Service Graphs.
Refer to the service graph view documentation for further information.
Integrate other telemetry signals
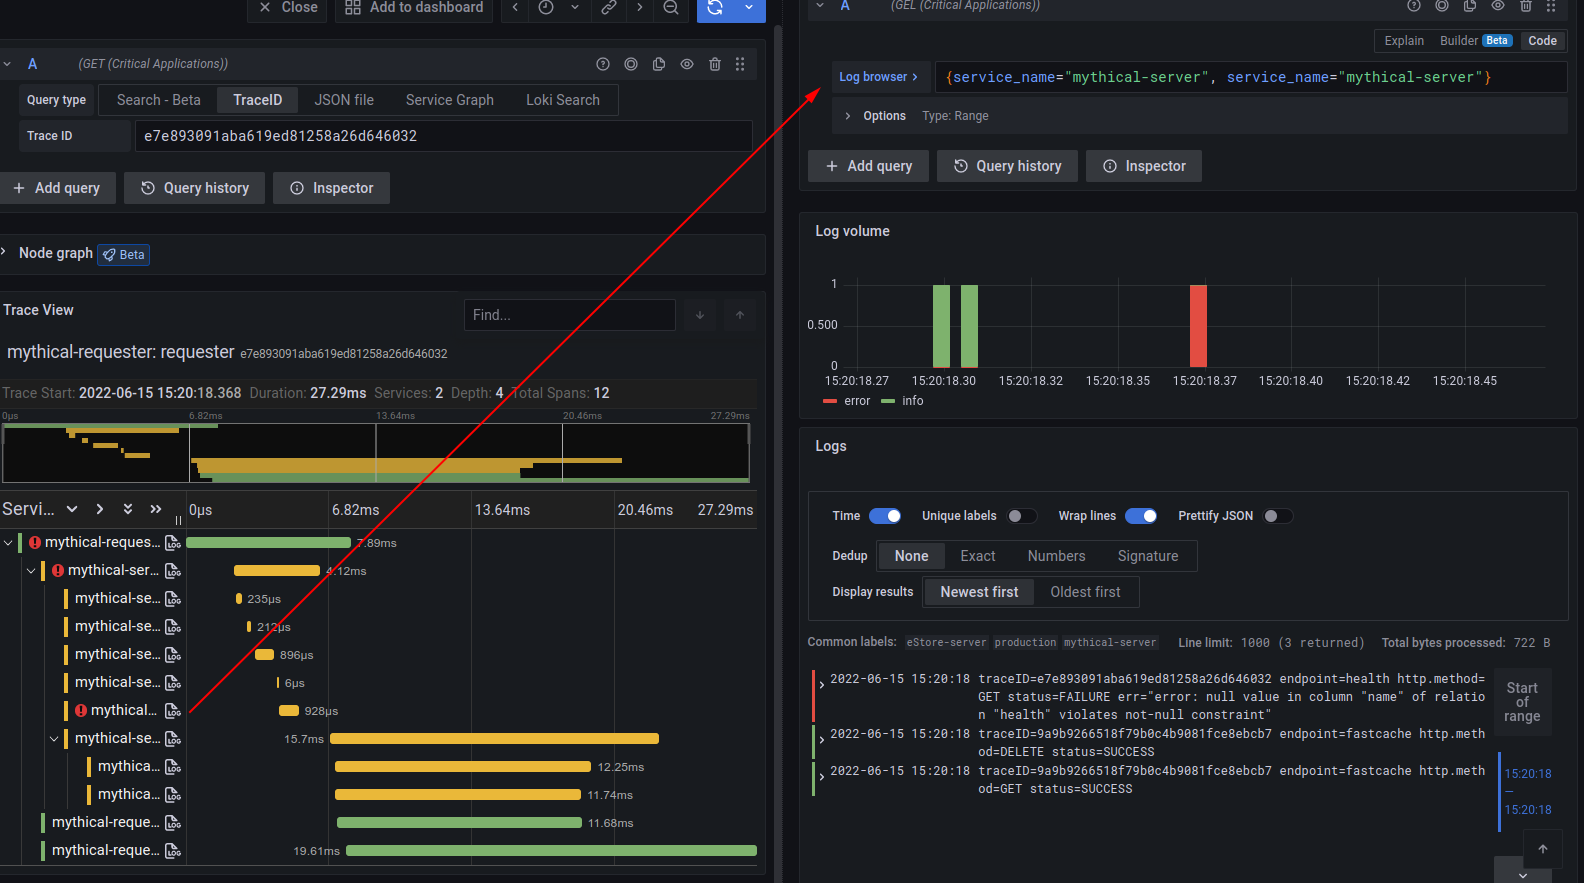
Link traces and logs
If you’re already doing request/response logging with trace IDs, they can be easily extracted from logs to jump directly to your traces.
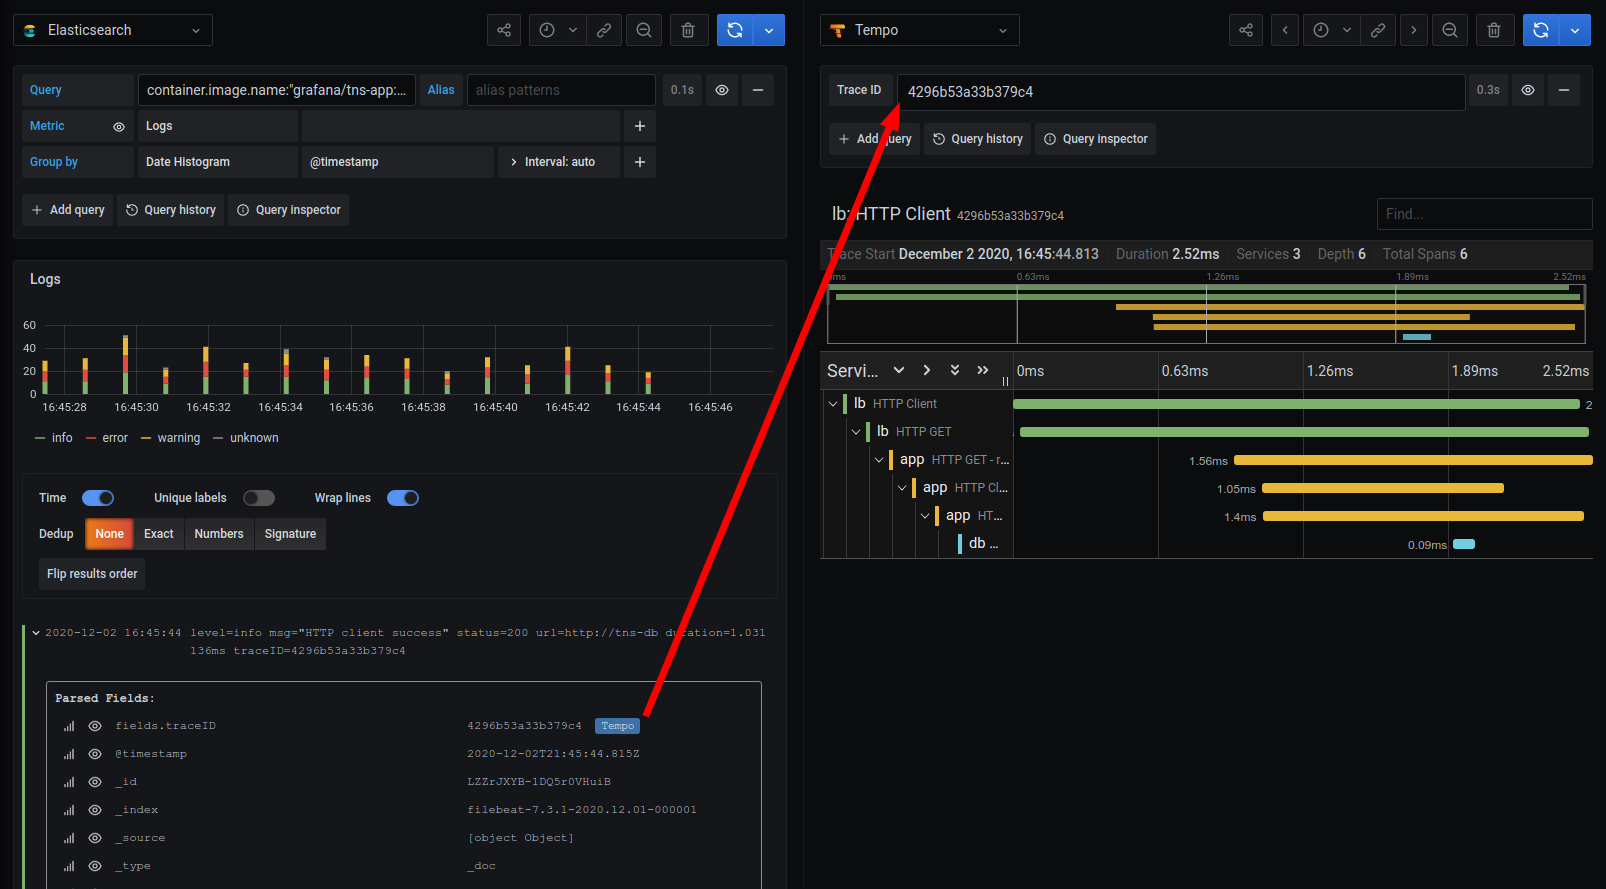
In the other direction, you can configure Grafana and Grafana Cloud to create a link from an individual span to your Loki logs. If you see a long-running span or a span with errors, you can immediately jump to the logs of the process causing the error.
Note
Cloud Traces only supports custom tags added by Grafana Support. Cloud Traces supports these default tags:
cluster,hostname,namespace, andpod. Contact Support to add a custom tag.
Link traces and metrics
Grafana can correlate different signals by adding the functionality to link between traces and metrics. Trace to metrics lets you navigate from a trace span to a selected data source. Using trace to metrics, you can quickly see trends or aggregated data related to each span.
For example, you can use span attributes to metric labels by using the $__tags keyword to convert span attributes to metrics labels.
To set up Trace to metrics for your data source, refer to Trace to metric configuration.
Link traces and profiles
Using Trace to profiles, you can correlate different signals by adding the functionality to link between traces and profiles.
Trace to profiles lets you link your Grafana Pyroscope data source to tracing data in Grafana or Grafana Cloud. When configured, this connection lets you run queries from a trace span into the profile data.
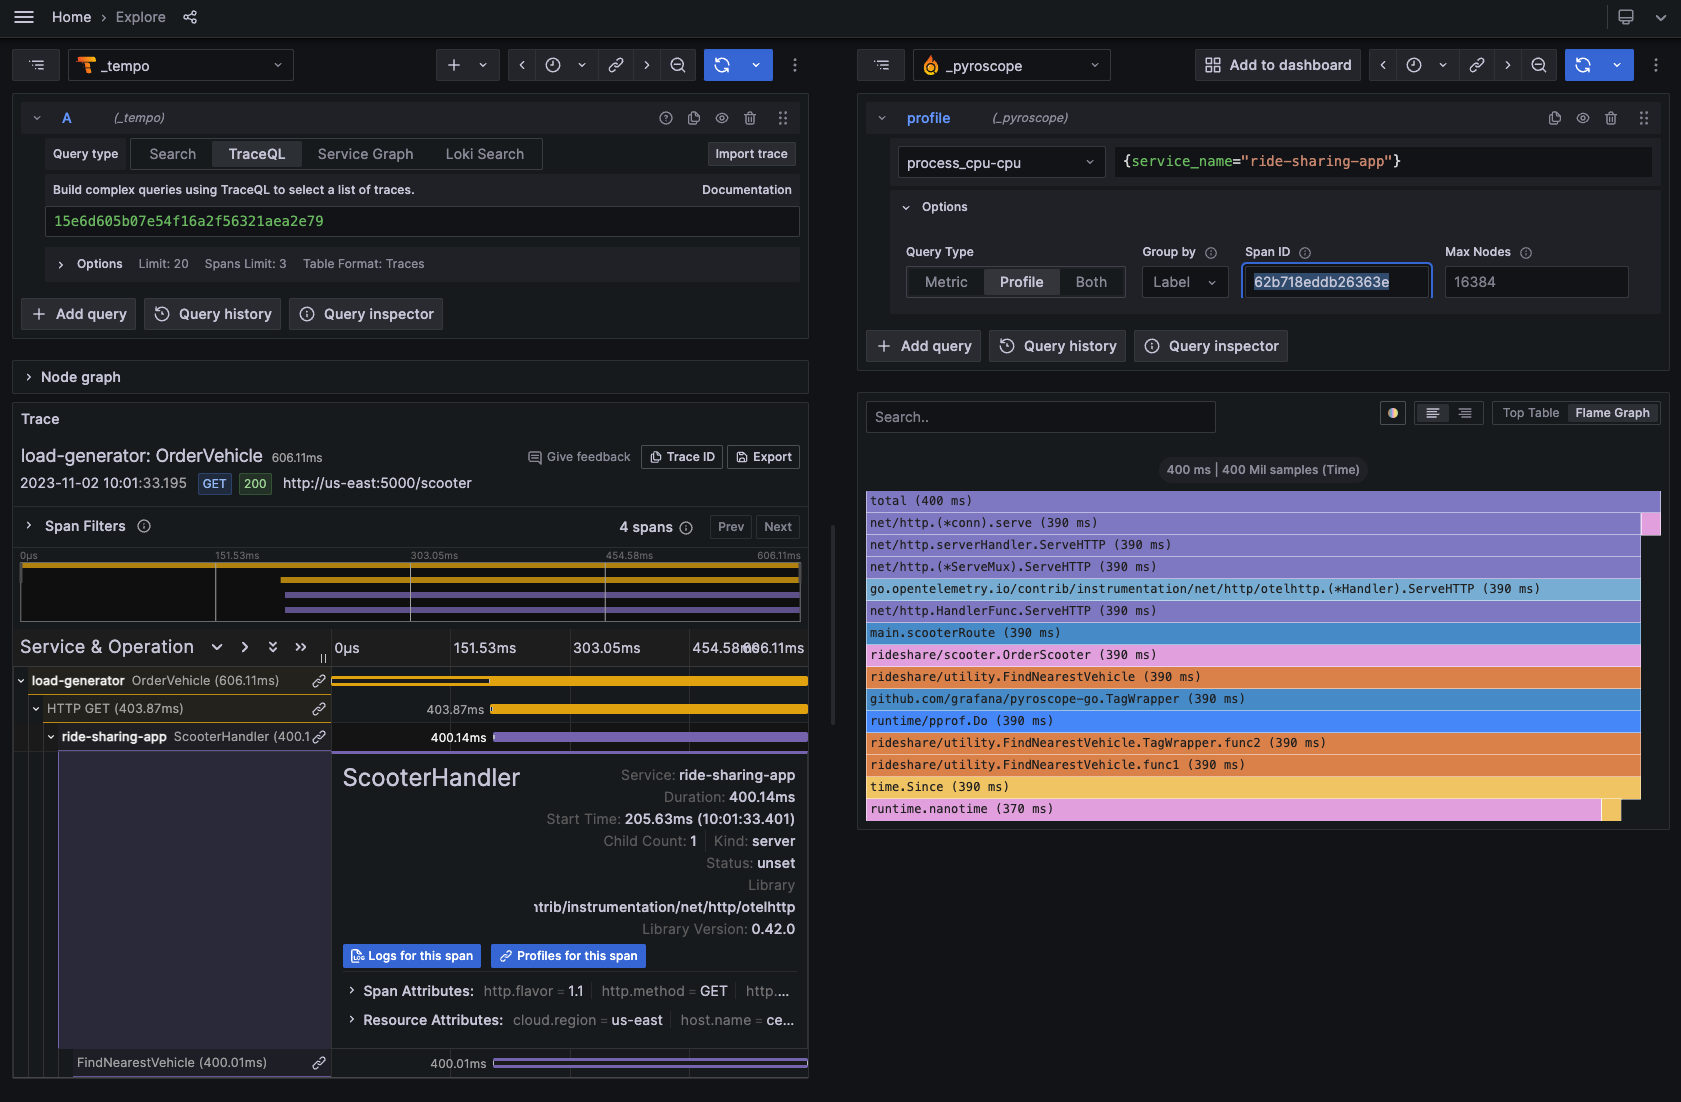
For more information, refer to the Traces to profiles documentation and the Grafana Pyroscope data source documentation.
For Cloud Traces, Refer to the Traces to profiles documentation for configuration instructions.


