Query data across multiple stacks
Note
Creating data sources that automatically queries across multiple stacks is available in public preview for metrics, logs, and traces data sources in Grafana Cloud. Report any unexpected behavior to the Grafana Support team.
Grafana Cloud supports the creation of access policies that span multiple stacks, enabling simultaneous data querying across different stacks. This document walks you through the creation of an access policy and data sources needed to perform these multi-stack queries.
There’s supposed to be a video here, but for some reason there isn’t. Either we entered the id wrong (oops!), or Vimeo is down. If it’s the latter, we’d expect they’ll be back up and running soon. In the meantime, check out our blog!
Set up a multi-stack access policy and a generate a token
For demonstration purposes, consider two stacks named teamengineering and teamfinance located in the same region. Follow the steps below to create an access policy that enables reading metrics and logs from these stacks:
- Under the Access Policies section in the Cloud Portal, create an access policy called
leadership. - Choose
teamengineeringandteamfinanceas realms. Alternatively, you can opt for the “All stacks” realm to create a policy that has access to all stacks. - Select the
metrics:read,logs:read, andtraces:readscopes. - After creating the policy, generate a new token and keep it handy for a later step.
Set up a multi-stack Prometheus data source in Grafana
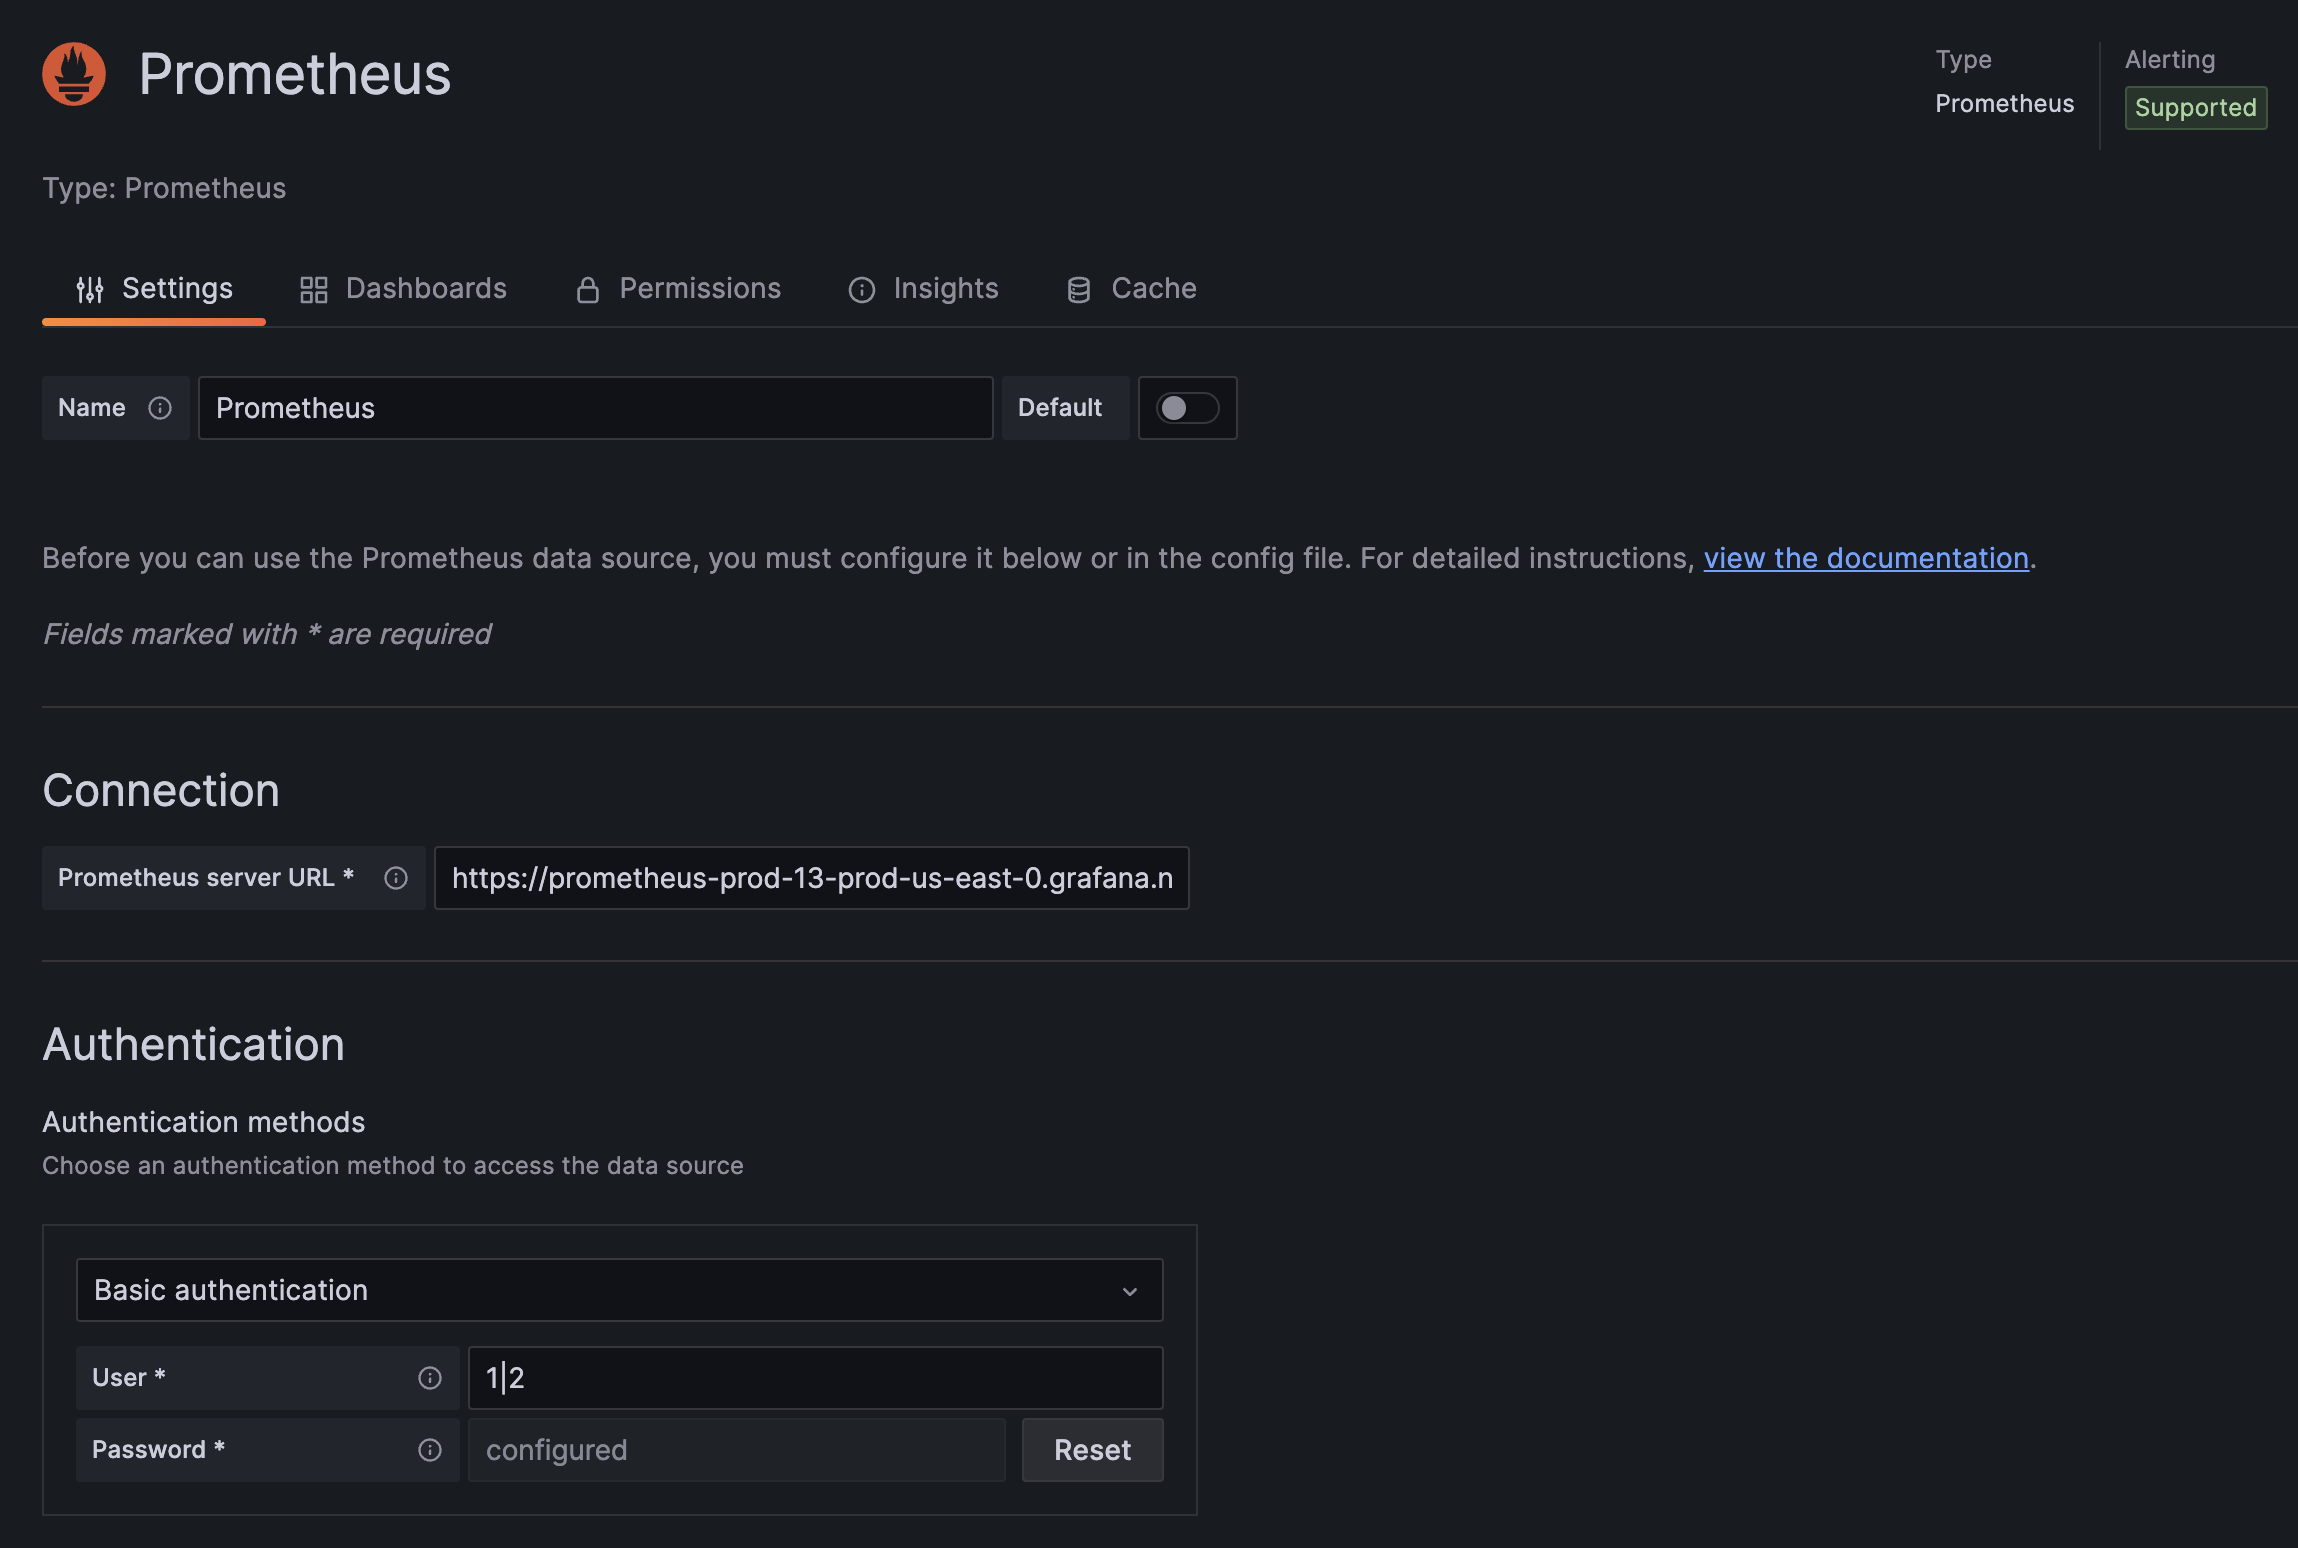
- In the Cloud Portal, navigate to the Prometheus details of both
teamengineeringandteamfinancestacks and make note of their instance URLs and IDs. - In Grafana, create a new Prometheus data source.
- Enter the URL noted down in step 1 (for example
https://prometheus-prod-13-prod-us-east-0.grafana.net/api/prom). - Select Basic Authentication as the authentication method.
- In the User field, enter the IDs obtained in step 1, separated by the
|character (for example,1|2). - Paste the previously generated token into the Password field.

Set up a multi-stack Loki data source in Grafana
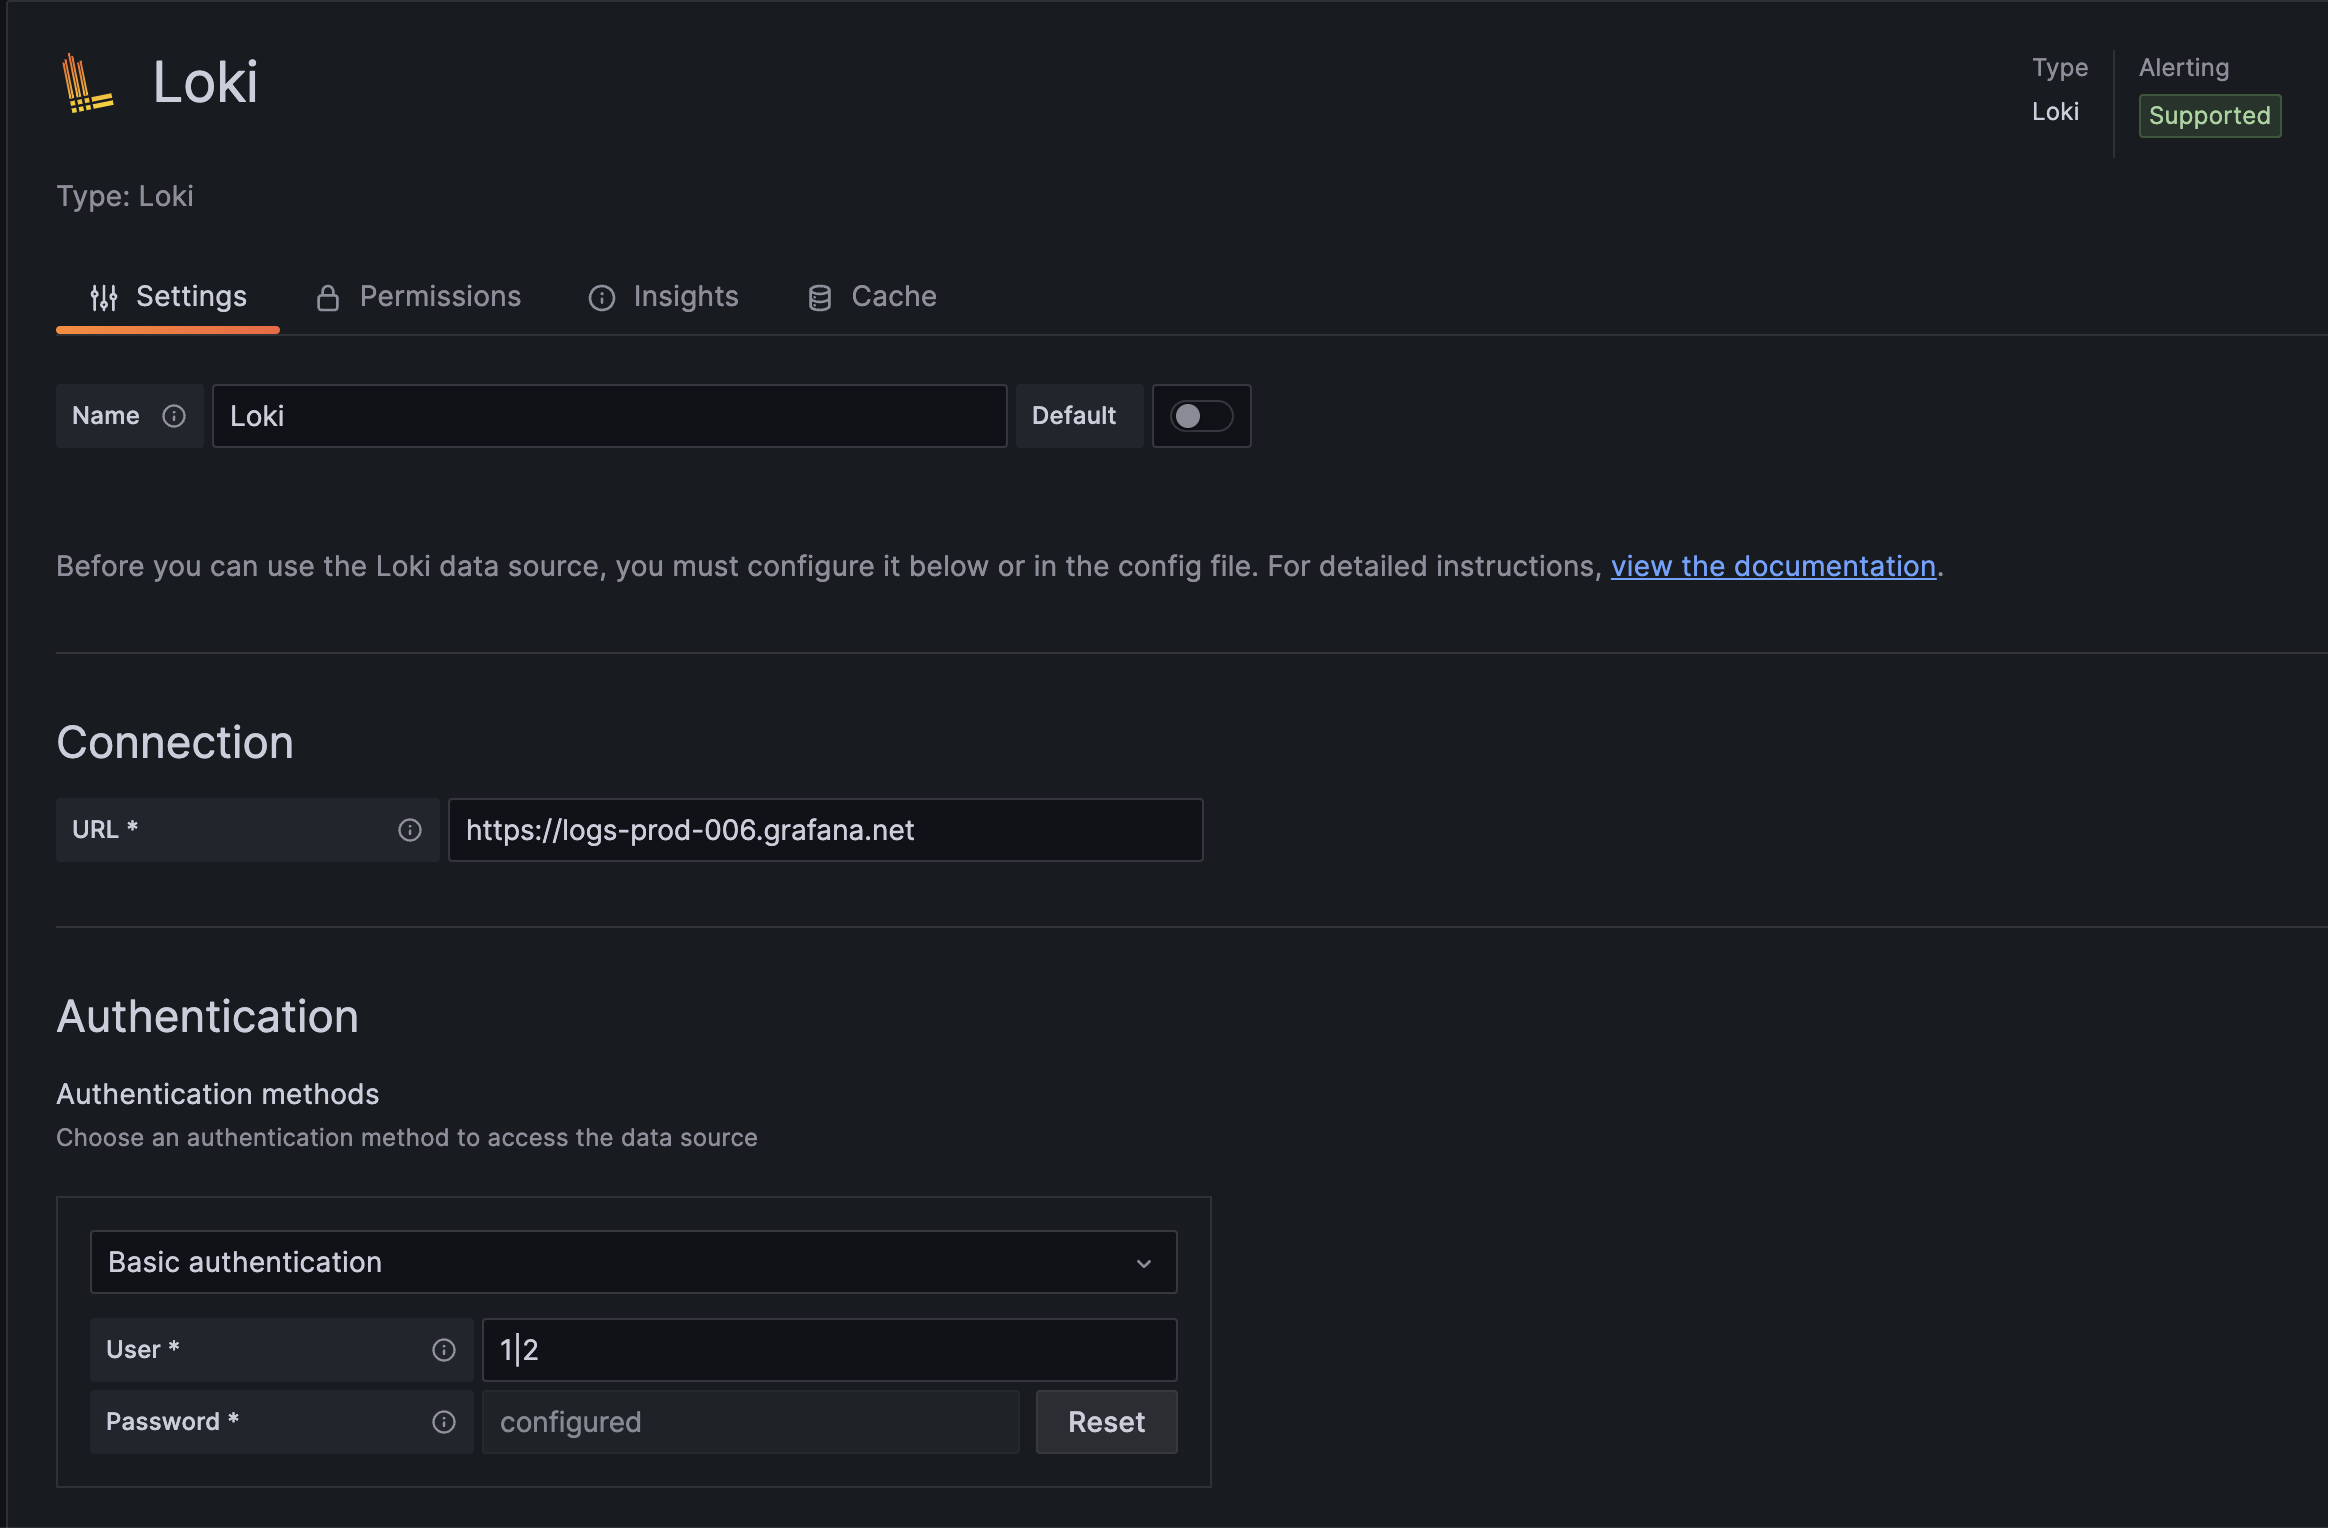
- In the Cloud Portal, navigate to the Loki details of both
teamengineeringandteamfinancestacks and make note of their instance URLs and IDs. - In Grafana, create a new Loki data source.
- Enter the URL noted down in step 1 (for example,
https://logs-prod-006.grafana.net). - Select Basic Authentication as the authentication method.
- In the User field, enter the IDs obtained in step 1, separated by the
|character (for example,1|2). - Paste the previously generated token into the Password field.

Set up a multi-stack Tempo data source in Grafana
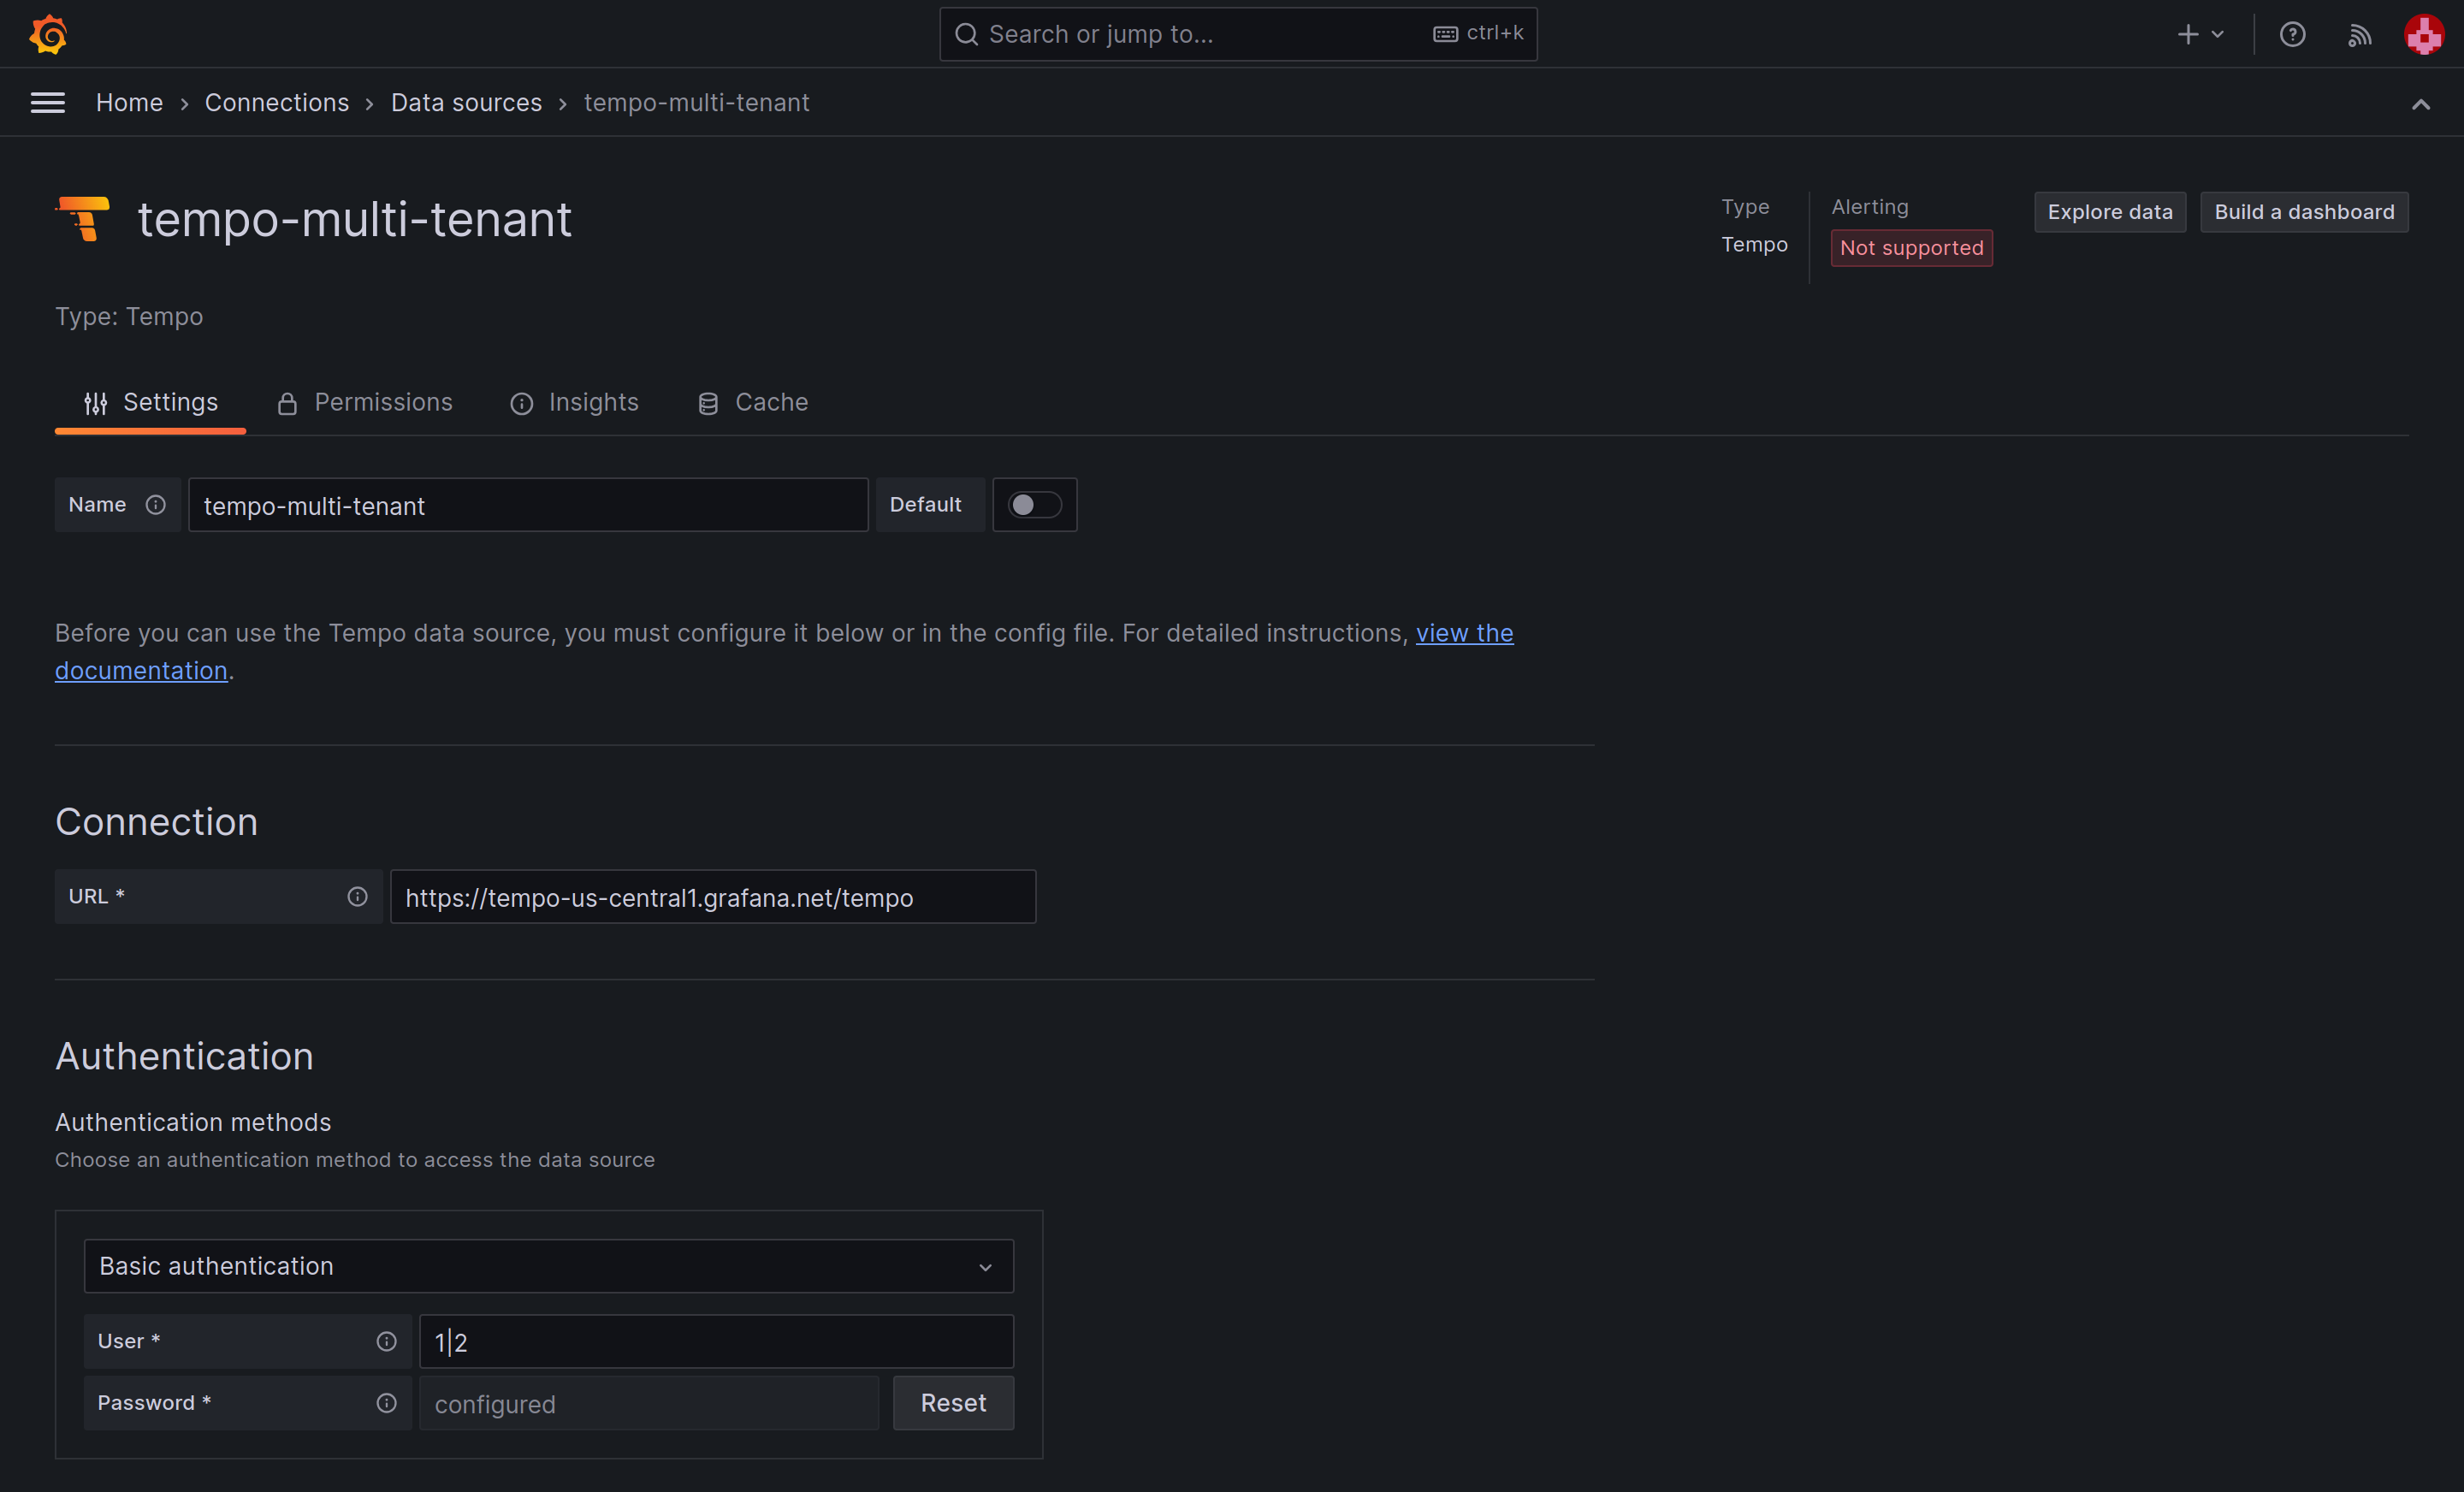
- In the Cloud Portal, navigate to the Tempo details of both
teamengineeringandteamfinancestacks and make note of their instance URLs and IDs. - In Grafana, create a new Tempo data source.
- Enter the URL noted down in step 1 (for example,
https://tempo-us-central1.grafana.net/tempo). - Select Basic Authentication as the authentication method.
- In the User field, enter the IDs obtained in step 1, separated by the
|character (for example,1|2). - Paste the previously generated token into the Password field.

Query your multi-stack data source
You can query your multi-stack data source as you would any other Prometheus or Loki data source via the Explore page or by creating a dashboard. The queries you make to your multi-stack data source encompass all specified stacks in the User field, processing data as if it were in a unified stack.
Query responses from your multi-stack data source includes a __tenant_id__ label, indicating the originating stack’s Prometheus, Tempo, or Loki instance.
Query data from all stacks authorized by an access policy
Note
Cross-stack data sources are limited to stacks that are located within the same cluster.
For querying across all stacks within a region, begin by selecting the All stacks realm when creating the access policy, Next, use the * wildcard in the User field when setting up the data source. The data source you
create queries all stacks in the cluster specified in your URL.
Conversely, you can use a wildcard * in the User field of your data source in combination with an access policy with access restricted to specific stacks. In this case, the multi-stack data source has access to all stacks in that access policy’s realm.
Limitations
- During public preview, cross-stack querying is constrained to a maximum of 10 stacks. If you need to query over greater number of stacks, contact the Grafana Support team for assistance.
Was this page helpful?
Related resources from Grafana Labs


