Menu
Grafana Cloud

View and analyze profiling data

There are three main views to visualize and analyze profiling data in Grafana:

  • Explore view
  • Dashboards view
  • Application plugin view

In addition, you can use Flame graph AI to assist with interpreting flame graphs.

Explore view

The Explore view lets you create targeted queries to your profiling data or view your profiling data alongside matching logs, metrics, traces, K6 test results, or any other data that can be queried in Explore.
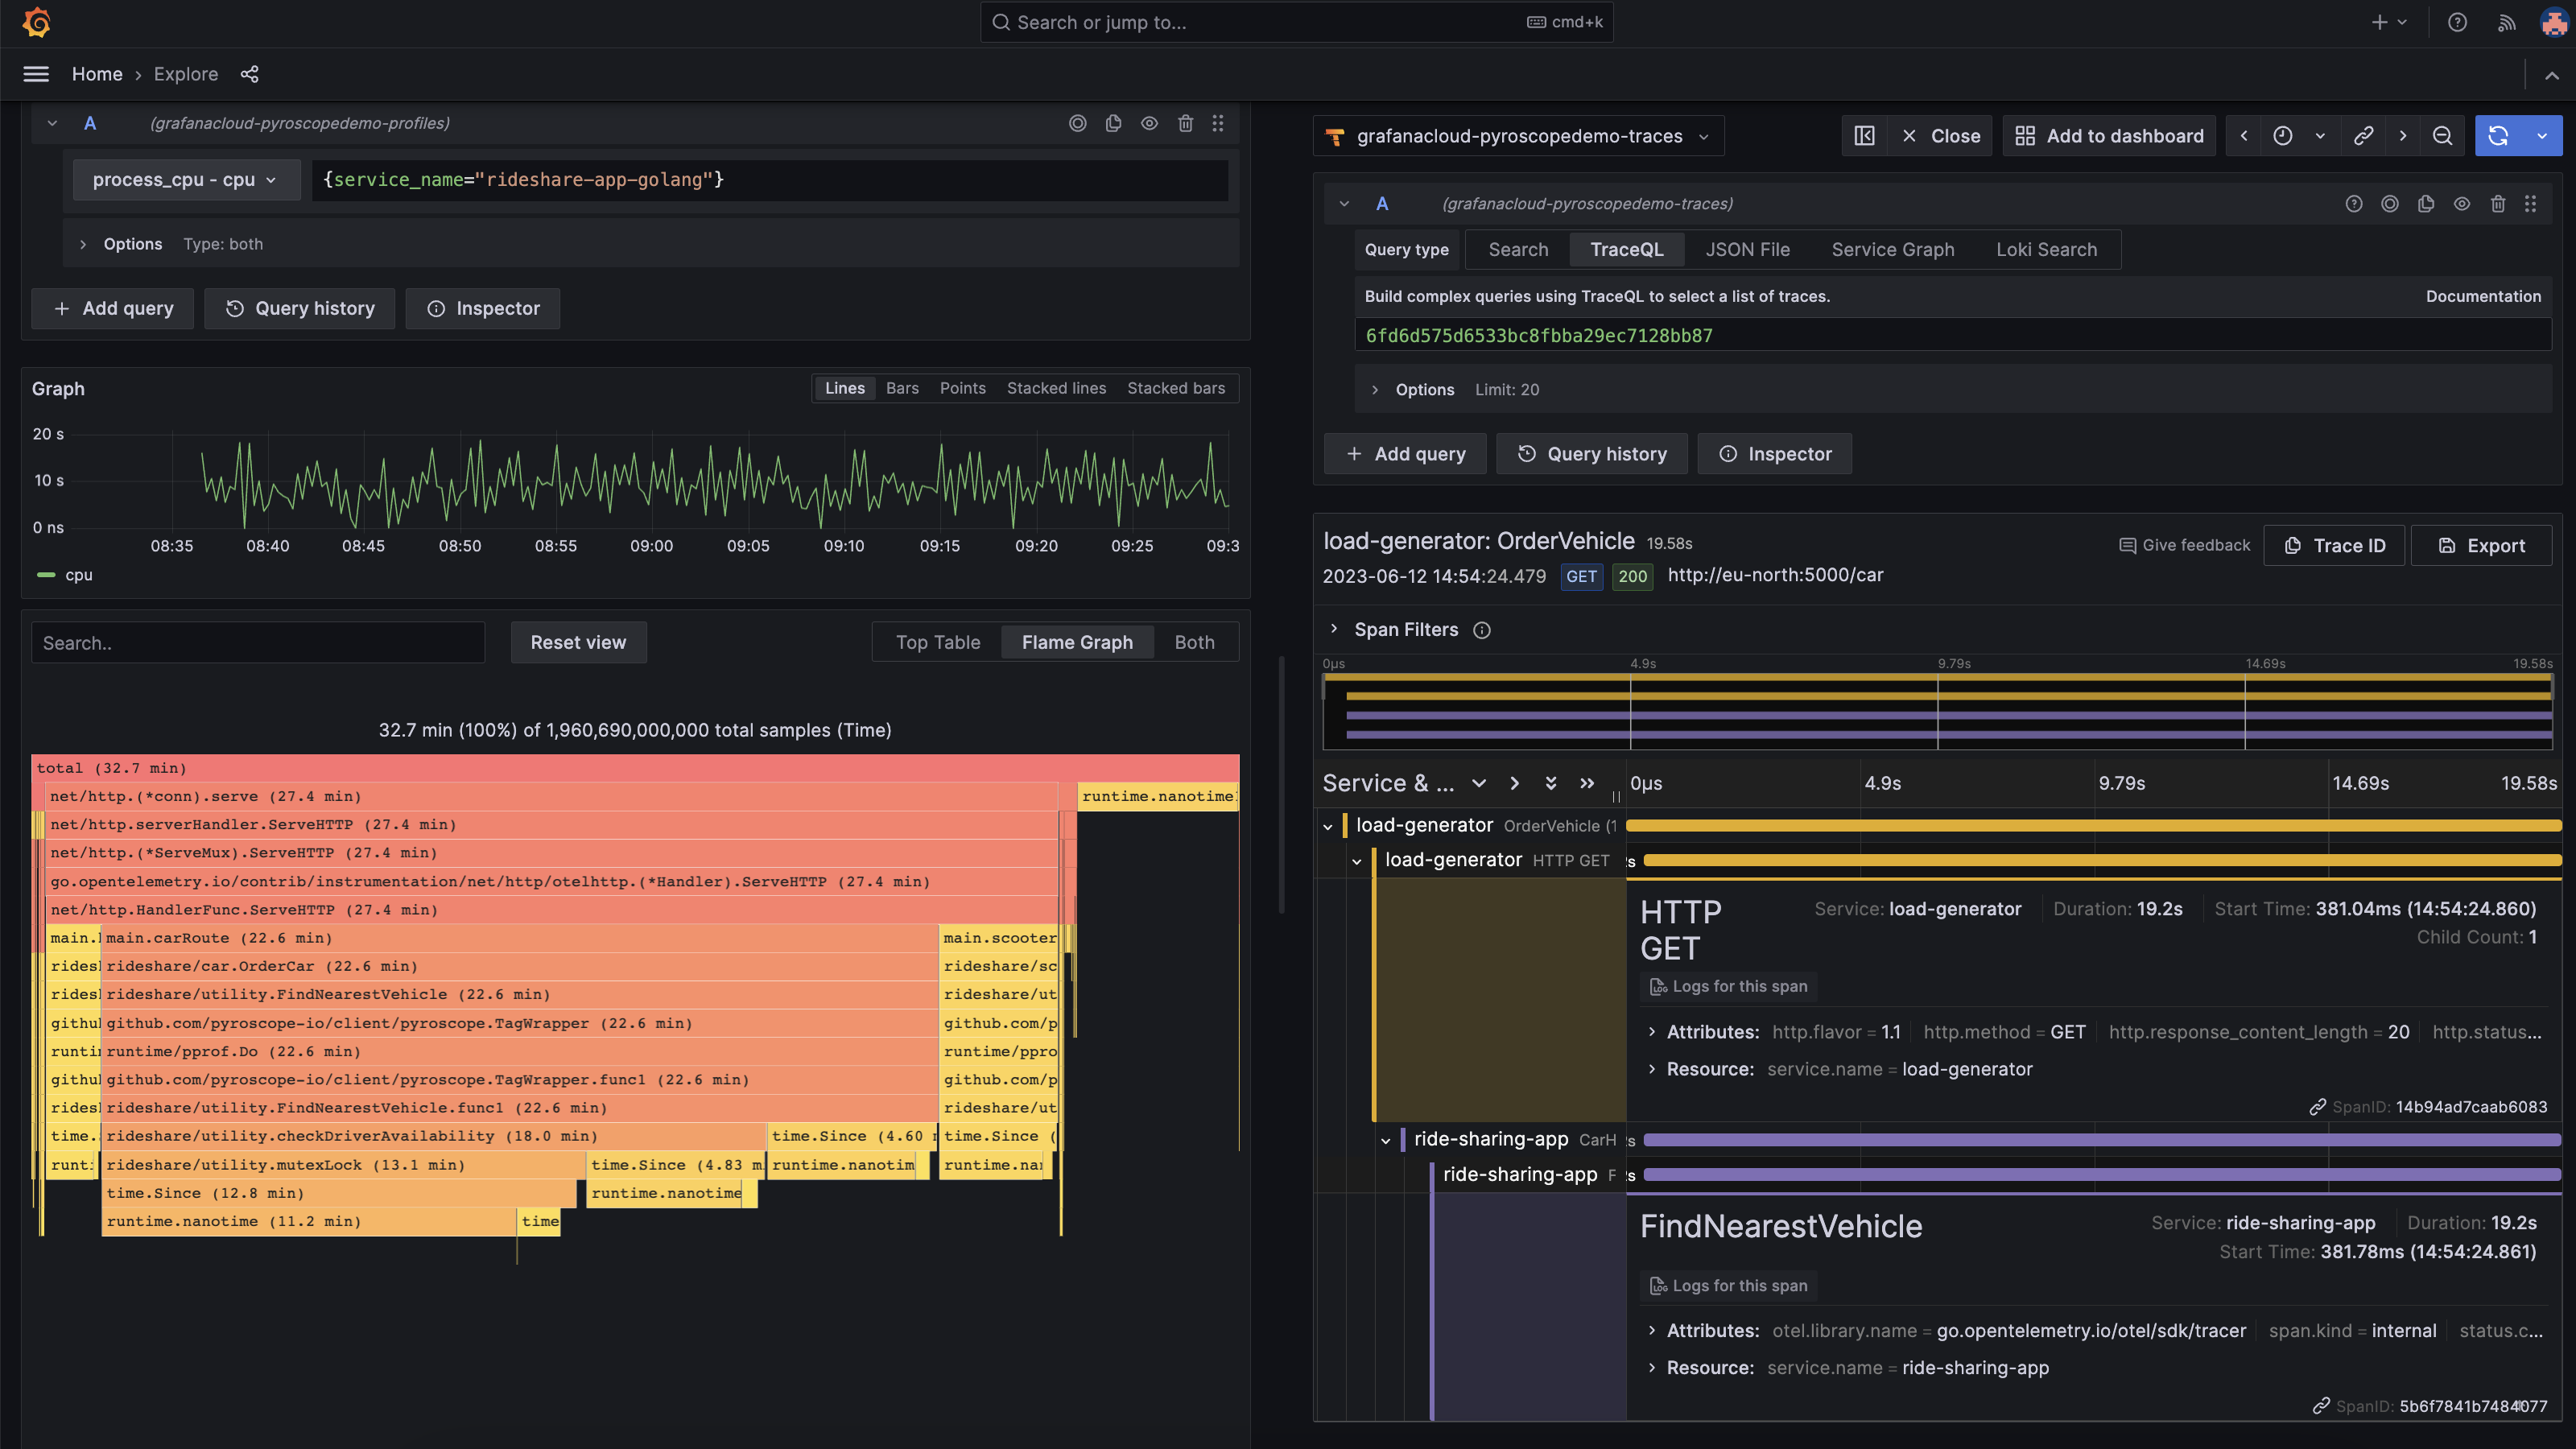
Explore view

To access this view, click Explore > Profiles in the sidebar menu.

Dashboard view

The Dashboards view gives you a real-time understanding of what your application is doing and is customizable to help you gain a comprehensive understanding of your application’s performance and identify areas for optimization.

Dashboards view

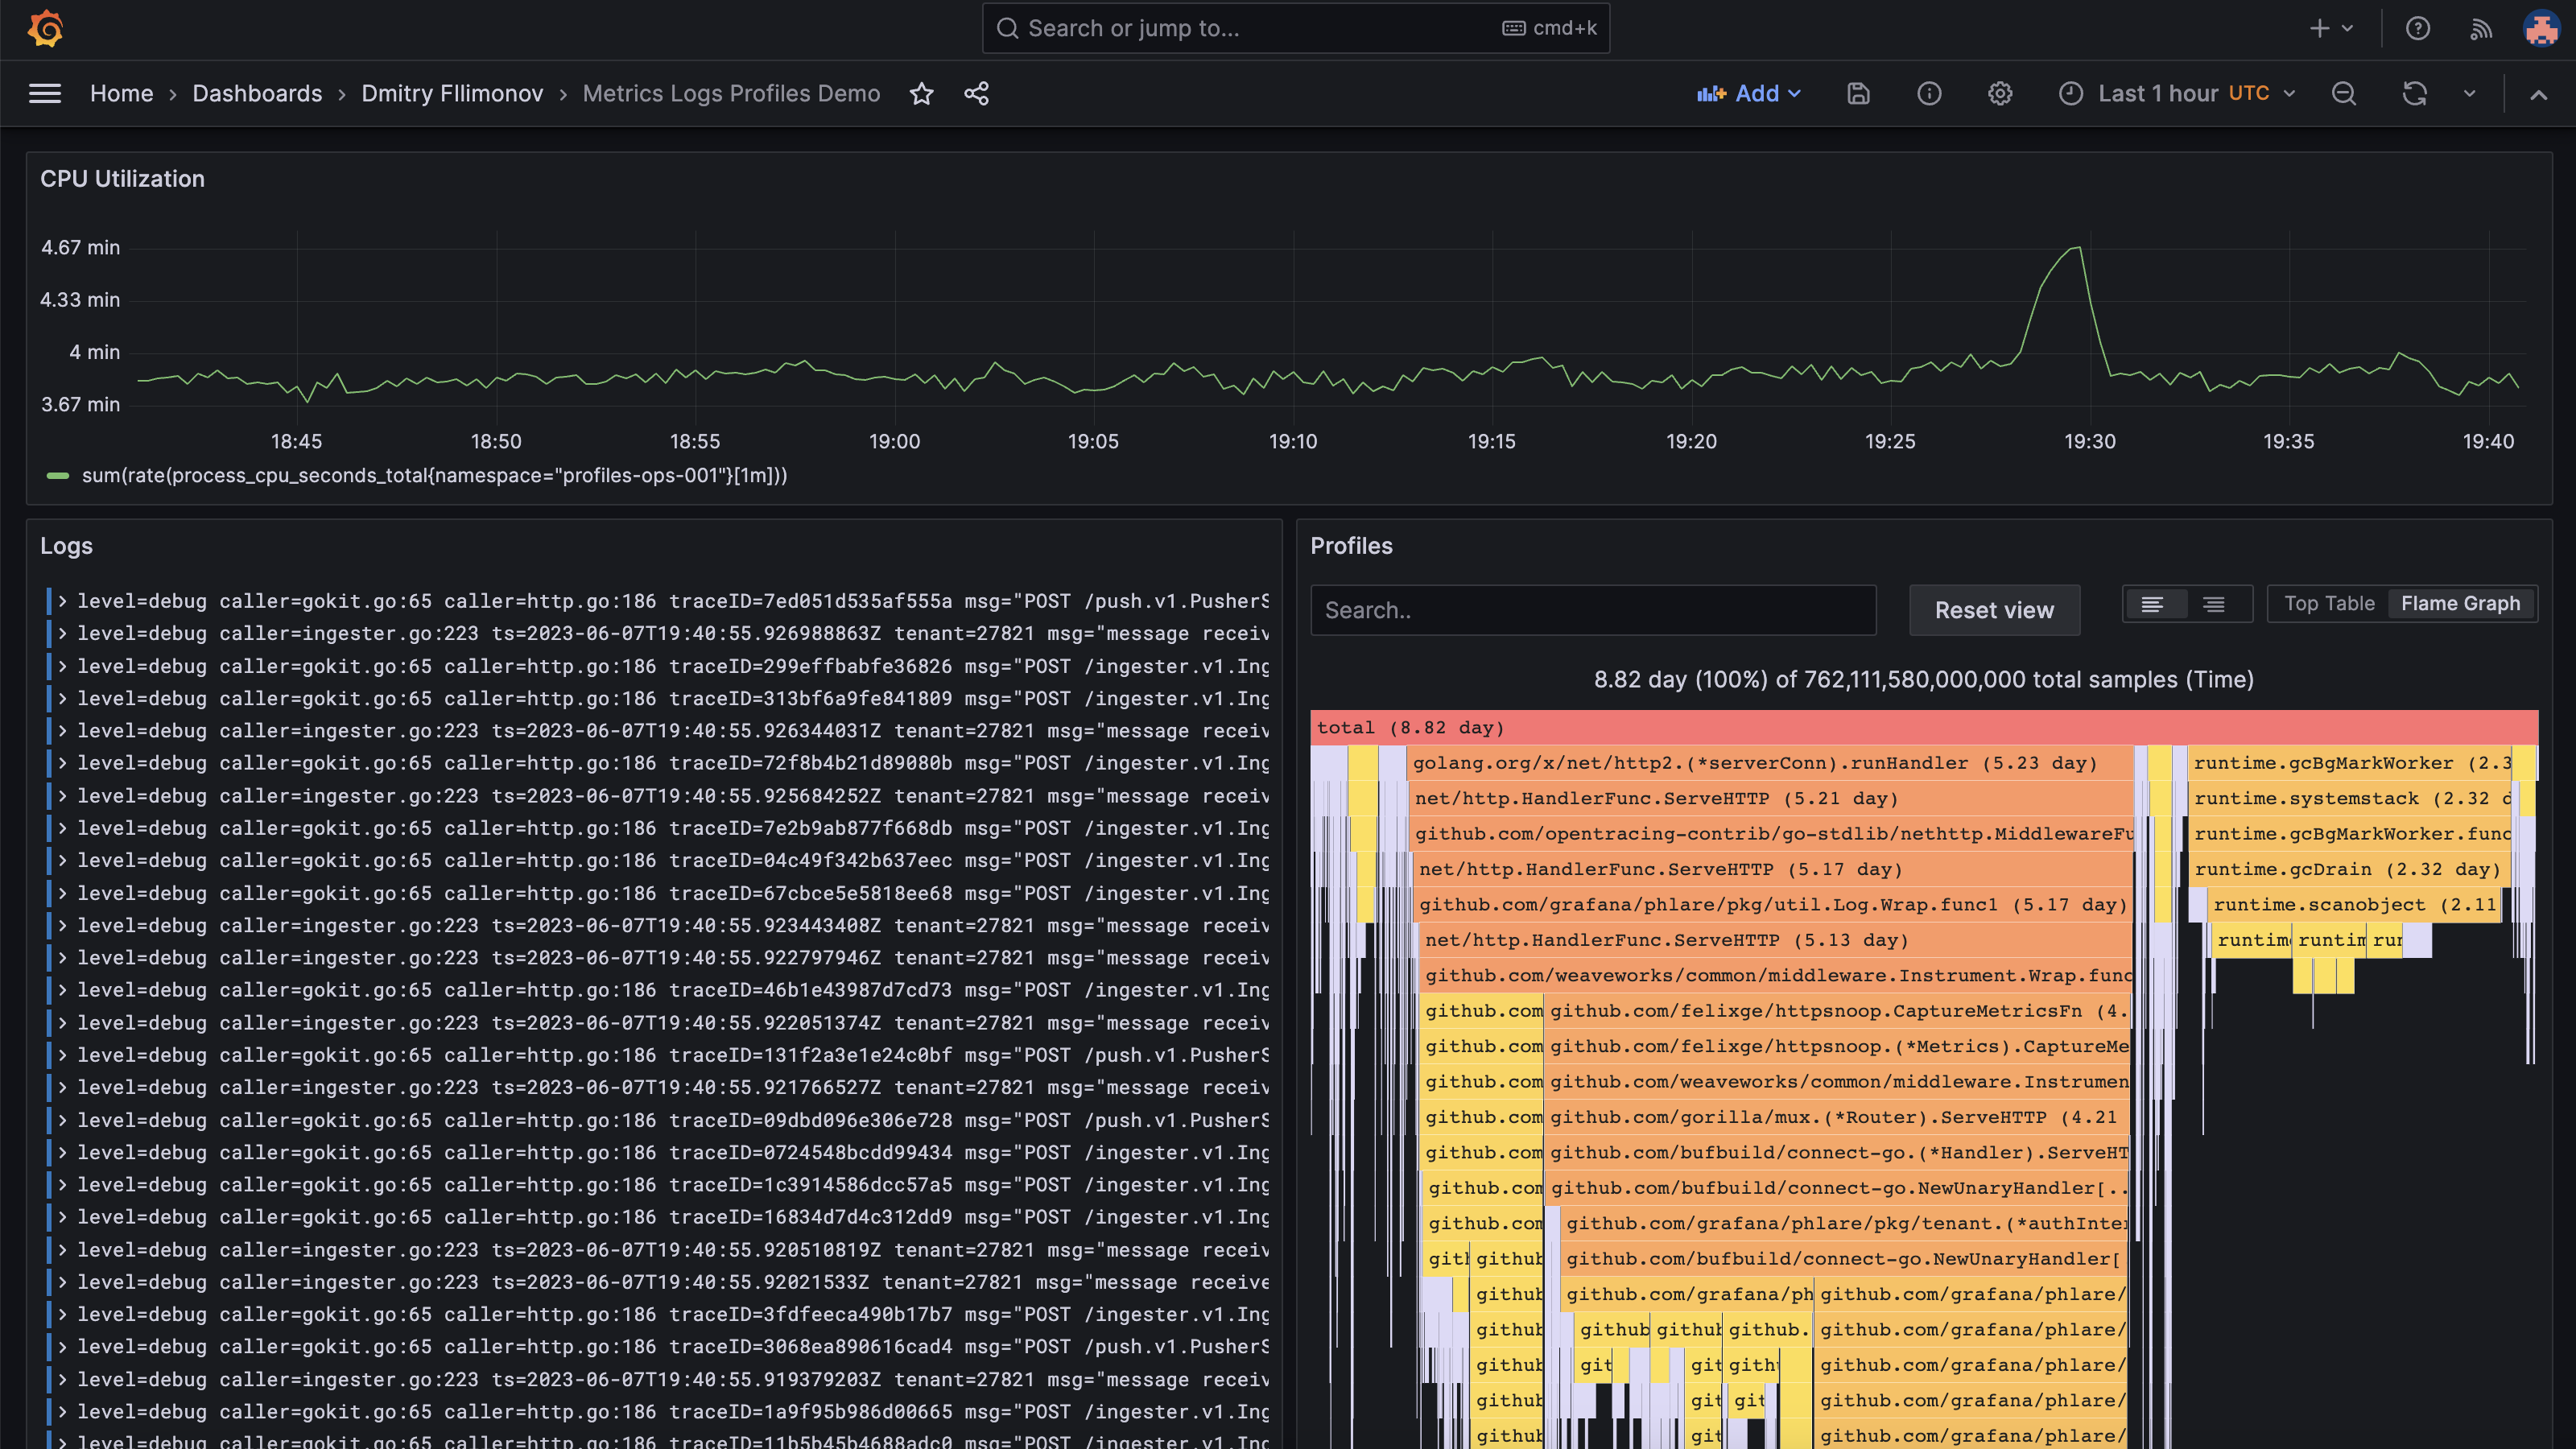
To access this view, click Dashboards in the sidebar menu.

Application plugin view

The application plugin view offers profiling-specific functionality to enhance your analysis capabilities. This view presents a structured workflow, starting with a high-level overview of your application and its various labels.

From there, you can delve deeper, comparing profiles across different dimensions to uncover valuable insights. The app plugin view streamlines the profiling analysis process, making it easier to identify performance patterns, bottlenecks, and opportunities for optimization.

App plugin view

To access this view, navigate to Observability > Profiles in the sidebar menu.

Interpret profile data using Flame graph AI

Flame graphs provide a visual summary of your profile data. A flame graph is a complete visualization of hierarchical data, for example stack trace and, file system contents, with a metric, typically resource usage, attached to the data.

Brendan Gregg, the creator of flame graphs, was inspired by the inability to view, read, and understand stack traces using the regular profilers to debug performance issues.

The flame graph was created to fix exact problem. To learn more about flame graphs, refer to Flame graph panel visualization.

Interpreting a flame graph can be challenging, even for people familiar with flame graphs. Flame graph AI was created to assist with these challenges. By using large-language model (LLM) technology, flame graph can review the profile data presented in a flame graph and provide an interpretation that answers these questions:

  1. Performance bottlenecks: What’s causing the slowdown?
  2. Root causes: Why is it happening?
  3. Recommended fixes: How would you resolve it?

To learn more, refer to Flame graph AI.

Flame graph analysis with performance bottleneck, root cause, and recommended fix