Configure GCP Metrics
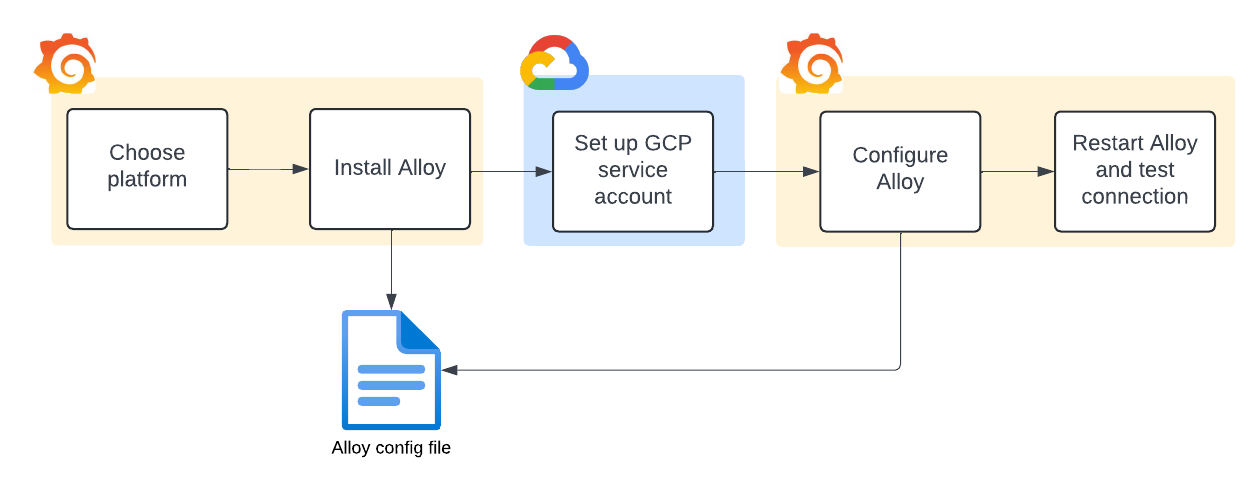
Complete the following steps to configure GCP Metrics as shown in the following diagram.
Select your platform
Select the platform from the drop-down menu.
Install Grafana Alloy
Grafana Alloy includes an embedded exporter to gather and send metrics to Grafana Cloud.
- If you have not already installed Alloy where you intend to run GCP Metrics, click Run Grafana Alloy.
- At the Alloy configuration screen, either create a token or use an existing token.
- To create a token, enter a token name, then click Create token. The token displays on the screen and is added to the command for running Alloy. Copy the command and paste it into the terminal.
- To use an existing token, paste it into the token field, then click Proceed to install integration.
- Copy the command and paste it into the terminal.
- Click Proceed to install integration.
Set up GCP service account
To export metrics from GCP, the Google Stackdriver Exporter is used. That exporter uses the Google Golang Client Library, which offers a variety of ways to provide credentials.
- Click Setup instructions.
- At the Set up GCP service account screen, use the content and links to set up the service account in Google Cloud.
- To learn how to provide credentials, refer to Google Application Default Credentials.
- The
roles/monitoring.viewerIAM role contains the required permissions. Refer to the Access Control Guide for details. - For legacy Access scopes, you must use the
https://www.googleapis.com/auth/monitoring.readscope.
- Click Close to return to the next step.
Configure Alloy
Set up Grafana Alloy to scrape resource metrics within your GCP projects.
Navigate to the configuration file for your Alloy instance.
Copy and append the following to your Alloy configuration file to work with the GCP metrics exporter embedded in Grafana Alloy.
prometheus.exporter.gcp "integrations_gcp" {
        project_ids = [
                "@@@YOUR_PROJECT@@@",
        ]

        metrics_prefixes = [
                "pubsub.googleapis.com/subscription",
                "pubsub.googleapis.com/snapshot",
                "pubsub.googleapis.com/subscription/num_undelivered_messages",
                "pubsub.googleapis.com/subscription/oldest_unacked_message_age"
        ]
}

prometheus.scrape "integrations_gcp" {
    targets    = prometheus.exporter.gcp.integrations_gcp.targets
    forward_to = [prometheus.remote_write.metrics_service.receiver]
    job_name   = "integrations/gcp"
}
Find the value for these properties in GCP and replace them with the appropriate values in your Alloy configuration file.
Property Value project_idsThe Google Cloud project ID you want to scrape metrics from. metrics_prefixesPrefixes for the metric type. Each prefix represents a specific GCP resource, potentially followed by the metric types you want to scrape. Specify the prefixes you want to scrape metrics from. For more information on GCP prefixes, refer to the Google Cloud metrics overview. Examples for PubSub:
- All metrics:
pubsub.googleapis.com/ - All snapshot-specific metrics:
pubsub.googleapis.com/snapshot - All snapshot-specific metrics and a few subscription metrics:
pubsub.googleapis.com/snapshotpubsub.googleapis.com/subscription/num_undelivered_messagespubsub.googleapis.com/subscription/oldest_unacked_message_age
- All metrics:
Add any additional filters to further refine the resources you want to collect metrics from.
Property Value request_intervalThe time range used when querying for metrics. Defaults to 5 minutes when not set. ingest_delayOffset for the Google Monitoring Metrics interval into the past by the ingest delay from the metric metadata. This automatically adjusts the time range used when querying for metrics backwards. The delay is based on the metadata GCP has published for how long the data can take to be ingested. Defaults to falsewhen not set.request_offsetOffset for the Google Monitoring Metrics interval into the past. Defaults to 0 seconds when not set. drop_delegated_projectsDrop metrics from attached projects and only fetch project_id. Defaults tofalsewhen not set.gcp_client_timeoutThe time in seconds that the collector should wait for a result from the API. Defaults to 15 seconds when not set.
Restart Grafana Alloy
Run the command appropriate for your platform to restart Grafana Alloy so your changes can take effect.
Test connection
Click Test connection to test that Grafana Alloy is collecting data and sending it to Grafana Cloud.
View your dashboards and alerts
You can now view:
Was this page helpful?
Related resources from Grafana Labs


