
 Grafana Cloud
Observe and act
Test and validate
Synthetic Monitoring
Configure alerts
Configure custom alerts
Grafana Cloud
Observe and act
Test and validate
Synthetic Monitoring
Configure alerts
Configure custom alertsConfigure custom alerts
You can use Grafana Alerting to view legacy Synthetic Monitoring alert rules, create custom alert rules, and set up alert notifications.
Create custom alert rules
You can create PromQL queries for check metrics to create custom Grafana alerts.
Example query: check if latency exceeds 1 second.
sum by (instance, job) (rate(probe_all_duration_seconds_sum{}[10m]))
/
sum by (instance, job) (rate(probe_all_duration_seconds_count{}[10m])) > 1
Example query: check if the probe error rate is higher than 10%.
1 - (
sum by (instance, job) (rate(probe_all_success_sum{}[10m]))
/
sum by (instance, job) (rate(probe_all_success_count{}[10m]))
) > 0.1
Example query: check if latency exceeds 1 second, only for checks with the custom label environment="prod".
sum by (instance, job, environment) (rate(probe_all_duration_seconds_sum{environment="prod"}[10m]))
/
sum by (instance, job, environment) (rate(probe_all_duration_seconds_count{environment="prod"}[10m])) > 1
Include the custom label in the by () clause so that the resulting alert instances carry it, which makes the label available for alert routing.
Note
This example assumes your custom labels appear directly on check metrics. If your tenant still uses the
label_prefix, custom labels are only available on thesm_check_infometric and require a join. Refer to Custom labels for the legacy query pattern, and to Migrate to un-prefixed labels to remove the prefix.
For more examples, refer to the most popular Synthetic Monitoring alerts and find the distinct metrics for the various check types.
To explore the different options and settings for creating alerts, refer to Configure Alert Rules.
Access alert rules from Alerting
Synthetic Monitoring alert rules can also be found in Grafana Cloud Alerting within the synthetic_monitoring namespace. Legacy alert rules are created inside the default rule group.
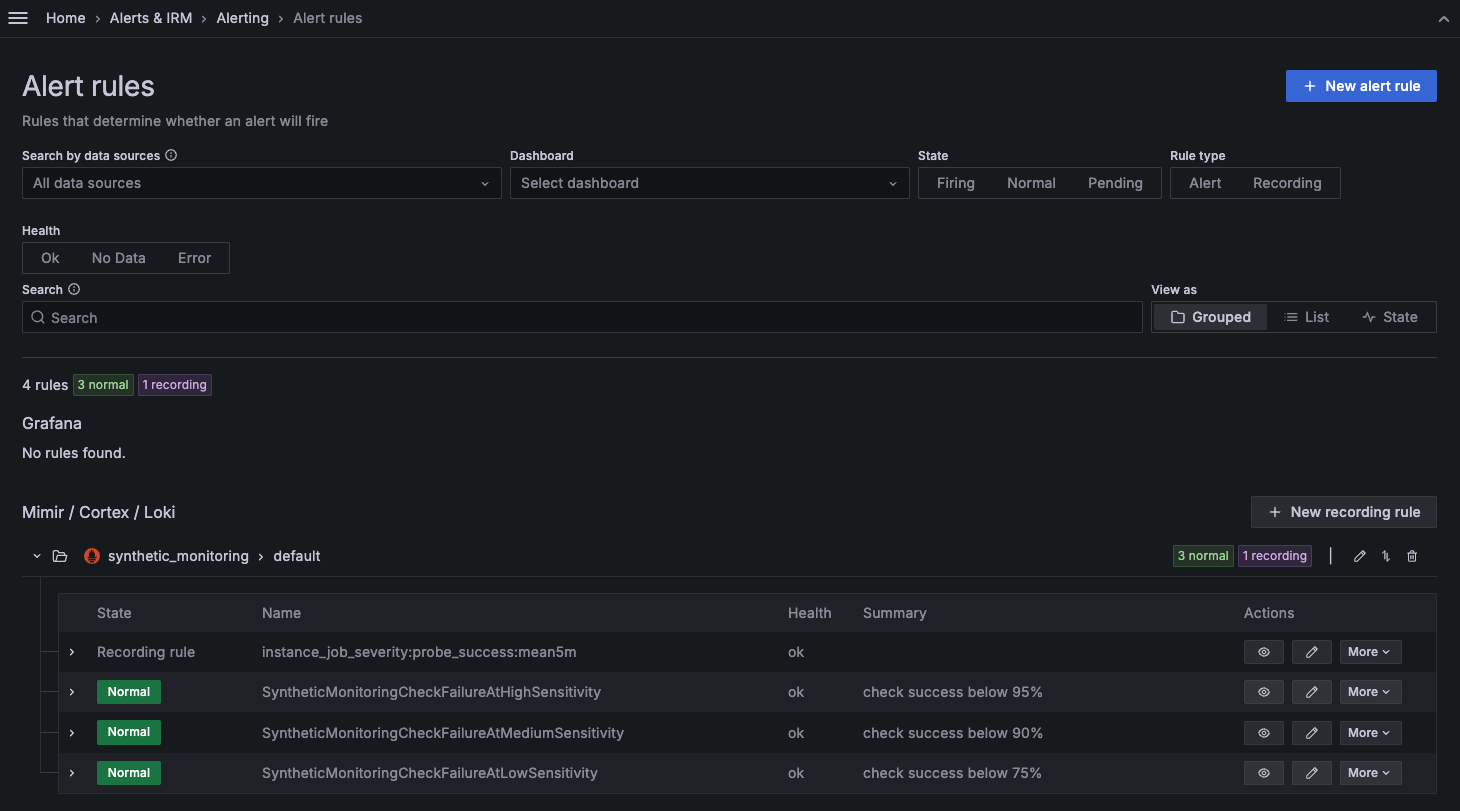
You can then use alert labels to configure the alert notifications in Grafana Alerting.
The legacy Synthetic Monitoring alert rules set the namespace and alert_sensitivity labels. For reference, the preconfigured low sensitivity alert rule is as follows:
alert: SyntheticMonitoringCheckFailureAtLowSensitivity
expr: instance_job_severity:probe_success:mean5m{alert_sensitivity="low"} < 75
for: 5m
labels:
  namespace: synthetic_monitoring
annotations:
  description: check job {{ $labels.job }} instance {{ $labels.instance }} has a success rate of {{ printf "%.1f" $value }}%.
  summary: check success below 75%
Note
Alerts can be edited in Synthetic Monitoring on the alerts page or in the Cloud Alerting UI.
It’s possible that substantially editing a legacy Synthetic Monitoring alert rule in the Cloud Alerting UI causes it to no longer be editable in the Synthetic Monitoring UI. In that case, the alert rule can only be edited in Cloud Alerting.
For example, if you edit the value
75to90, this change propagates back to the Synthetic Monitoring alerts tab, and the alert then fires according to your edit. However, if you edit the value75tosteve, the alert becomes invalid and no longer editable in the Synthetic Monitoring alerts tab UI.
Alert notifications
After you have configured your alert rules and enabled your check to trigger alerts, you can set up Alerting notifications to know when a probe fails. Refer to Alerting Notifications for more details.
Route alerts with custom labels
Custom labels on your checks appear on the alert instances that fire for them, so you can use them as matchers in your notification policies. For example, if your checks carry a team label, a notification policy that matches team=checkout routes those alerts to the checkout team’s contact point.
Note
If you’re migrating from the
label_prefix and run notification policies for both the prefixed and un-prefixed label forms, alerts may match both policy trees while dual-write is active, and you may see duplicate notifications until you finalize the migration and remove the duplicate policy. Refer to Migrate to un-prefixed labels for the migration checklist.
Link to Synthetic Monitoring dashboards in alert notifications
To quickly access your Synthetic Monitoring check dashboards when an alert fires, add a link in your alert rule’s notification message.
Synthetic Monitoring checks are identified by their job and instance pair, so you must include those labels as query parameters in the dashboard URL.
The following example URL links to the Synthetic Monitoring check dashboard for the specific check that triggered the alert. Update the placeholder with the URL of your Grafana stack:
@@@SM_STACK_URL@@@/a/grafana-synthetic-monitoring-app/scene?var-job={{ $labels.job }}&var-instance={{ $labels.instance }}Was this page helpful?
Related resources from Grafana Labs



