OracleDB integration for Grafana Cloud
OracleDB is an enterprise SQL Database system produced and marketed by Oracle Corporation. The OracleDB integration uses Grafana Alloy to collect metrics and alert logs for monitoring an OracleDB instance. Including metrics such as virtual memory usage, open file descriptors, sessions, processes, database wait times, and tablespace usage. It also includes monitoring the alert log of an OracleDB instance which contains valuable information for usage and operations of the instance.
This integration supports metrics provided by the official Oracle Database Metrics Exporter, which is integrated into Alloy.
This integration includes 3 useful alerts and 2 pre-built dashboards to help monitor and visualize OracleDB metrics and logs.
Before you begin
In the Alloy configuration file, you must provide a connection string which has credentials with permissions to run queries.
To create a user with the SQL permissions required for the monitoring user “grafanau”.
Non-CDB: can run the script as-is.
CDB: connect as SYSDBA, uncomment ALTER SESSION SET CONTAINER = CDB$ROOT, then swap the blocks: comment out the grafanau CREATE USER / GRANT lines and uncomment the C##grafanau equivalents.
  -- Non-CDB: run as-is. CDB: as SYSDBA, uncomment ALTER SESSION, then swap: comment out grafanau CREATE/GRANTs, uncomment C##grafanau CREATE/GRANTs.
  -- ALTER SESSION SET CONTAINER = CDB$ROOT;

  -- Create users
  CREATE USER grafanau IDENTIFIED BY <YOUR-PASSWORD>;
  -- CREATE USER C##grafanau IDENTIFIED BY <YOUR-PASSWORD>;

  GRANT CONNECT TO grafanau;
  GRANT SELECT ON SYS.GV_$RESOURCE_LIMIT TO grafanau;
  GRANT SELECT ON SYS.V_$SESSION TO grafanau;
  GRANT SELECT ON SYS.V_$WAITCLASSMETRIC TO grafanau;
  GRANT SELECT ON SYS.GV_$PROCESS TO grafanau;
  GRANT SELECT ON SYS.GV_$SYSSTAT TO grafanau;
  GRANT SELECT ON SYS.V_$DATAFILE TO grafanau;
  GRANT SELECT ON SYS.V_$ASM_DISKGROUP_STAT TO grafanau;
  GRANT SELECT ON SYS.V_$SYSTEM_WAIT_CLASS TO grafanau;
  GRANT SELECT ON SYS.DBA_TABLESPACE_USAGE_METRICS TO grafanau;
  GRANT SELECT ON SYS.DBA_TABLESPACES TO grafanau;
  GRANT SELECT ON SYS.GLOBAL_NAME TO grafanau;
  -- GRANT CONNECT TO C##grafanau;
  -- GRANT SELECT ON SYS.GV_$RESOURCE_LIMIT TO C##grafanau;
  -- GRANT SELECT ON SYS.V_$SESSION TO C##grafanau;
  -- GRANT SELECT ON SYS.V_$WAITCLASSMETRIC TO C##grafanau;
  -- GRANT SELECT ON SYS.GV_$PROCESS TO C##grafanau;
  -- GRANT SELECT ON SYS.GV_$SYSSTAT TO C##grafanau;
  -- GRANT SELECT ON SYS.V_$DATAFILE TO C##grafanau;
  -- GRANT SELECT ON SYS.V_$ASM_DISKGROUP_STAT TO C##grafanau;
  -- GRANT SELECT ON SYS.V_$SYSTEM_WAIT_CLASS TO C##grafanau;
  -- GRANT SELECT ON SYS.DBA_TABLESPACE_USAGE_METRICS TO C##grafanau;
  -- GRANT SELECT ON SYS.DBA_TABLESPACES TO C##grafanau;
  -- GRANT SELECT ON SYS.GLOBAL_NAME TO C##grafanau;
Install OracleDB integration for Grafana Cloud
- In your Grafana Cloud stack, click Connections in the left-hand menu.
- Find OracleDB and click its tile to open the integration.
- Review the prerequisites in the Configuration Details tab and set up Grafana Alloy to send OracleDB metrics and logs to your Grafana Cloud instance.
- Click Install to add this integration’s pre-built dashboards and alerts to your Grafana Cloud instance, and you can start monitoring your OracleDB setup.
Configuration snippets for Grafana Alloy
Simple mode
Starting with Alloy v1.9.0 the Oracle Instant Client is a pre-requisite for Alloy to collect against Oracle Database. You may accomplish this by modifying your Alloy installation to properly configure the environment variable ORACLE_HOME to be set for your installation, i.e. /lib/oracle/21/client64/lib.
To modify your Alloy configuration please add the environment file for the service.
# The configuration file holding the Alloy config.
CONFIG_FILE="/etc/alloy/config.alloy"

...

# Link Oracle Libraries to alloy
ORACLE_HOME=<path/to/oracle/home>
These snippets are configured to scrape a single OracleDB instance running locally with default ports.
First, manually copy and append the following snippets into your alloy configuration file.
Integrations snippets
prometheus.exporter.oracledb "integrations_oracledb" {
	connection_string = "oracle://user:password@localhost:1521/orcl.localnet"
}

discovery.relabel "integrations_oracledb" {
	targets = prometheus.exporter.oracledb.integrations_oracledb.targets

	rule {
		target_label = "instance"
		replacement  = constants.hostname
	}

	rule {
		target_label = "job"
		replacement  = "integrations/oracledb"
	}
}

prometheus.scrape "integrations_oracledb" {
	targets         = discovery.relabel.integrations_oracledb.output
	forward_to      = [prometheus.remote_write.metrics_service.receiver]
	job_name        = "integrations/oracledb"
	scrape_interval = "5m0s"
	scrape_timeout  = "1m0s"
}
Logs snippets
linux
local.file_match "logs_integrations_integrations_oracledb" {
	path_targets = [{
		__address__ = "localhost",
		__path__    = "/u01/base/diag/rdbms/*/*/trace/alert_*.log",
		instance    = constants.hostname,
		job         = "integrations/oracledb",
	}]
}

loki.process "logs_integrations_integrations_oracledb" {
	forward_to = [loki.write.grafana_cloud_loki.receiver]

	stage.multiline {
		firstline     = "\\d+-\\d+-\\d+T\\d+:\\d+:\\d+.\\d+-\\d+:\\d+"
		max_lines     = 0
		max_wait_time = "3s"
	}
}

loki.source.file "logs_integrations_integrations_oracledb" {
	targets    = local.file_match.logs_integrations_integrations_oracledb.targets
	forward_to = [loki.process.logs_integrations_integrations_oracledb.receiver]
}
Advanced mode
The following snippets provide examples to guide you through the configuration process.
To instruct Grafana Alloy to scrape your OracleDB instances, manually copy and append the snippets to your alloy configuration file, then follow subsequent instructions.
Advanced integrations snippets
prometheus.exporter.oracledb "integrations_oracledb" {
	connection_string = "oracle://user:password@localhost:1521/orcl.localnet"
}

discovery.relabel "integrations_oracledb" {
	targets = prometheus.exporter.oracledb.integrations_oracledb.targets

	rule {
		target_label = "instance"
		replacement  = constants.hostname
	}

	rule {
		target_label = "job"
		replacement  = "integrations/oracledb"
	}
}

prometheus.scrape "integrations_oracledb" {
	targets         = discovery.relabel.integrations_oracledb.output
	forward_to      = [prometheus.remote_write.metrics_service.receiver]
	job_name        = "integrations/oracledb"
	scrape_interval = "5m0s"
	scrape_timeout  = "1m0s"
}
This integrations uses the prometheus.exporter.oracledb component to generate metrics from a OracleDB instance.
For the full array of configuration options, refer to the prometheus.exporter.oracledb component reference documentation.
This exporter must be linked with a discovery.relabel component to apply the necessary relabelings.
For each OracleDB instance to be monitored you must create a pair of these components.
Configure the following properties within each discovery.relabel component:
instancelabel:constants.hostnamesets theinstancelabel to your Grafana Alloy server hostname. If that is not suitable, change it to a value uniquely identifies this OracleDB instance. Make sure this label value is the same for all telemetry data collected for this instance.
You can then scrape them by including each discovery.relabel under targets within the prometheus.scrape component.
Advanced logs snippets
linux
local.file_match "logs_integrations_integrations_oracledb" {
	path_targets = [{
		__address__ = "localhost",
		__path__    = "/u01/base/diag/rdbms/*/*/trace/alert_*.log",
		instance    = constants.hostname,
		job         = "integrations/oracledb",
	}]
}

loki.process "logs_integrations_integrations_oracledb" {
	forward_to = [loki.write.grafana_cloud_loki.receiver]

	stage.multiline {
		firstline     = "\\d+-\\d+-\\d+T\\d+:\\d+:\\d+.\\d+-\\d+:\\d+"
		max_lines     = 0
		max_wait_time = "3s"
	}
}

loki.source.file "logs_integrations_integrations_oracledb" {
	targets    = local.file_match.logs_integrations_integrations_oracledb.targets
	forward_to = [loki.process.logs_integrations_integrations_oracledb.receiver]
}
To monitor your OracleDB instance logs, you will use a combination of the following components:
local.file_match defines where to find the log file to be scraped. Change the following properties according to your environment:
__address__: The OracleDB instance address__path__: The path to the log file.instancelabel:constants.hostnamesets theinstancelabel to your Grafana Alloy server hostname. If that is not suitable, change it to a value uniquely identifies this OracleDB instance. Make sure this label value is the same for all telemetry data collected for this instance.
loki.process defines how to process logs before sending it to Loki.
loki.source.file sends logs to Loki.
Kubernetes instructions
Before you begin with Kubernetes
Please note: These instructions assume the use of the Kubernetes Monitoring Helm chart
In the provided configuration snippet, you must provide a connection string which has credentials with permissions to run queries.
To create a user with the SQL permissions required for the monitoring user grafanau.
Non-CDB: can run the script as-is.
CDB: connect as SYSDBA, uncomment ALTER SESSION SET CONTAINER = CDB$ROOT, then swap the blocks: comment out the grafanau CREATE USER / GRANT lines and uncomment the C##grafanau equivalents.
  -- Non-CDB: run as-is. CDB: as SYSDBA, uncomment ALTER SESSION, then swap: comment out grafanau CREATE/GRANTs, uncomment C##grafanau CREATE/GRANTs.
  -- ALTER SESSION SET CONTAINER = CDB$ROOT;

  -- Create users
  CREATE USER grafanau IDENTIFIED BY <YOUR-PASSWORD>;
  -- CREATE USER C##grafanau IDENTIFIED BY <YOUR-PASSWORD>;

  GRANT CONNECT TO grafanau;
  GRANT SELECT ON SYS.GV_$RESOURCE_LIMIT TO grafanau;
  GRANT SELECT ON SYS.V_$SESSION TO grafanau;
  GRANT SELECT ON SYS.V_$WAITCLASSMETRIC TO grafanau;
  GRANT SELECT ON SYS.GV_$PROCESS TO grafanau;
  GRANT SELECT ON SYS.GV_$SYSSTAT TO grafanau;
  GRANT SELECT ON SYS.V_$DATAFILE TO grafanau;
  GRANT SELECT ON SYS.V_$ASM_DISKGROUP_STAT TO grafanau;
  GRANT SELECT ON SYS.V_$SYSTEM_WAIT_CLASS TO grafanau;
  GRANT SELECT ON SYS.DBA_TABLESPACE_USAGE_METRICS TO grafanau;
  GRANT SELECT ON SYS.DBA_TABLESPACES TO grafanau;
  GRANT SELECT ON SYS.GLOBAL_NAME TO grafanau;
  -- GRANT CONNECT TO C##grafanau;
  -- GRANT SELECT ON SYS.GV_$RESOURCE_LIMIT TO C##grafanau;
  -- GRANT SELECT ON SYS.V_$SESSION TO C##grafanau;
  -- GRANT SELECT ON SYS.V_$WAITCLASSMETRIC TO C##grafanau;
  -- GRANT SELECT ON SYS.GV_$PROCESS TO C##grafanau;
  -- GRANT SELECT ON SYS.GV_$SYSSTAT TO C##grafanau;
  -- GRANT SELECT ON SYS.V_$DATAFILE TO C##grafanau;
  -- GRANT SELECT ON SYS.V_$ASM_DISKGROUP_STAT TO C##grafanau;
  -- GRANT SELECT ON SYS.V_$SYSTEM_WAIT_CLASS TO C##grafanau;
  -- GRANT SELECT ON SYS.DBA_TABLESPACE_USAGE_METRICS TO C##grafanau;
  -- GRANT SELECT ON SYS.DBA_TABLESPACES TO C##grafanau;
  -- GRANT SELECT ON SYS.GLOBAL_NAME TO C##grafanau;
Configuration snippets for Kubernetes Helm chart
The following snippets provide examples to guide you through the configuration process.
To scrape your OracleDB instances, manually modify your Kubernetes Monitoring Helm chart with these configuration snippets.
Replace any values between the angle brackets <> in the provided snippets with your desired configuration values.
Metrics snippets
alloy-metrics:
    extraConfig: |-
        prometheus.exporter.oracledb "integrations_oracledb" {
            connection_string = "oracle://<db_user>:<db_password>@<oracledb_service>.<oracledb_namespace>.svc.cluster.local:1521/<oracledb_db_name>"
        }

        prometheus.scrape "integrations_oracledb" {
            targets    = prometheus.exporter.oracledb.integrations_oracledb.targets
            forward_to = [prometheus.remote_write.grafana_cloud_metrics.receiver]
            job_name   = "integrations/oracledb"
        }
Logs snippets
podLogs:
    extraDiscoveryRules: |-
        rule {
            source_labels = ["__meta_kubernetes_namespace", "__meta_kubernetes_pod_name"]
            separator     = ":"
            regex         = "(<namespace_name>:oracledb.*)"
            replacement   = "oracledb"
            target_label  = "integration"
        }

        rule {
            source_labels = ["integration", "__meta_kubernetes_namespace", "__meta_kubernetes_pod_name"]
            separator     = ":"
            regex         = \`oracledb:(.*):(\\w+).*\`
            replacement   = "$2.$1.svc.cluster.local:<db_port>"
            target_label  = "instance"
        }

        rule {
            source_labels = ["integration", "__meta_kubernetes_pod_node_name"]
            separator = ":"
            regex = "oracledb:(.*)"
            target_label = "host"
        }

        rule {
            source_labels = ["integration"]
            regex = "oracledb"
            replacement = "integrations/oracledb"
            target_label = "job"
        }

        rule {
            source_labels = ["integration"]
            regex = "oracledb"
            replacement = "oracledb"
            target_label = "log_type"
        }
Dashboards
The OracleDB integration installs the following dashboards in your Grafana Cloud instance to help monitor your system.
- Oracle Database logs
- Oracle Database overview
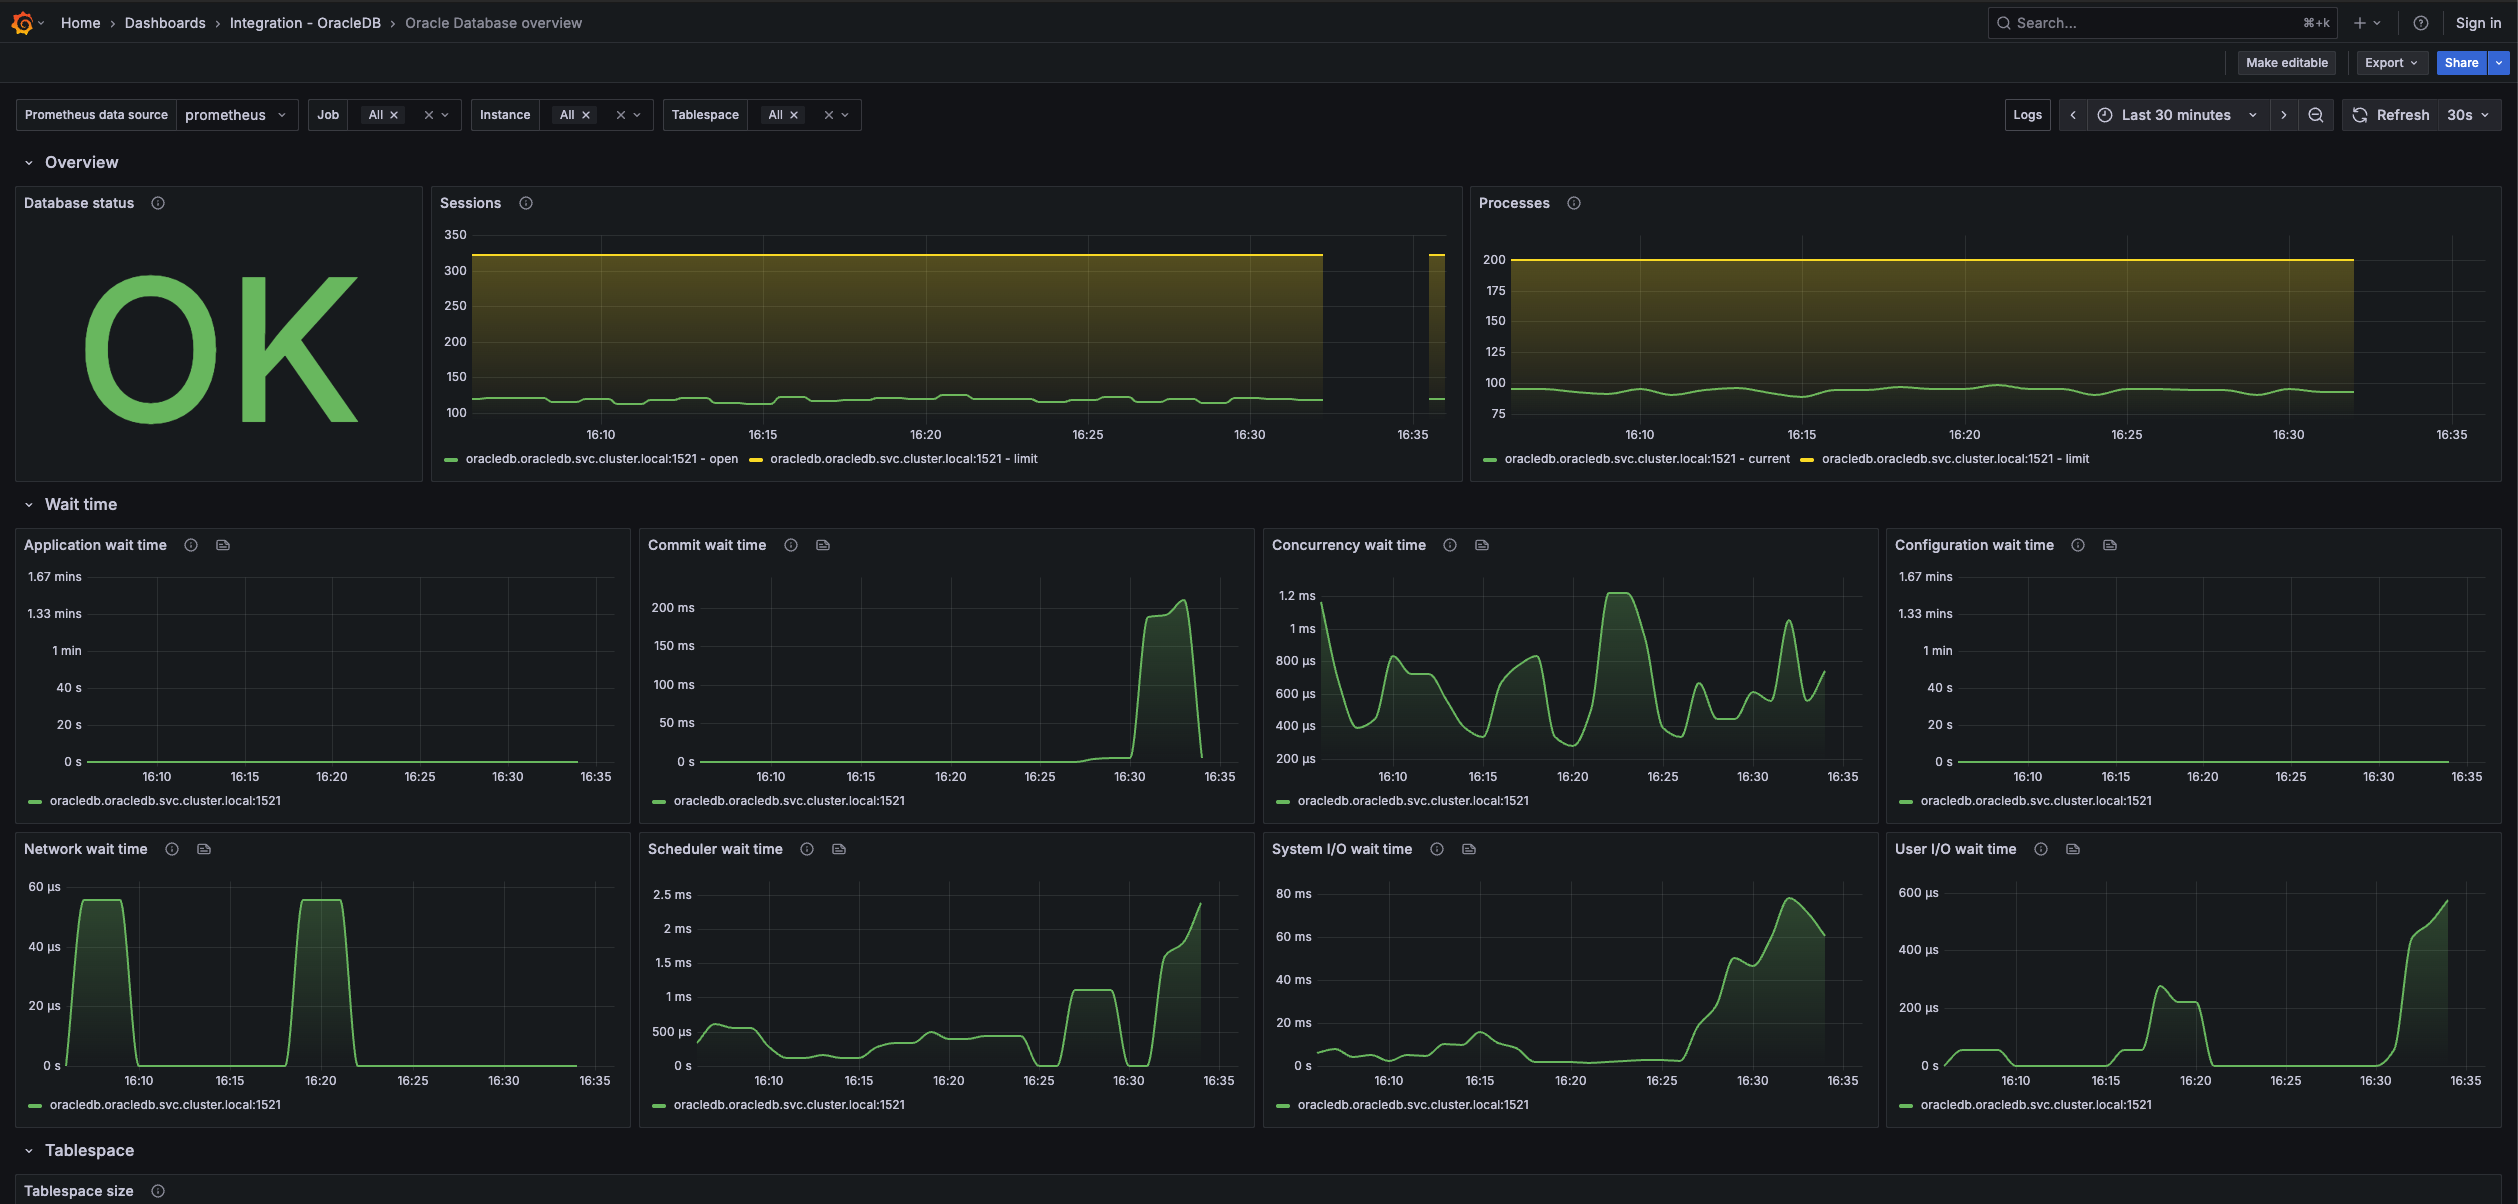
OracleDB overview dashboard
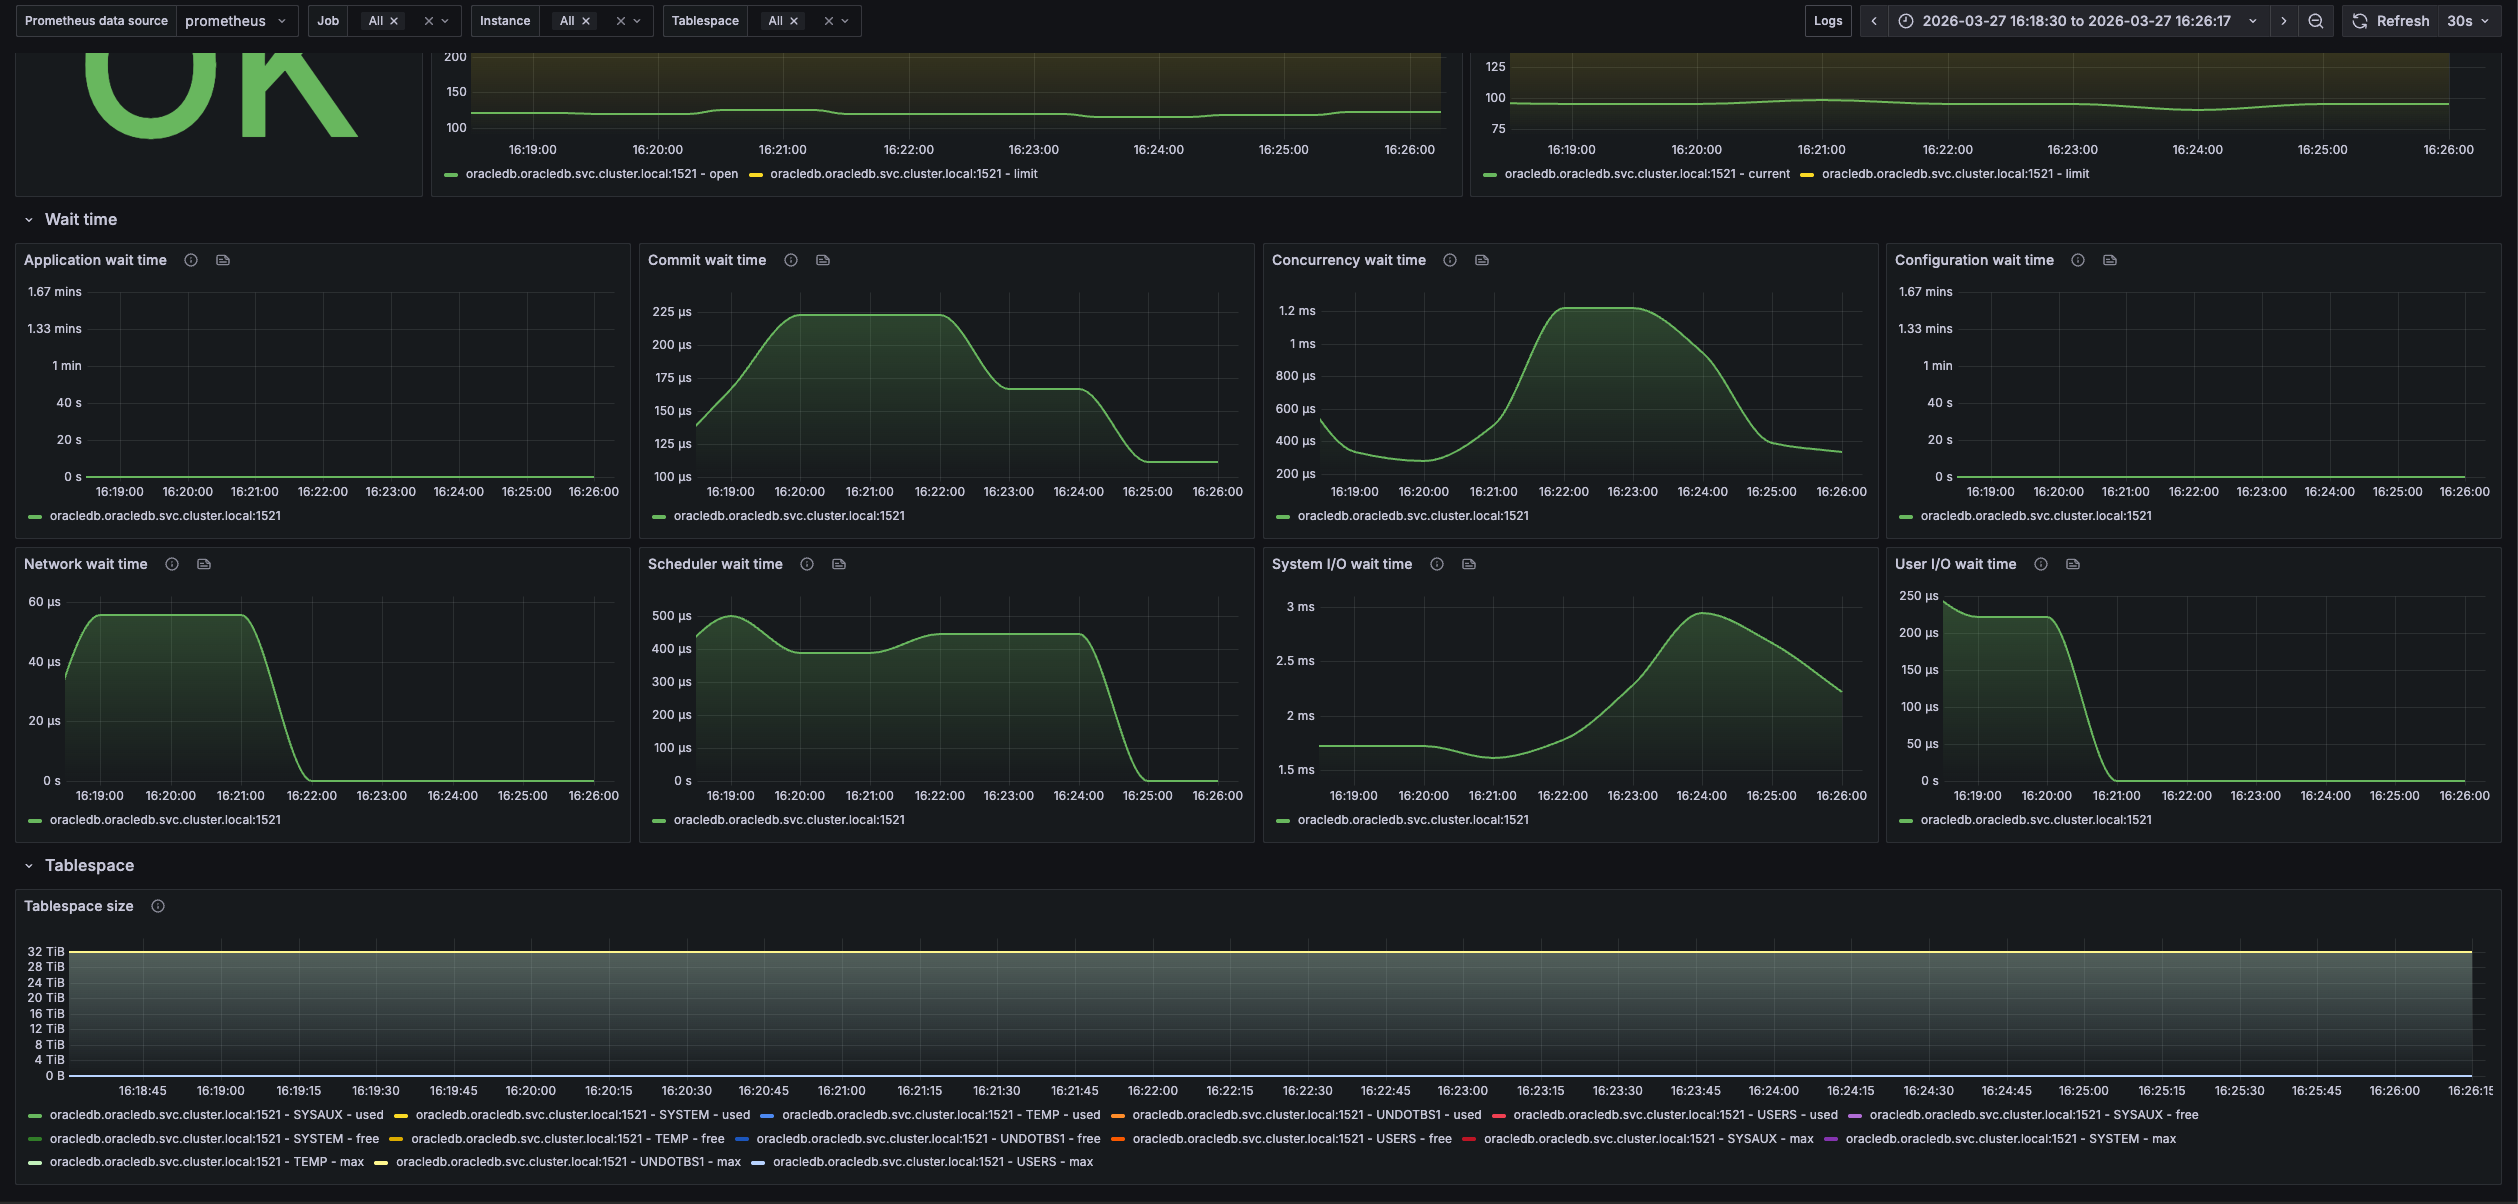
OracleDB overview dashboard (tablespace size)
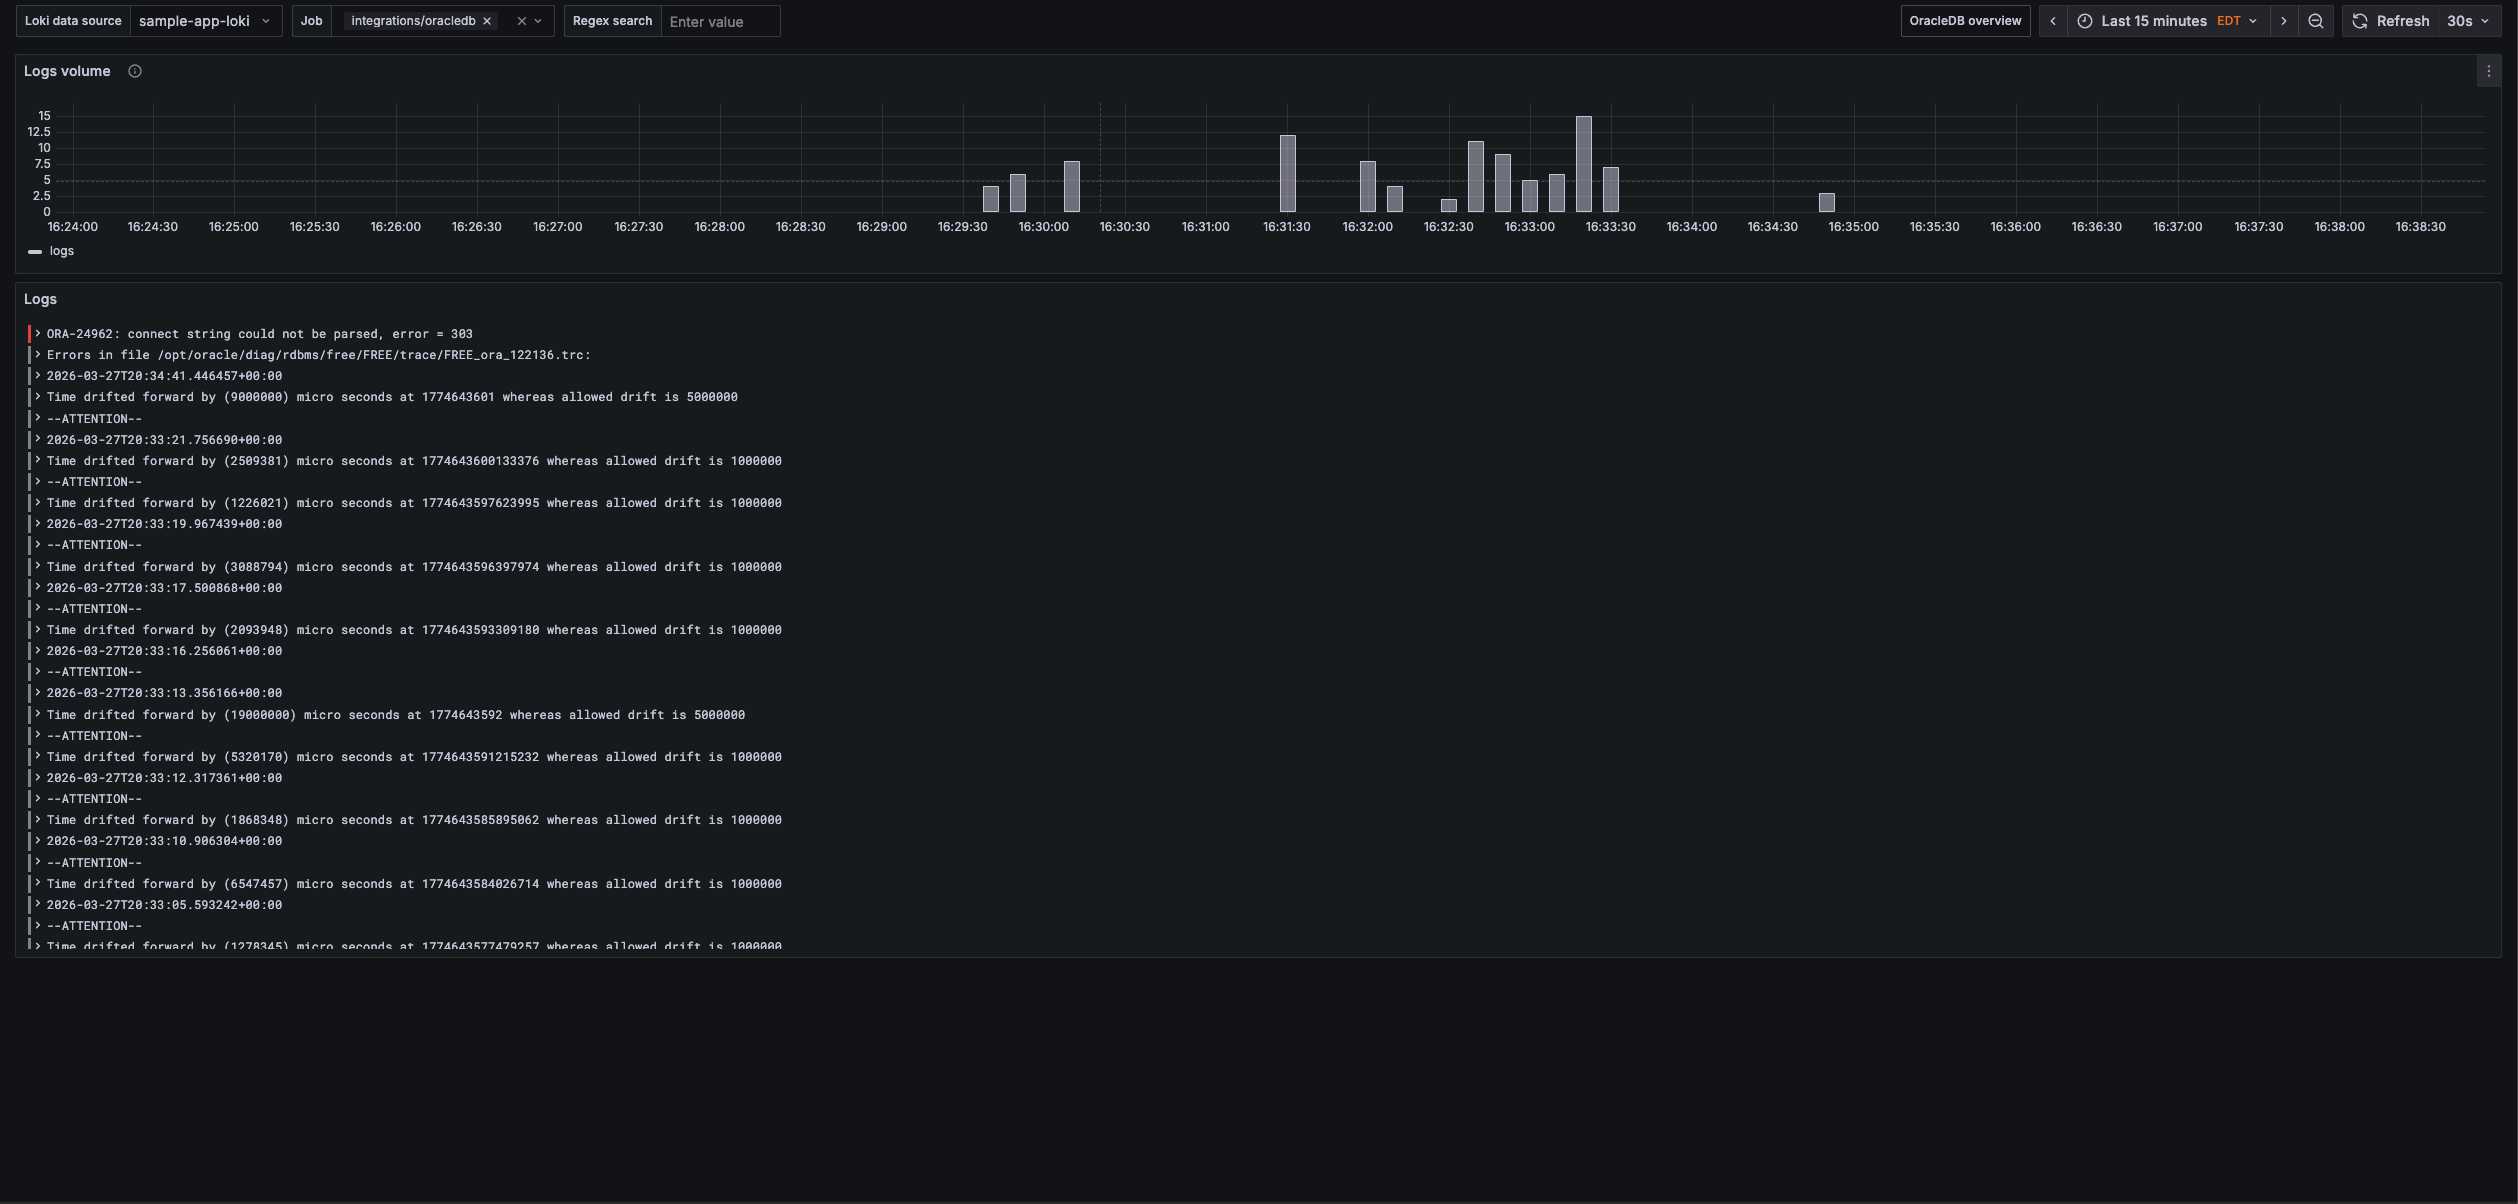
OracleDB logs dashboard
Alerts
The OracleDB integration includes the following useful alerts:
Metrics
The most important metrics provided by the OracleDB integration, which are used on the pre-built dashboards and Prometheus alerts, are as follows:
- oracledb_resource_current_utilization
- oracledb_resource_limit_value
- oracledb_tablespace_bytes
- oracledb_tablespace_free
- oracledb_tablespace_max_bytes
- oracledb_up
- oracledb_wait_time_application
- oracledb_wait_time_commit
- oracledb_wait_time_concurrency
- oracledb_wait_time_configuration
- oracledb_wait_time_network
- oracledb_wait_time_scheduler
- oracledb_wait_time_system_io
- oracledb_wait_time_user_io
- up
Changelog
# 1.1.0 - March 2026

* Updated dashboards to follow new stylistic standards
* Updated instructions to clarify more about PDB/CDB usage

# 1.0.0 - July 2025
* Updated instructions to accommodate for Alloy breaking change requiring configuration with an Oracle Client

# 0.0.4 - April 2024
* Added cluster selector to dashboards for kubernetes support
* Added default cluster label to agent config
* Bump version to 0.0.4

# 0.0.3 - September 2023

* New Filter Metrics option for configuring the Grafana Agent, which saves on metrics cost by dropping any metric not used by this integration. Beware that anything custom built using metrics that are not on the snippet will stop working.
* New hostname relabel option, which applies the instance name you write on the text box to the Grafana Agent configuration snippets, making it easier and less error prone to configure this mandatory label.

# 0.0.2 - August 2023

* Add regex filter for logs datasource

# 0.0.1 - February 2023

* Initial release
Cost
By connecting your OracleDB instance to Grafana Cloud, you might incur charges. To view information on the number of active series that your Grafana Cloud account uses for metrics included in each Cloud tier, see Active series and dpm usage and Cloud tier pricing.


