Configure Flask to generate Prometheus metrics
Flask is a python module that you can enable for Prometheus metrics using Flask Exporter for Prometheus.
To configure Flask to generate Prometheus metrics, perform the following steps:
Add the following export code in the Python module.
from prometheus_flask_exporter import PrometheusMetricsTo enable custom metrics, follow the steps provided in prometheus_flask_exporter.
Verify the presence of the following metrics in Prometheus:
- flask_http_request_duration_seconds
- flask_http_request_total
Metrics
| Metric | Key Performance Indicator(KPI) |
|---|---|
Requests flask_http_request_duration_seconds_count | Request Rate rate(flask_http_request_duration_seconds_count[5m]) |
Errors flask_http_request_duration_seconds_count | Error Ratio rate(flask_http_request_duration_seconds_count{status=~“5..”}[5m])/ rate(flask_http_request_duration_seconds_count[5m]) |
Latency flask_http_request_duration_seconds_bucket flask_http_request_duration_seconds_count | Latency Average rate(flask_http_request_duration_seconds_count[5m])/ rate(flask_http_request_duration_seconds_count[5m]) Latency P99 |
0.99, sum(rate(flask_http_request_duration_seconds_bucket[1m])) by (le) ) |
Alerts
| KPI | Alerts |
|---|---|
| Request Rate | RequestRateAnomaly |
| Error Rate | ErrorRatioBreach ErrorBuildup based on a 99.9 SLO |
Latency Average Latency P99 | LatencyAverageBreach LatencyAverageAnomaly LatencyP99ErrorBuildup |
Service KPI dashboard
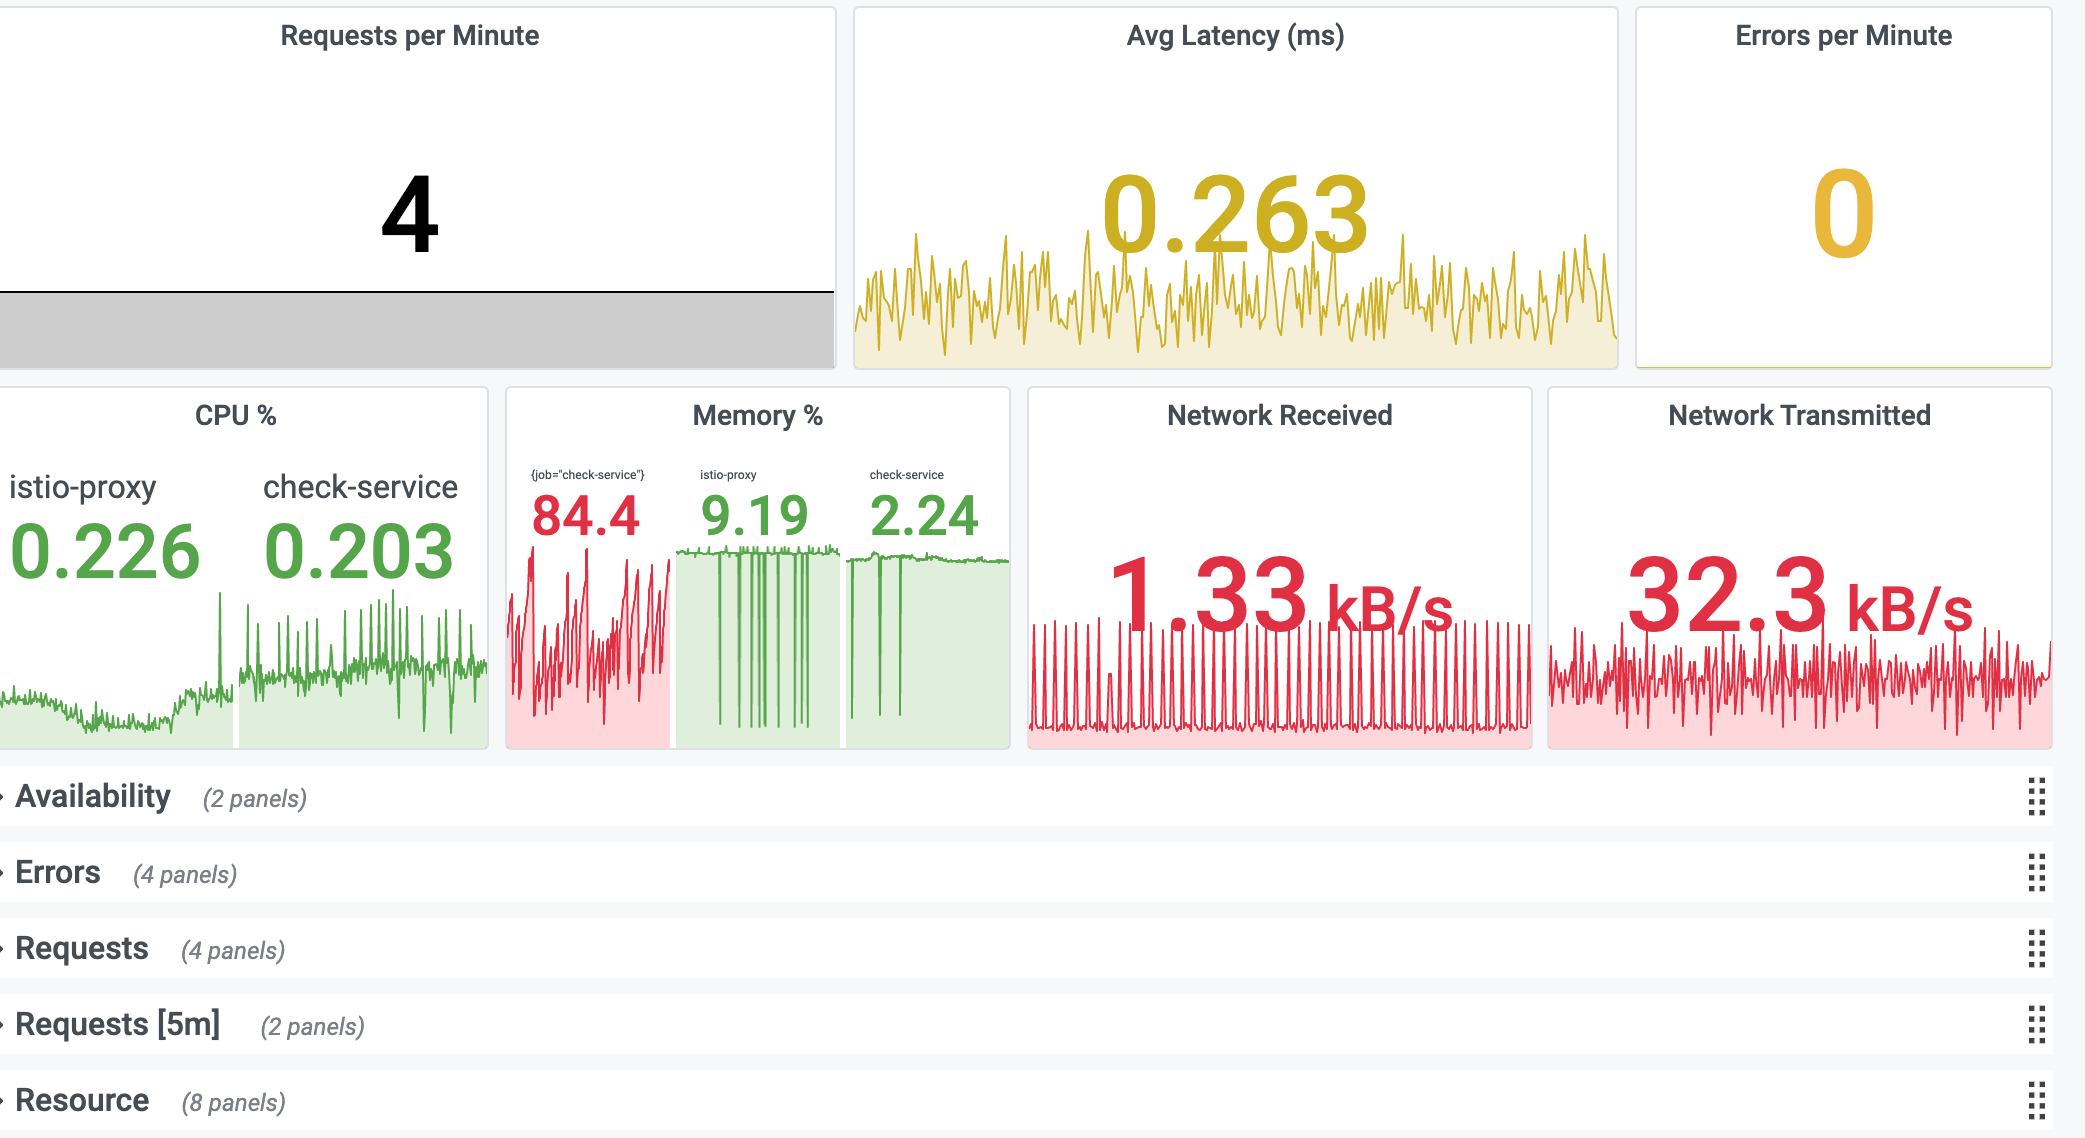
This dashboard has the following KPIs that include resource and requests metrics:
- Request Rate
- Latency Average
- Latency P99
- Error Rate
- CPU %
- CPU Cores Used
- CPU Throttle
- Memory %
- Memory Bytes
- Disk Usage
- Network Usage

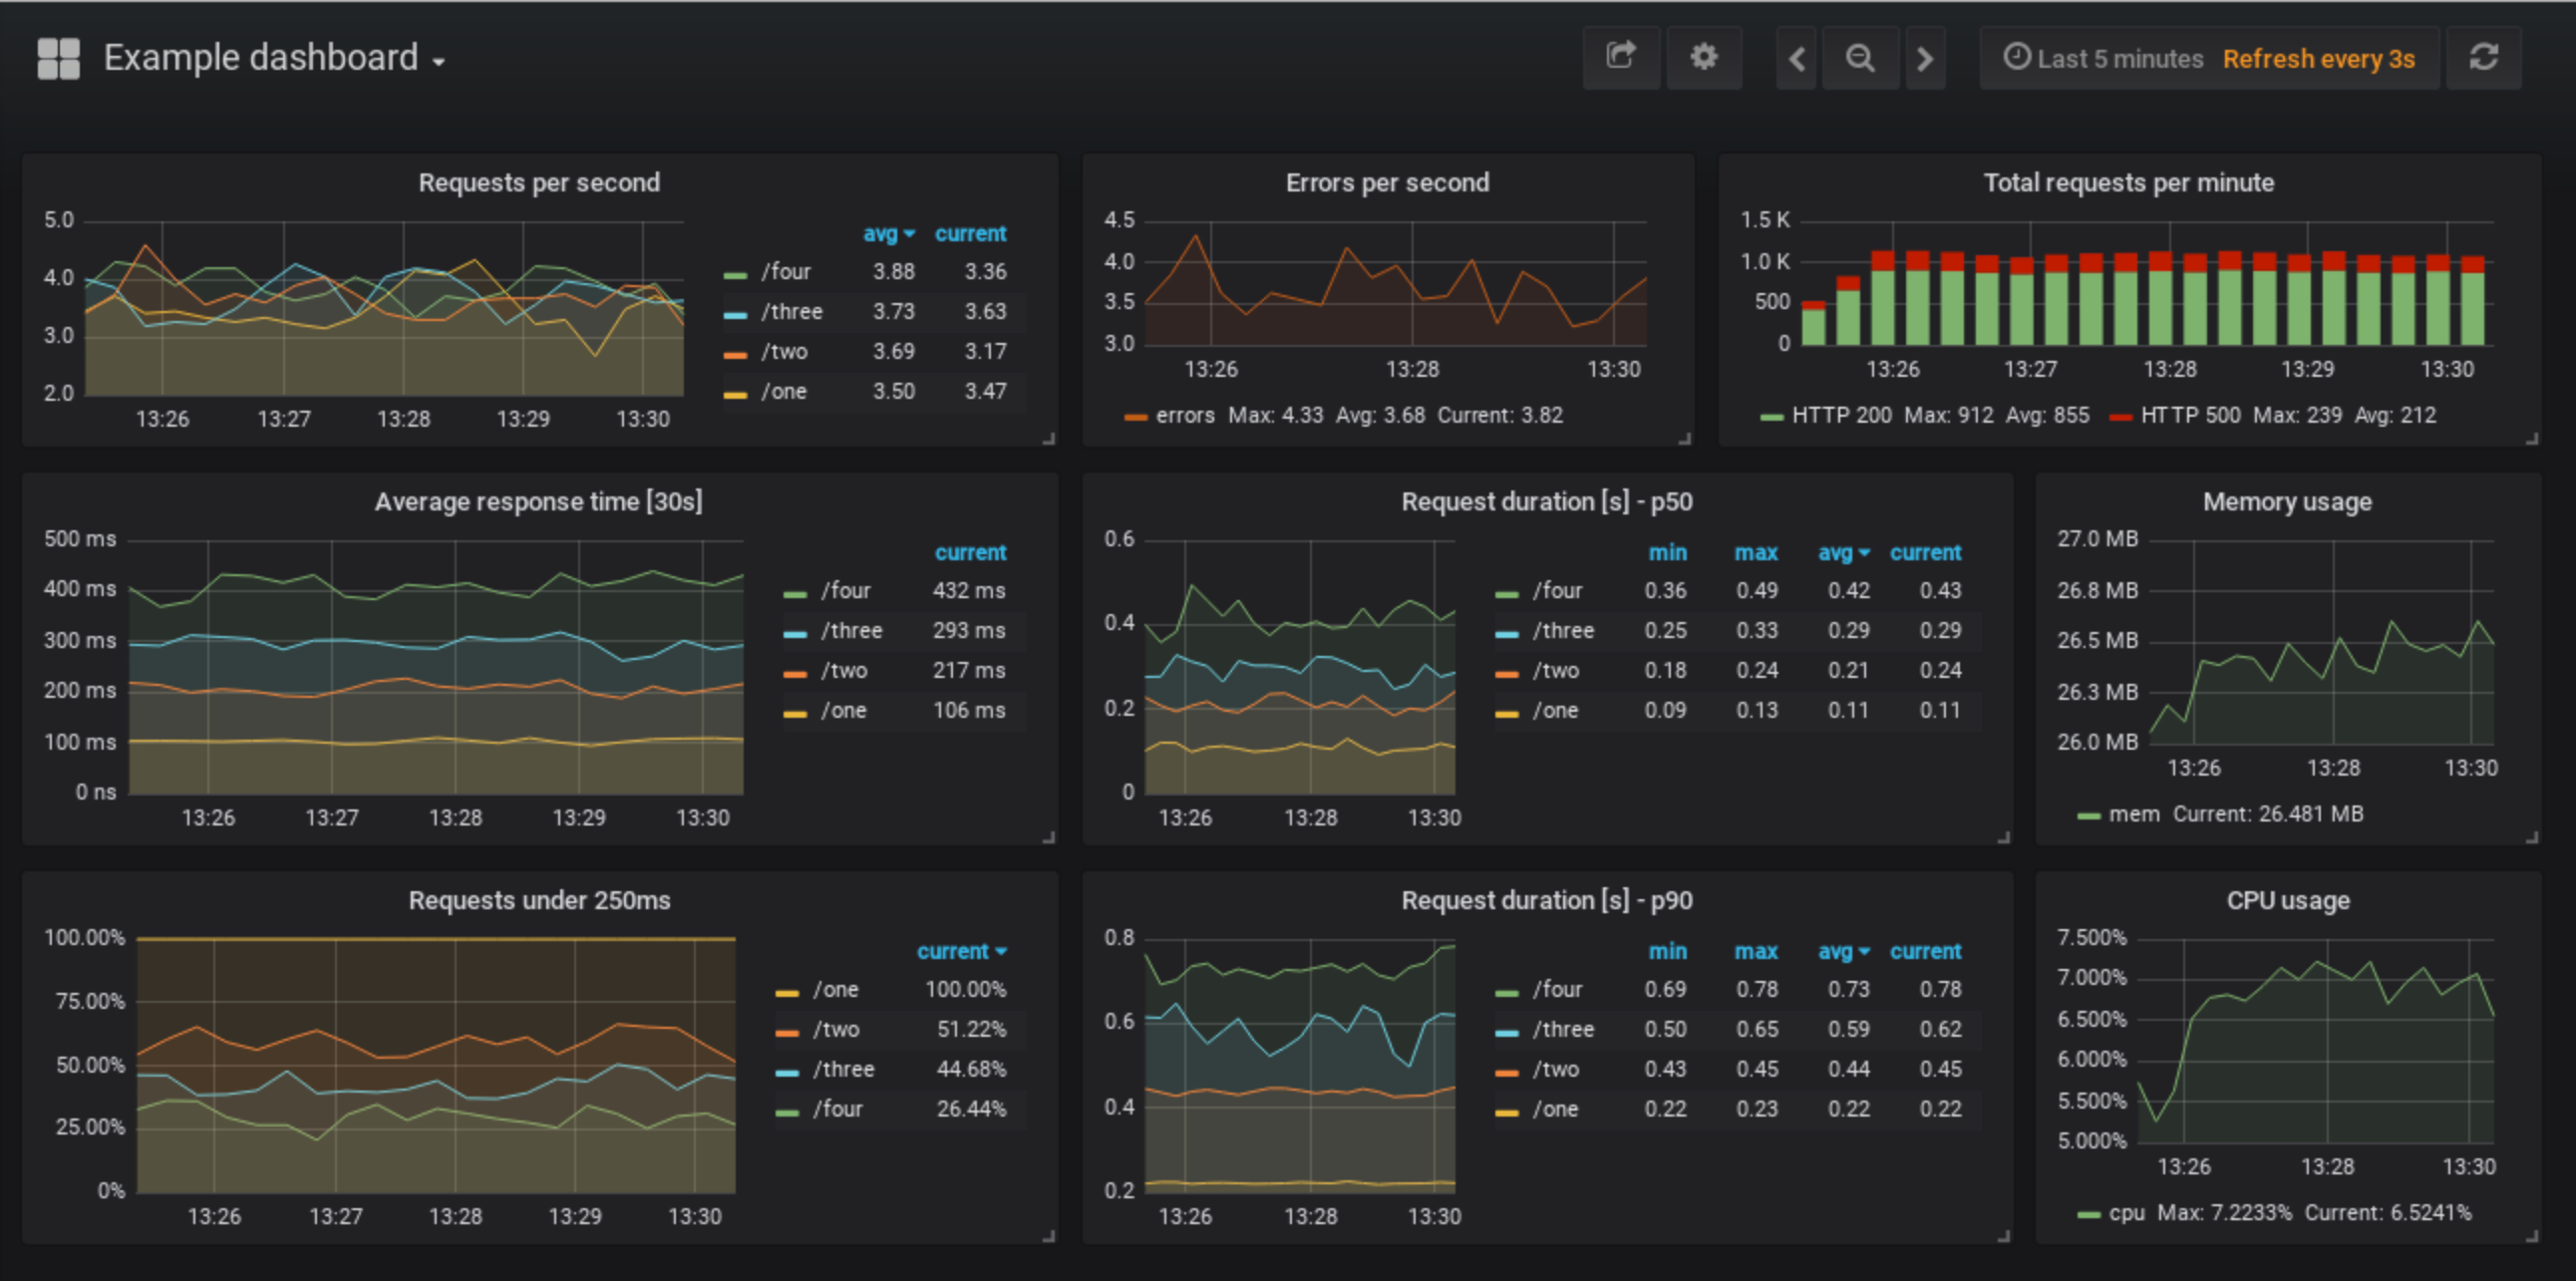
You can include any custom dashboard from the community. For example, this dashboard shows Flask specific metrics directly as a custom dashboard for your service.


