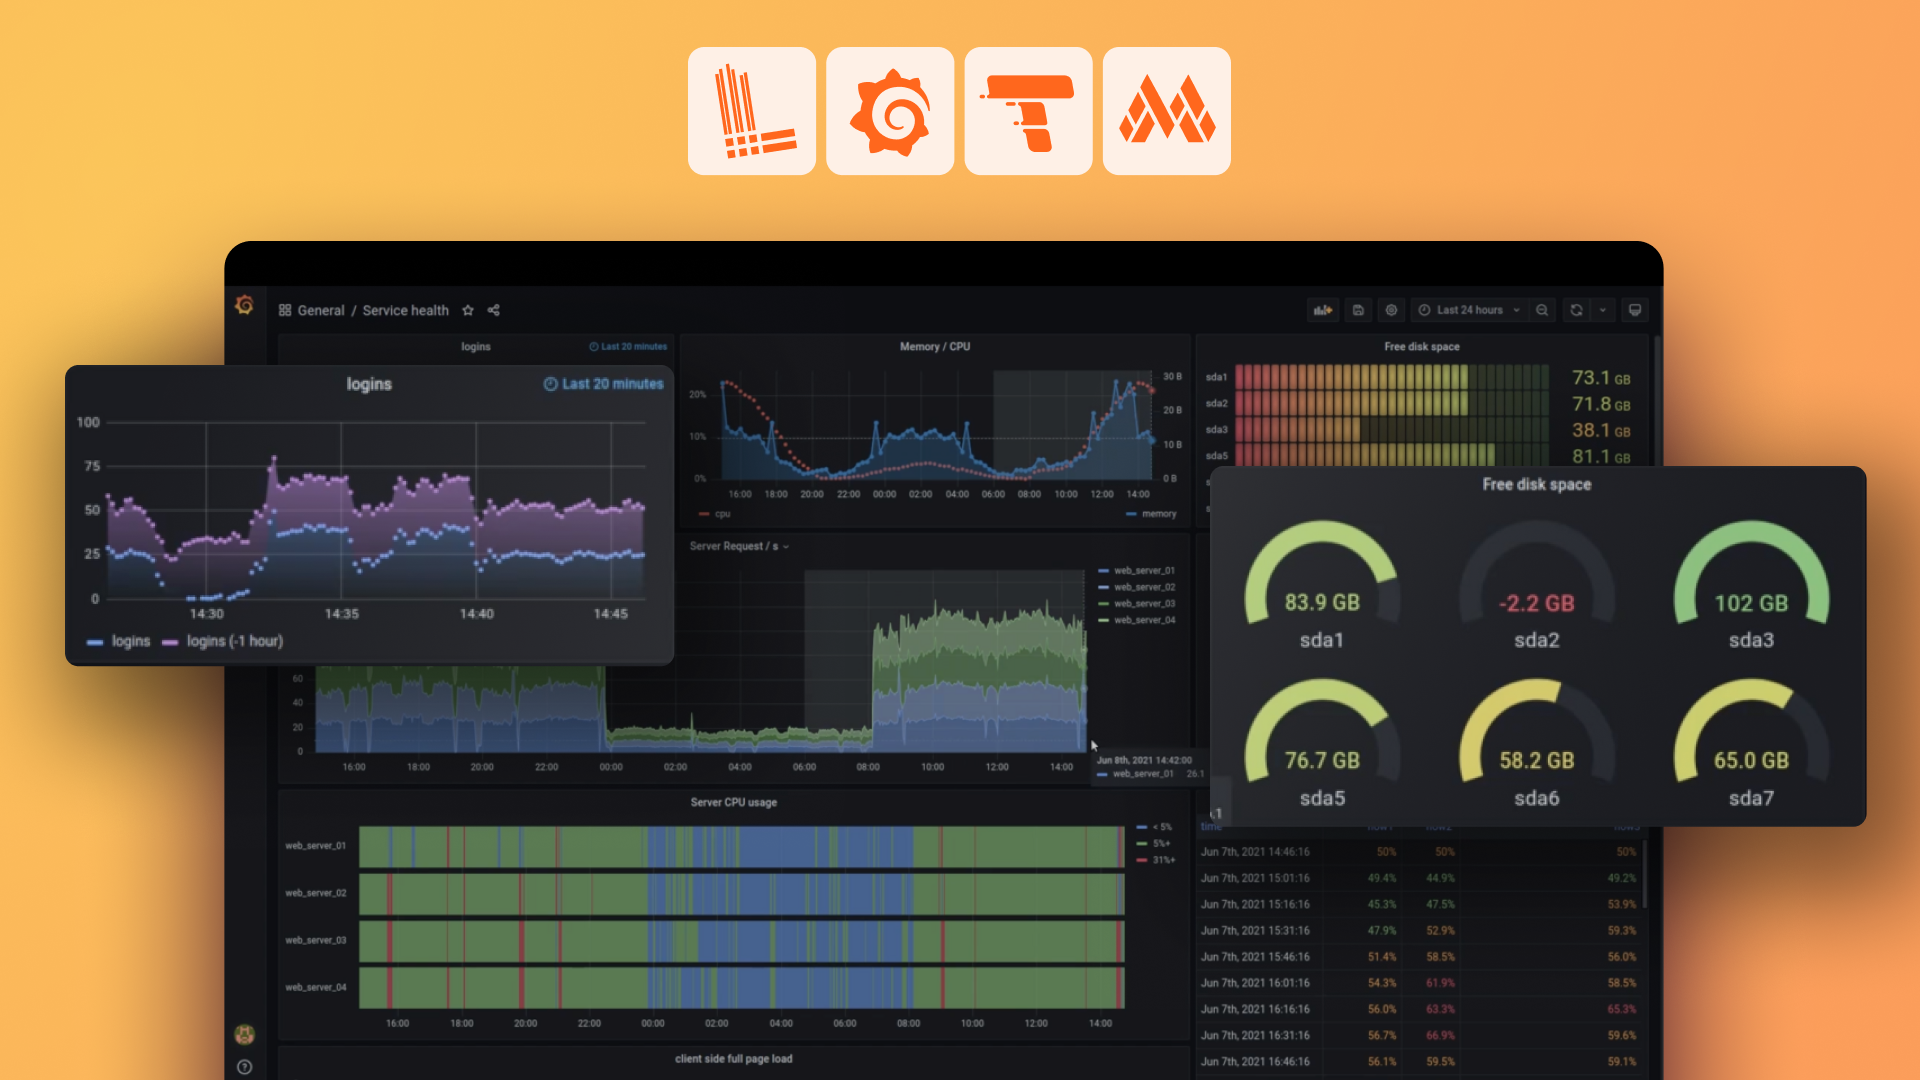
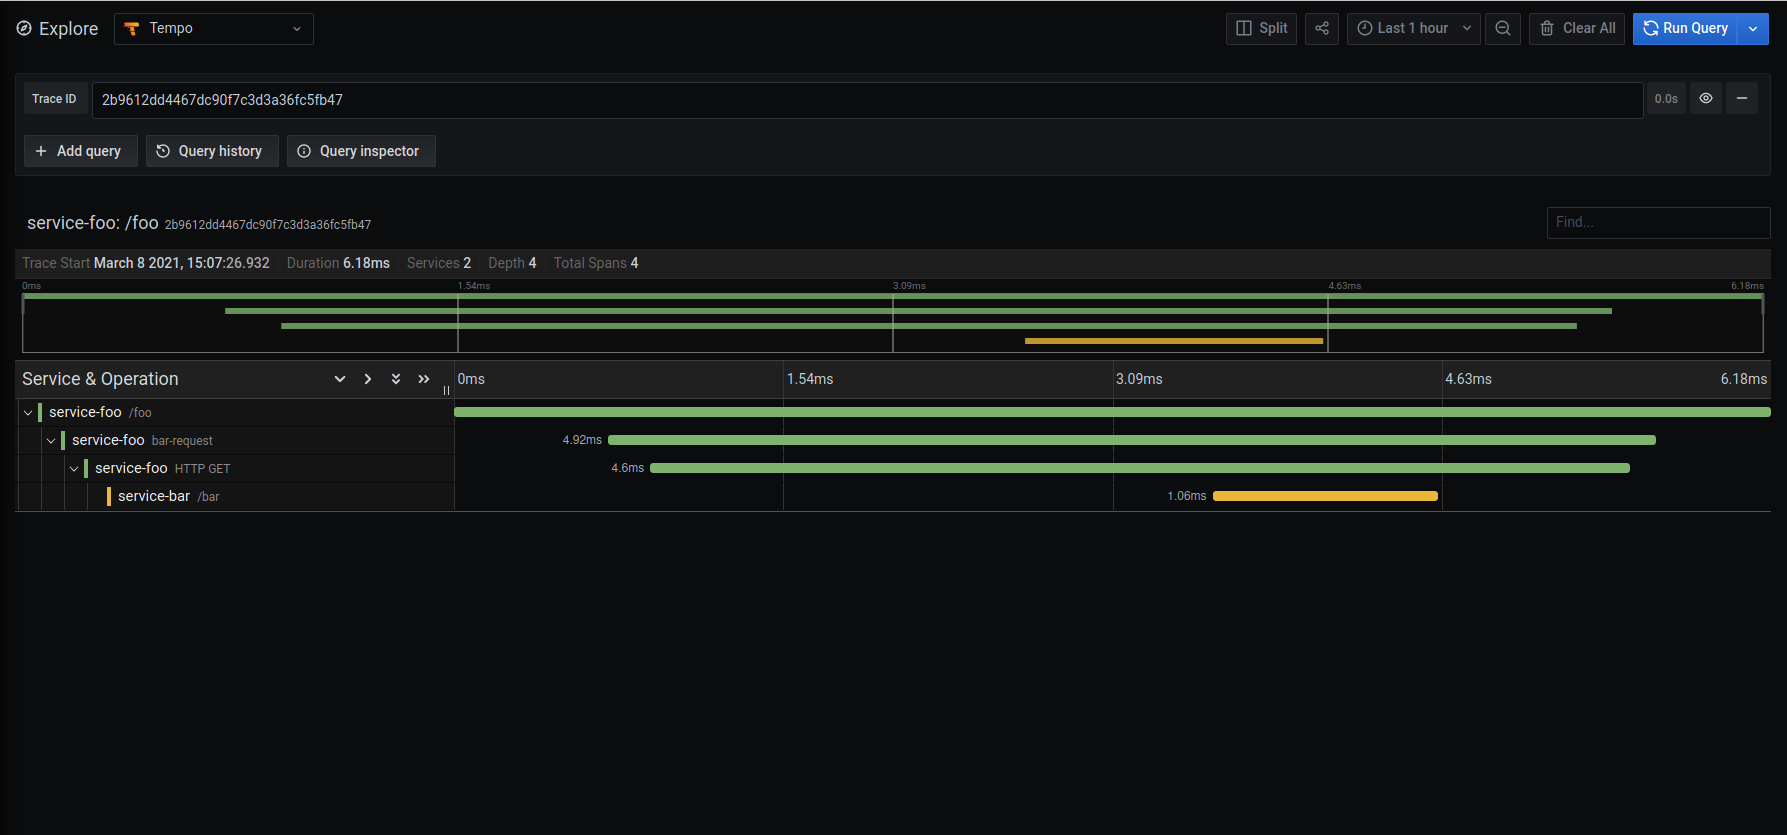
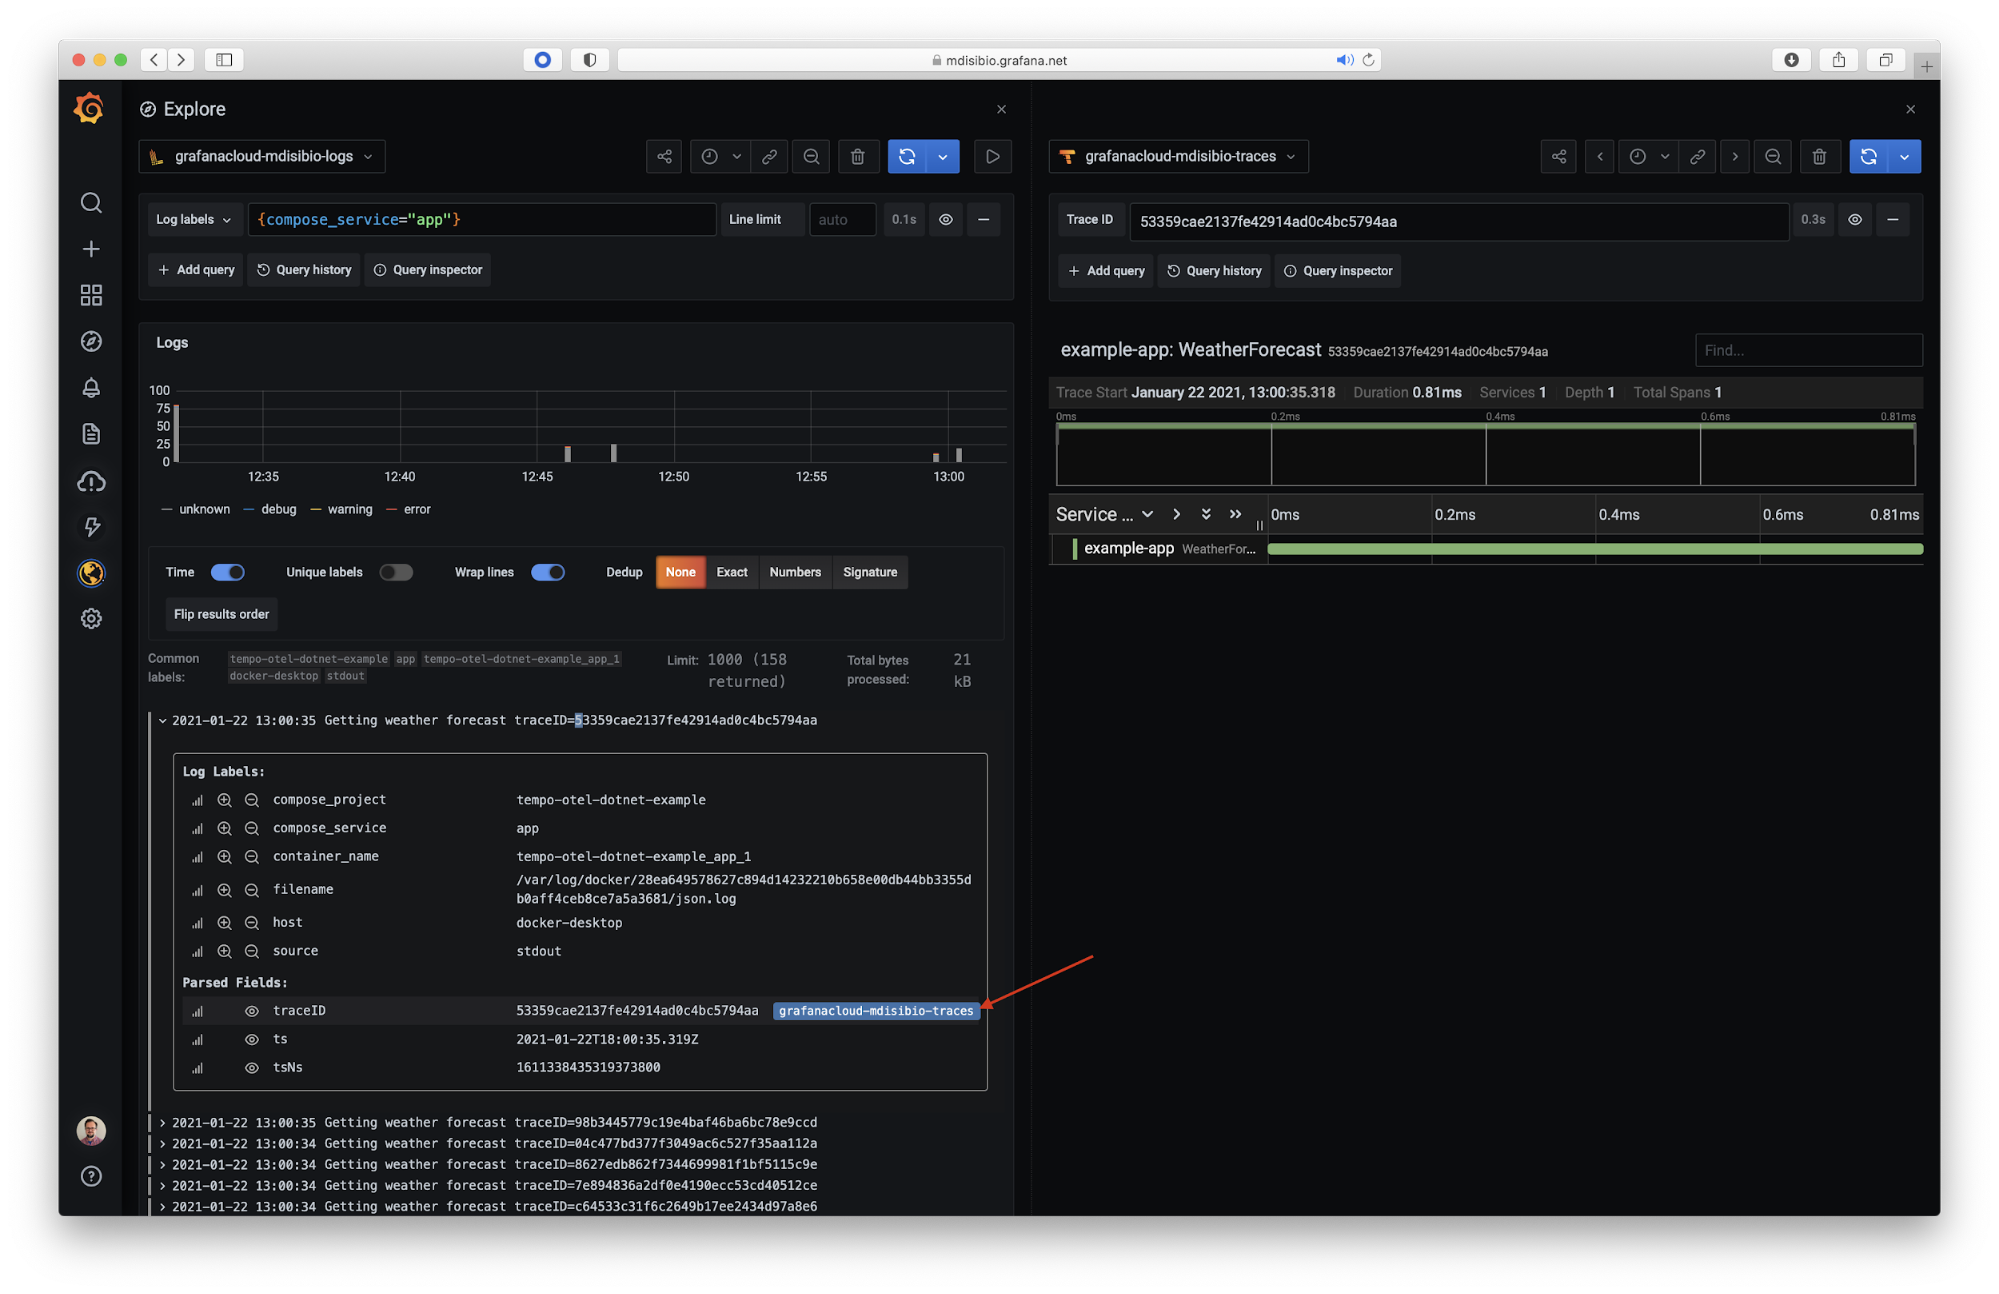
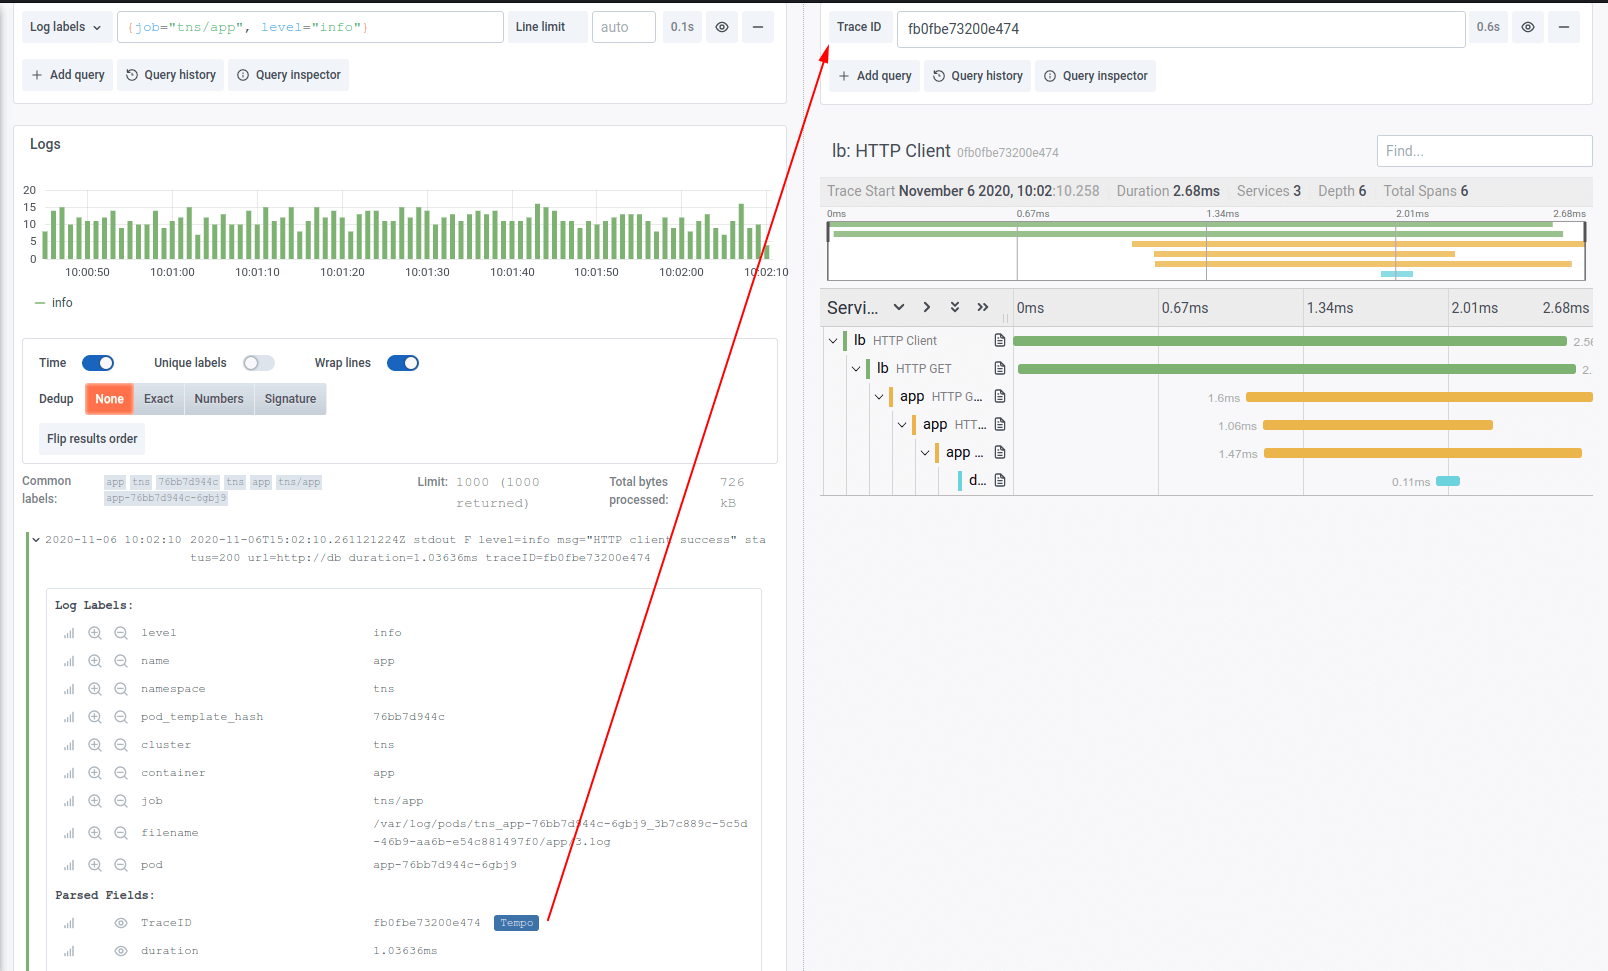
All
Products
Core LGTM Stack
Logs
powered by Grafana Loki
Grafana
for visualization
Traces
powered by Grafana Tempo
Metrics
powered by Grafana Mimir and Prometheus
Expand The Stack
Plugins
Connect Grafana to data sources, apps, and more
Incident Response & Management
with Grafana Alerting, Grafana Incident, and Grafana OnCall
Performance testing
powered by Grafana k6
Deploy The Stack
Grafana Cloud
Fully managed
Grafana Enterprise
Self-managed
Pricing
Hint: It starts at FREE
Open Source
Grafana Loki
Multi-tenant log aggregation system
Query, visualize, and alert on data
Grafana Tempo
High-scale distributed tracing backend
Grafana Mimir
Scalable and performant metrics backend
Grafana OnCall
On-call management
Grafana Phlare
Scalable continuous profiling backend
Grafana Faro
Frontend application observability web SDK
Grafana Agent
Batteries-included telemetry collector
Grafana k6
Load testing for engineering teams
Prometheus
Monitor Kubernetes and cloud native
OpenTelemetry
Instrument and collect telemetry data
Graphite
Scalable monitoring for time series data
Community resources
Dashboard templates
Try out and share prebuilt visualizations
Prometheus exporters
Get your metrics into Prometheus quickly
Featured Solutions
Learn
Stay up to date
Observability Survey 2023
Key findings and results
ObservabilityCON on the Road 2023
Open source observability conference
Blog
News, releases, cool stories, and more
Events
Upcoming in-person and virtual events
Success stories
By use case, product, and industry
Technical learning
Documentation
All the docs
Webinars and videos
Demos, webinars, and feature tours
Tutorials
Step-by-step guides
Workshops
Free, in-person or online
Writers' Toolkit
Contribute to technical documentation provided by Grafana Labs
Join the community
Community forums
Ask the community for help
Community Slack
Real-time engagement
Company
Help build the future of open source observability software Open positions
Check out the open source projects we support Downloads
Get Started
Free Forever plan:
Featured
Grafana 9.0 demo video
We’ll demo all the highlights of the major release: new and updated visualizations and themes, data source improvements, and Enterprise features.
Wasssssuuup! I'm Grot. Ask me anything...
Related resources
You'll find 3 types of learning content here:
In-depth guides with step-by-step instructions
See all
How-to articles, best practices, troubleshooting, cool projects, and more from our blog
Tutorial videos created by subject-matter experts
Create complex alerts from Flux queries in the new Grafana Alerting
Grafana | Advanced
Monitor an app with Kubernetes Monitoring This tutorial shows how to deploy an instrumented three-tier (data layer, app logic layer,...
Grafana | Beginner
Get familiar with Grafana Cloud
Play with Grafana Mimir Grafana Mimir is a distributed, horizontally scalable, and highly available long term storage for Prometheus. In this...
Grafana Mimir | Beginner
Get familiar with Grafana
Learn how to set up teams and users.
Treat your configuration as code.
Learn how to create a custom visualization for your dashboards.
Learn how to use D3.js in your panel plugins.
Create a plugin to add support for your own data sources.
Create a backend for your data source plugin.
Create a backend for your data source plugin with streaming capabilities.
Use Telegraf to stream live metrics to Grafana.
Get Grafana set up on your Raspberry Pi.
Learn how to integrate Hubot with Grafana
Learn how to run Grafana behind a reverse proxy
Learn how to set up Grafana behind IIS with URL Rewrite.
A step-by-step tutorial on how to use the new simple, scalable deployment in Loki and Grafana Enterprise Logs.
Grafana Loki | Beginner
Learn how tracing, one of the pillars of observability, helps us deduce what’s happening in an application — and get a step-by-step demo of how...
Grafana Tempo | Beginner
We helped a power user remove the need for 18,000 individual rules using PromQL joins. Here’s how.
Prometheus | Intermediate
A complete guide to building an observability meme that's never gonna let you down.
Prometheus | Grafana | Intermediate
Learn how to monitor your environment with IoT sensors and quickly get insights from Grafana dashboards.
Grafana | Prometheus | Intermediate
A step-by-step guide to using Grafana and BigQuery to create cohort tables that can improve your business.
Grafana | Intermediate
With Tanka inline environments, we solved the problems of configuration drift and bootstrapping new Tanka environments and new clusters.
Tanka | Intermediate
We’ve recently released a new set of commands that makes it easy to identify and remove unused metrics to help manage costs.
In this guest blog, Amnon Heiman writes about how Loki 2.0 can help any system built on Prometheus overcome the cardinality problem.
Grafana Loki | Intermediate
Using a webhook, you can set your Hue Bridge to turn on bright red lights when it receives an alert notification.
Graphite syntax for queries is different compared to Loki — but not impossible to transform thanks to label mapping.
Graphite | Grafana Loki | Intermediate
To capitalize or not to capitalize? Not to worry. Here's an easy solution to run a case-insensitive search in Loki.
Foobar is a small microservices application that contains all the things that you need to get started with distributed tracing.
Grafana Tempo | Intermediate
If you checked out our webinar on Grafana Cloud and Raspberry Pis and want another project idea, this simple step-by-step guide will help you...
Follow this guide to learn how to upload traces to Grafana Cloud using the open source OpenTelemetry Collector.
A breakdown of all the metrics and configurations that can help you diagnose a remote write issue in Prometheus.
This simple demo shows how easy it has become to get data out of complicated and highly specialized systems and into Prometheus and Grafana,...
This how-to shows that it doesn’t have to be difficult or complicated to create a monitoring system for basically any IoT project.
A step-by-step guide to running Grafana on a Windows PC using the Linux runtime environment.
Follow the tips in this guide to secure the reliability of Loki’s write path and ensure that no logs are left behind.
Follow this step-by-step guide to using the OpenTelemetry .NET library to offload traces to Tempo and logs to Loki — and connect them in Grafana...
Grafana Tempo | Grafana | Intermediate
Learn how to set up monitoring for an internet router running the open source Linux operating system OpenWrt.
There is an enormous amount of interest from the community in Java auto-instrumentation, so Tempo creator Joe Elliott set out to determine what...
Here’s a step-by-step guide to setting up monitoring for your Raspberry Pi project on Grafana Cloud.
Add some extra polish to your plugin before you submit it to the Grafana plugin page.
With Grafana Cloud integrations, you will have a Prometheus- and Grafana-based observability stack, including preconfigured dashboards and...
Grafana | Prometheus | Grafana Loki | Grafana Tempo | Intermediate
Learn how range vector operations, combined with LogQL parsers and unwrapped expressions, can provide a new set of metrics in Loki.
Learn Prometheus with simple projects that can be monitored with Prometheus and visualized in Grafana.
Prometheus | Beginner
Watch this 3-minute video to learn how to use Loki’s log filtering capabilities for forensic troubleshooting.
By using raw strings, escaping special characters in Loki can be much easier
In the first of a series of how-to posts, Loki maintainer Cyril Tovena shares tips for filtering logs effectively with LogQL.
Here's how to use Elasticsearch for trace discovery in Tempo, a fantastic new tool for mass trace ingestion.
In this guest blog, get the step-by-step instructions to set up monitoring for the expiration date of certificates.
Here's your starter guide to configuring the Grafana Agent to collect traces and ship them to Tempo, our new distributed tracing system.
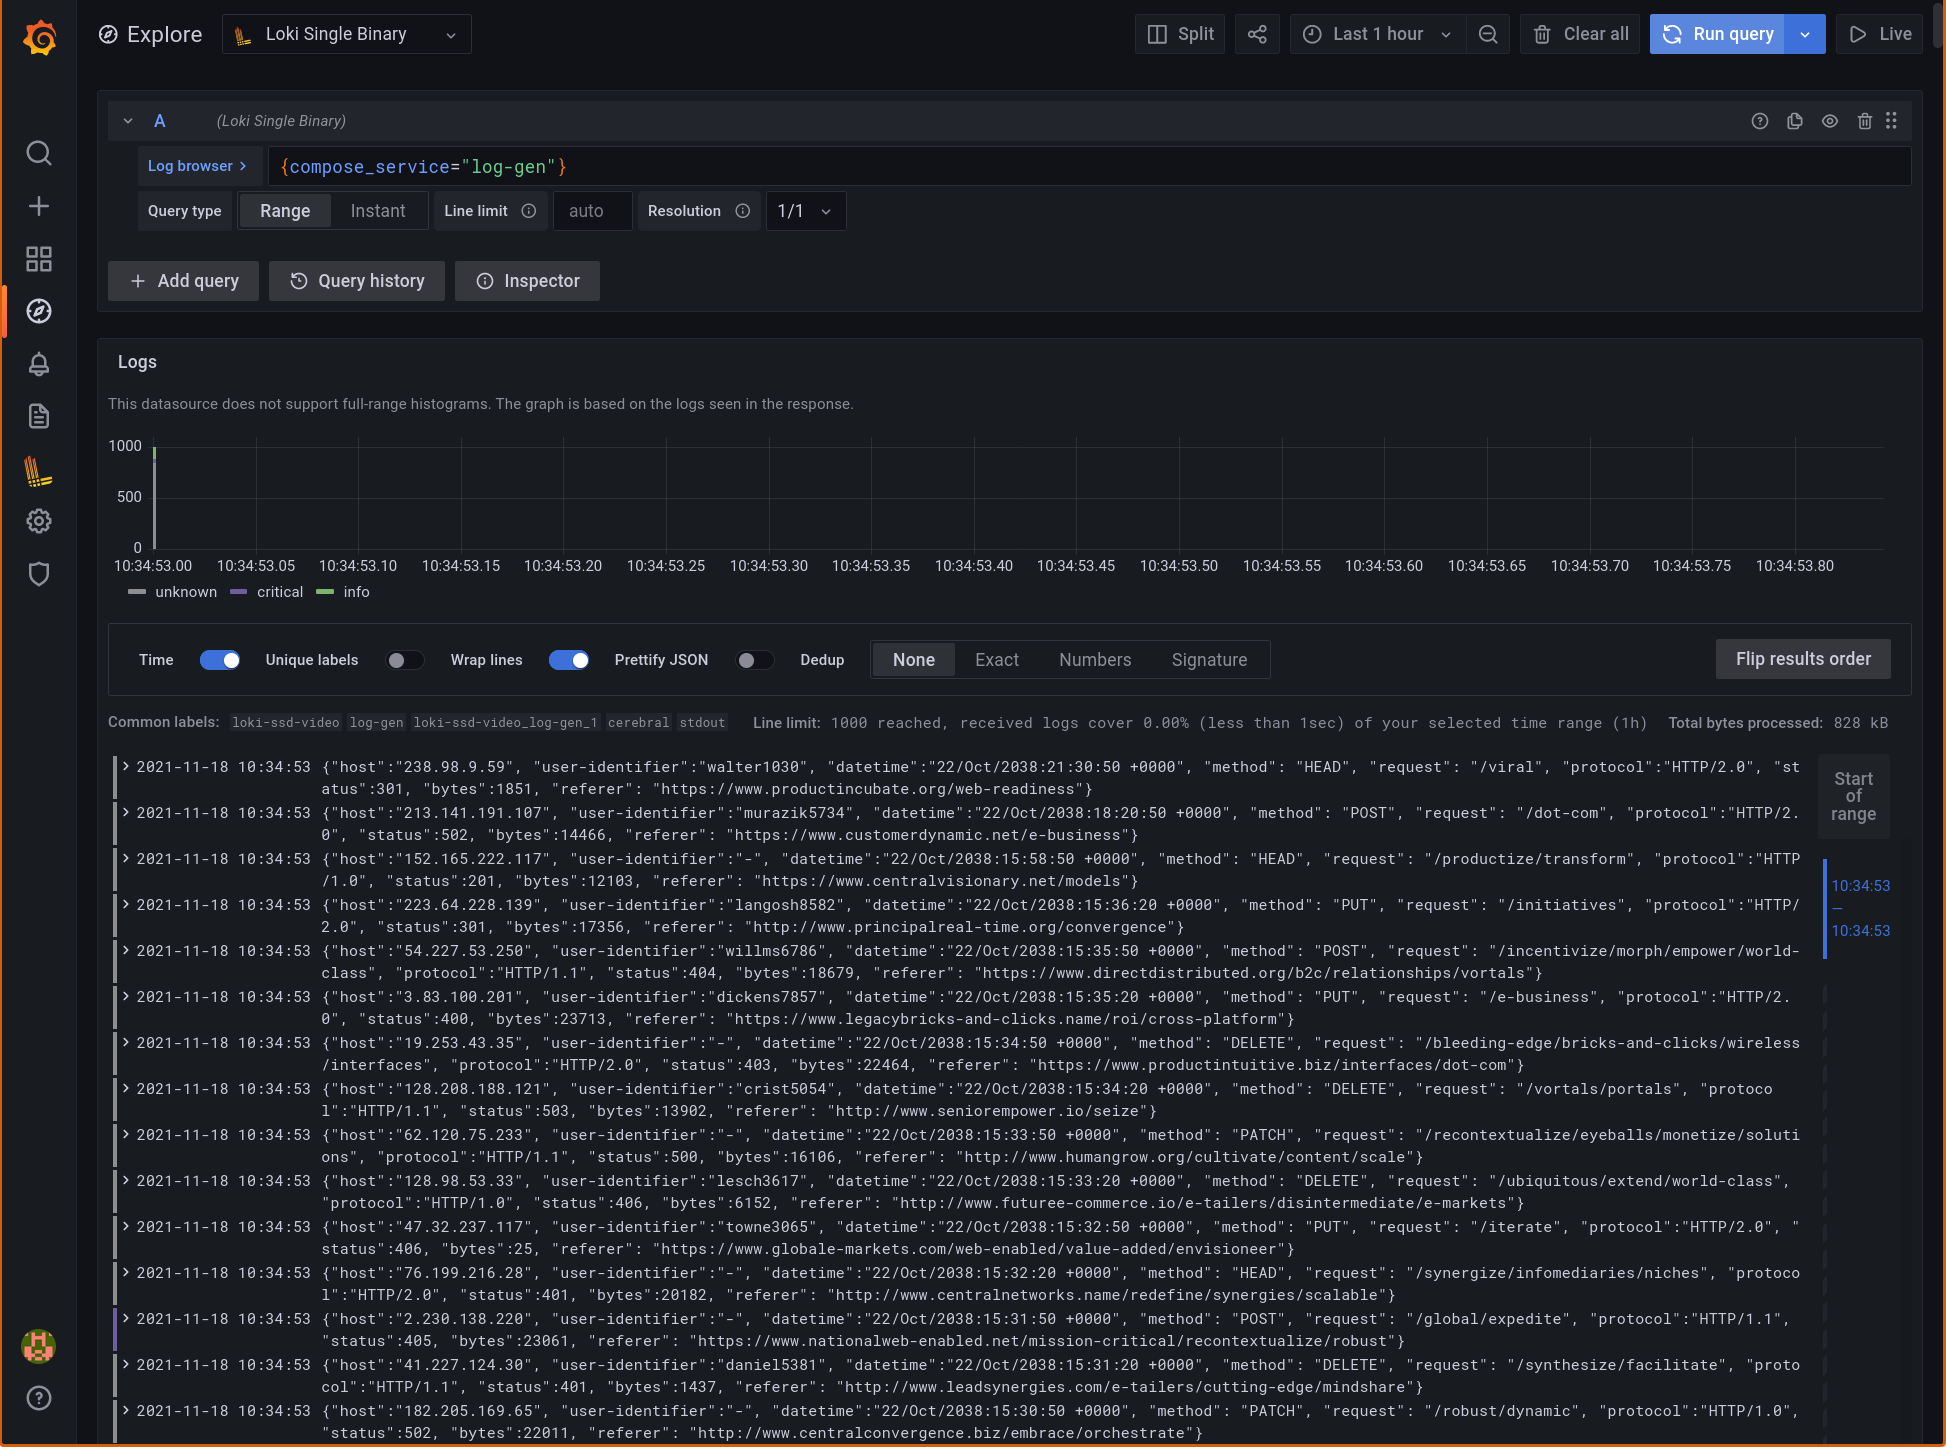
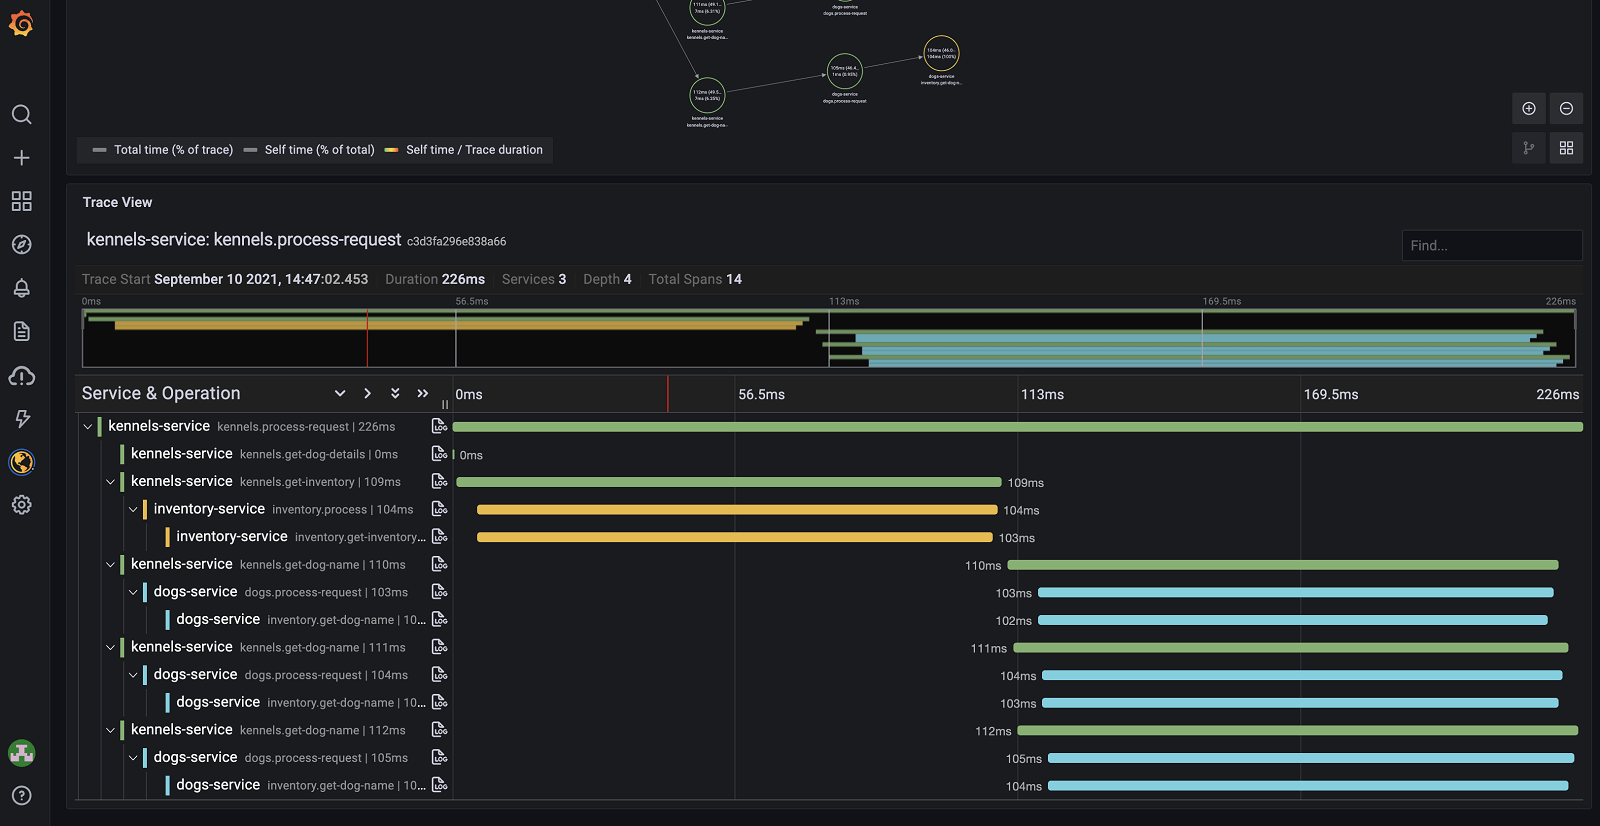
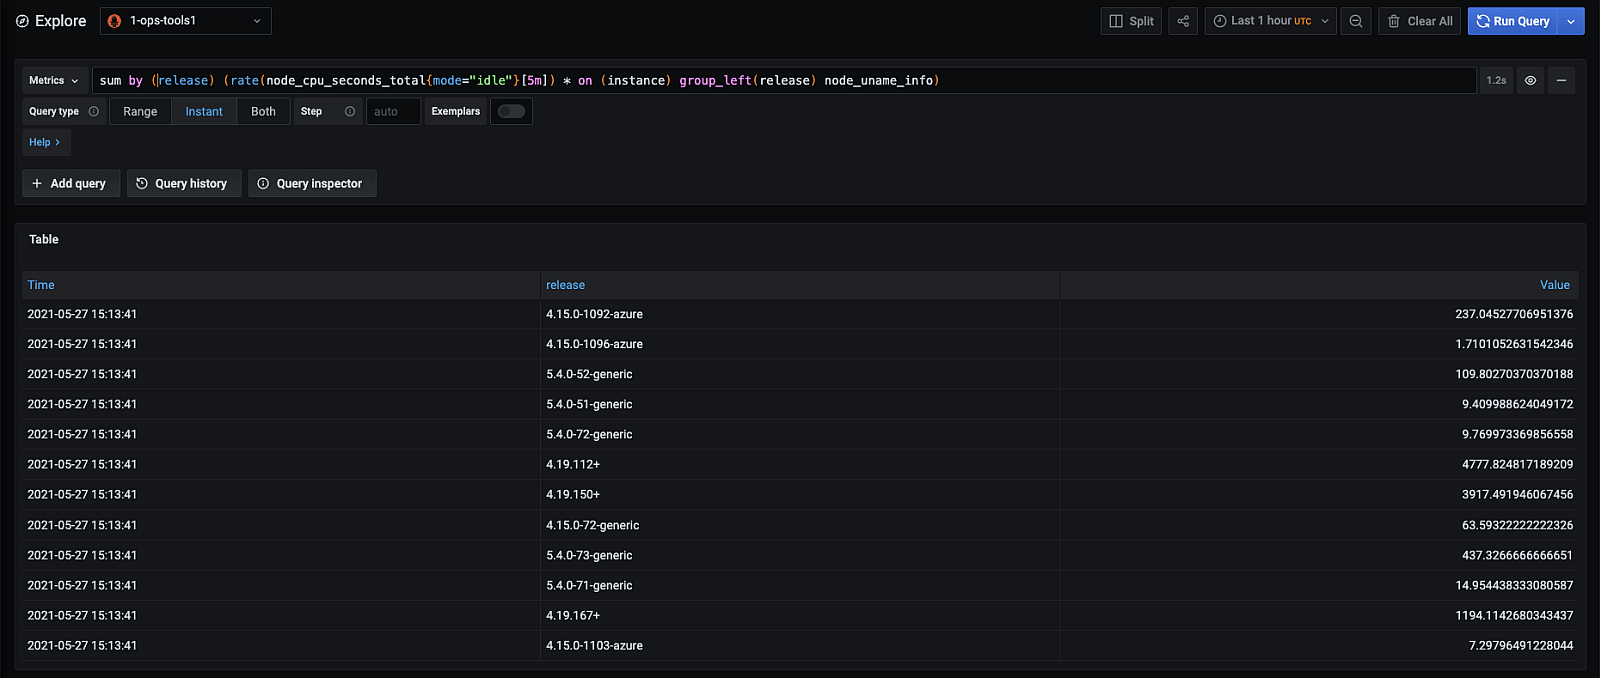
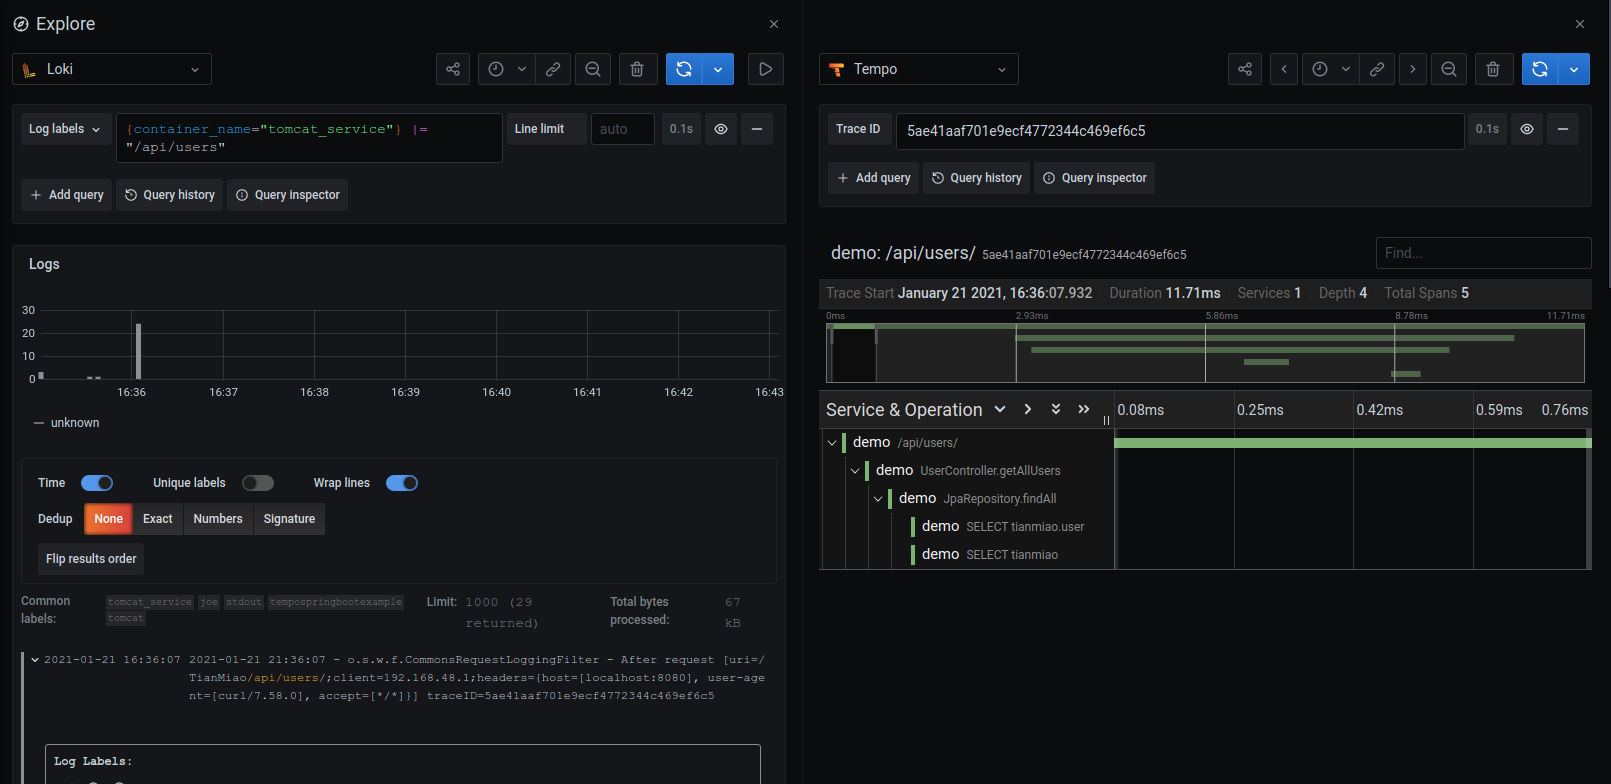
In this blog, we’ll explain how to use other data sources for trace discovery in Grafana Tempo, our new distributed tracing backend.
Grafana Tempo | Prometheus | Grafana Loki | Intermediate
Check out the latest in Developer Advocate Marcus Olsson's series of quick tips on how to get the most out of Grafana.
In this guest blog post, Jonathan Stines shares his journey down the rabbit hole of monitoring dashboards for his 3D printer.
UX designer Jessica Müller offers some easy fixes for better dashboard design.
A complete guide to forwarding logs and workload metadata from Amazon's Elastic Container Service to Loki. The result? All your logs can be...
In this post, we'll show how to ship Graphite metrics into Grafana's managed metric offering, Grafana Cloud.
Graphite | Grafana | Intermediate
If you're using Amazon Elastic Kubernetes Service, this setup will allow you to query all your logs in one place.
Grafana Loki | Grafana | Intermediate
Amazon's EC2 is one of the most popular ways to run applications in the cloud. Here's how to set up Promtail to send logs to Loki and gain...
For a new Jaeger operator a very common challenge is determining where spans are being dropped in the ingestion pipeline. This post covers the...
| Intermediate
We've created a remote_write-focused version of a Prometheus agent. Here's why you should use it if you’re running Prometheus at scale.
Grafana Labs solutions engineer Ronald McCollam explains how to convert metrics from a Java application into a format that Prometheus can...
Grafana 7.0's Plugins Platform makes building high-quality plugins easier and faster than ever. In this tutorial, Grafana Labs developer...
Learn how to turn a Prometheus histogram into a stat panel, bar gauge, or heat map in Grafana
Jumping on the bread making trend? Grafana Labs junior developer Ivana Huckova shares how she built a sourdough starter monitoring system that...
In this tutorial, you'll learn about the Grafana feature that allows you to dynamically add and remove entire panels.
Now it's easier than ever to create an application dashboard made only with logs.
A customer asked for a dashboard with a simple search for labels already pre-set to help teams quickly find what they are looking for while...
Grafana Loki | Prometheus | Grafana | Intermediate
Why on earth would you need another Y axis? In this post you'll learn about dual axis graphs in Grafana and when you should use them.
Learn how to easily track certificate expirations using Prometheus and Grafana.
At FOSDEM 2020, Malcolm Holmes and Julien Pivotto discussed creating fully reproducible Grafana dashboards using Grafonnet -— and why it leads...
Here’s how to get started with Prometheus Alertmanager and set up alert notifications with some popular methods and apps.
You've installed monitoring to your Kubernetes cluster using the Prometheus-Ksonnet library. Now learn how to connect your cluster to Grafana...
Check out this how-to for setting up monitoring in your Kubernetes cluster with Tanka and the Prometheus-Ksonnet library.
Tanka | Prometheus | Intermediate
Interested in learning about PromQL? Here’s an introductory tutorial.
Grafana uses sqlite3 as the default configuration database. Here’s a look at how to migrate your configuration to a different database if you...
Did you know you can use links to navigate between commonly used dashboards? Here’s how.
Stitch together automatic annotations with the help of Grafana, Loki, and kubernetes-diff-logger.
Here are some easy and fast projects to help you explore Prometheus.
In his KubeCon talk, Björn “Beorn” Rabenstein demonstrated how to set latency-based SLOs so that they can be used for error budgets and the...
At KubeCon in San Diego, Grafana Labs backend engineer Joe Elliott revealed his tricks to debugging applications from a Kubernetes sidecar.
At InfluxDays San Francisco, Ryan McKinley demonstrated how to stream sensor data using Grafana and InfluxDB.
This personal home dashboard looks cool -- but it also allows you to make informed decisions throughout the day, says guest blogger Cameron...
A look at how Grafana Labs uses Grafana, Prometheus, Loki, Jaeger, and monitoring mixins for infrastructure monitoring.
A rare problem with a self-referencing variable caused a customer's dashboard to break. Here's how to salvage the situation.
VP of Product Tom Wilkie demos how to accelerate Prometheus queries from four seconds to less than 100 milliseconds.
A guide to using Loki with Prometheus and Grafana to visualize the OSSEC security application, all running on a Raspberry Pi
A customer asked how to translate an esoteric ID or serial number into an user-friendly name in Grafana. Here’s our answer.
VictorOps' Melanie Postma on how teams can leverage VictorOps and Grafana dashboards to reduce MTTR.
At InfluxDays, Grafana Labs' David Kaltschmidt showed how Grafana's Explore feature allows users to visualize metrics and logs using Influx....
Monitoring synthetic metrics can optimize the user experience on your application. Here's how Grafana makes that easier
Here are six lessons from Icinga CPO Blerim Sheqa for successful visualization.
TimescaleDB's Diana Hsieh makes a convincing case for using SQL in time series monitoring.
Your monitoring stack should not cost you stacks. At GrafanaCon, Sensu Software Engineer Nikki Attea demonstrated one effective way to collect...
A customer asked for advice about whether to use a containerized Prometheus environment or a VM-based one. We thought we’d share our answer here...
A very useful feature of Grafana is the ability to display dashboards and playlists on a large TV.
When an executive sees a Grafana dashboard and asks, 'What does this really mean for business?' Percona CEO Peter Zaitsev shows you how to...
In this installment of the grafana-polystat-panel plugin tutorial, we look at rolling up multiple Cassandra clusters and tying together multiple...
Polystat The grafana-polystat-panel plugin was created to provide a way to roll up multiple metrics and implement flexible drilldowns to other...
In this blog post we will go through how you can create plugins for Grafana using ReactJS.
At Grafana Labs, we believe that users should have the freedom to use the tools they know and love. In this webinar, we’ll talk about taking...
Compared to worldPing, Synthetic Monitoring is more intuitive, easier to use, and allows users to observe how systems and applications are...
Grafana has become the world’s most popular technology used to compose observability dashboards with everything from Prometheus & Graphite...
Machine learning has the potential to give engineers new ways to understand data. Unlike people, machines can consistently monitor and analyze...
Three Ozark IC ultraviolet (UV) detector modules were installed on the International Space Station (ISS) in January 2019 on Alpha Space Test...
Grafana 8.0 is here! The Grafana team will demo all the highlights of the latest major release: new and updated visualizations and themes, data...
Plugins allow users to extend and customize their Grafana experience with their choice of data sources, dashboards, and apps. But what makes a...
In this session, we’ll cover recent development in Prometheus and Cortex, including features such as histograms, remote_write, and exemplars....
Prometheus | Cortex | Beginner
In this advanced session, we’ve gathered some Grafanistas to share their expertise to help you uplevel your use of Grafana. CTO and Co-founder...
Grafana Tempo, our open source, easy-to-use, high scale distributed tracing backend, was announced at ObservabilityCON last October. In this...
Core to getting started with the Grafana LGTM Stack is unraveling the concept of a centralized observability strategy to support modern...
Grafana | Grafana Loki | Grafana Mimir | Grafana Tempo | Beginner
Have you finished experimenting with your first dashboard and are looking to build your first production dashboard? Or perhaps you’re...
From a quick glance, it might seem that IoT is hard. After all, if it wasn’t, everyone would be doing it, right? Join Grafanistas and homelab...
We’re kicking off IoT day at GrafanaCONline with a showcase of the exciting changes we’ve been making in Grafana to support industrial/IoT use...
Prometheus offers some of the most powerful alerting capabilities available. A single, consistent alerting rule can generate multiple...
Grafana | Prometheus | Beginner
Two and a half years since it was launched, Grafana Loki is making it easy to aggregate logs cost-efficiently at cloud native scale. The Loki...
In this webinar, we’ll give you a walkthrough and introduction of the Grafana 8 unified alerting system that was announced at GrafanaCONline....
Would you like to have insight into how your development team is functioning without having to micromanage operations? Do you ever wonder what...