
Microsoft SQL Server integration for Grafana Cloud
Microsoft SQL Server is a relational database that can be used to store and retrieve data. The Microsoft SQL Server integration uses Grafana Alloy to collect metrics for monitoring a MSSQL instance, including aspects such as active connections, read/write latency, buffer cache hit rate, and page faults. Accompanying dashboards are provided to visualize these metrics, as well as recommended alerting policies.
This integration supports SQL Server 2017, SQL Server 2019, and SQL Server 2022.
This integration includes 5 useful alerts and 2 pre-built dashboards to help monitor and visualize Microsoft SQL Server metrics and logs.
Before you begin
In order to scrape Microsoft SQL Server metrics, you must have a user configured with the following grants:
GRANT VIEW ANY DEFINITION TO <MONITOR_USER>;
GRANT VIEW SERVER STATE TO <MONITOR_USER>;
Install Microsoft SQL Server integration for Grafana Cloud
- In your Grafana Cloud stack, click Connections in the left-hand menu.
- Find Microsoft SQL Server and click its tile to open the integration.
- Review the prerequisites in the Configuration Details tab and set up Grafana Alloy to send Microsoft SQL Server metrics and logs to your Grafana Cloud instance.
- Click Install to add this integration’s pre-built dashboards and alerts to your Grafana Cloud instance, and you can start monitoring your Microsoft SQL Server setup.
Configuration snippets for Grafana Alloy
Simple mode
These snippets are configured to scrape a single Microsoft SQL Server instance running locally with default ports.
First, manually copy and append the following snippets into your alloy configuration file.
Integrations snippets
prometheus.exporter.mssql "integrations_mssql" {
	connection_string = "sqlserver://user:pass@127.0.0.1:1433"
}

discovery.relabel "integrations_mssql" {
	targets = prometheus.exporter.mssql.integrations_mssql.targets

	rule {
		target_label = "instance"
		replacement  = constants.hostname
	}

	rule {
		target_label = "job"
		replacement  = "integrations/mssql"
	}
}

prometheus.scrape "integrations_mssql" {
	targets    = discovery.relabel.integrations_mssql.output
	forward_to = [prometheus.remote_write.metrics_service.receiver]
	job_name   = "integrations/mssql"
}
Logs snippets
linux
windows
Advanced mode
The following snippets provide examples to guide you through the configuration process.
To instruct Grafana Alloy to scrape your Microsoft SQL Server instances, manually copy and append the snippets to your alloy configuration file, then follow subsequent instructions.
Advanced integrations snippets
prometheus.exporter.mssql "integrations_mssql" {
	connection_string = "sqlserver://user:pass@127.0.0.1:1433"
}

discovery.relabel "integrations_mssql" {
	targets = prometheus.exporter.mssql.integrations_mssql.targets

	rule {
		target_label = "instance"
		replacement  = constants.hostname
	}

	rule {
		target_label = "job"
		replacement  = "integrations/mssql"
	}
}

prometheus.scrape "integrations_mssql" {
	targets    = discovery.relabel.integrations_mssql.output
	forward_to = [prometheus.remote_write.metrics_service.receiver]
	job_name   = "integrations/mssql"
}
This integrations uses the prometheus.exporter.mssql component to generate metrics from a Microsoft SQL Server instance.
In the Alloy configuration file a connection string with the username, password, and a host:port pair must be provided.
Also, rather than using SQL Server credentials to authenticate, it is possible to use Windows credentials by modifying the connecton_string accordingly (see the Authentication section of the Alloy MSSQL Prometheus component documentation).
The ability to pull in custom metrics (outside of the defaults) is also available for this integration. To do this, use the query_config parameter, under the integrations.mssql section of your configuration. After configuring to collect custom metrics, the default dashboards will have to be manually modified to include any reference to these new metrics.
For the full array of configuration options, refer to the prometheus.exporter.mssql component reference documentation.
This exporter must be linked with a discovery.relabel component to apply the necessary relabelings.
For each Microsoft SQL Server instance to be monitored you must create a pair of these components.
Configure the following properties within each discovery.relabel component:
instancelabel:constants.hostnamesets theinstancelabel to your Grafana Alloy server hostname. If that is not suitable, change it to a value uniquely identifies this Microsoft SQL Server instance. Make sure this label value is the same for all telemetry data collected for this instance.
You can then scrape them by including each discovery.relabel under targets within the prometheus.scrape component.
Advanced logs snippets
linux
To monitor your Microsoft SQL Server instance logs, you will use a combination of the following components:
local.file_match defines where to find the log file to be scraped. Change the following properties according to your environment:
__address__: The Microsoft SQL Server instance address__path__: The path to the log file.instancelabel:constants.hostnamesets theinstancelabel to your Grafana Alloy server hostname. If that is not suitable, change it to a value uniquely identifies this Microsoft SQL Server instance. Make sure this label value is the same for all telemetry data collected for this instance.
loki.process defines how to process logs before sending it to Loki.
loki.source.file sends logs to Loki.
windows
To monitor your Microsoft SQL Server instance logs, you will use a combination of the following components:
local.file_match defines where to find the log file to be scraped. Change the following properties according to your environment:
__address__: The Microsoft SQL Server instance address__path__: The path to the log file.instancelabel:constants.hostnamesets theinstancelabel to your Grafana Alloy server hostname. If that is not suitable, change it to a value uniquely identifies this Microsoft SQL Server instance. Make sure this label value is the same for all telemetry data collected for this instance.
loki.process defines how to process logs before sending it to Loki.
loki.source.file sends logs to Loki.
Kubernetes instructions
Before you begin with Kubernetes
Please note: These instructions assume the use of the Kubernetes Monitoring Helm chart
In order to scrape Microsoft SQL Server metrics, you must have a user configured with the following grants:
GRANT VIEW ANY DEFINITION TO <MONITOR_USER>;
GRANT VIEW SERVER STATE TO <MONITOR_USER>;
Configuration snippets for Kubernetes Helm chart
The following snippets provide examples to guide you through the configuration process.
To scrape your Microsoft SQL Server instances, manually modify your Kubernetes Monitoring Helm chart with these configuration snippets.
Replace any values between the angle brackets <> in the provided snippets with your desired configuration values.
Metrics snippets
alloy-metrics:
    extraConfig: |-
        prometheus.exporter.mssql "integrations_mssql" {
            connection_string = "sqlserver://<db_user>:<db_password>@<mssql_service>.<mssql_namespace>.svc.cluster.local:1433"
        }

        prometheus.scrape "integrations_mssql" {
            targets    = prometheus.exporter.mssql.integrations_mssql.targets
            forward_to = [prometheus.remote_write.grafana_cloud_metrics.receiver]
            job_name   = "integrations/mssql"
        }
Logs snippets
Grafana Agent static configuration (deprecated)
The following section shows configuration for running Grafana Agent in static mode which is deprecated. You should use Grafana Alloy for all new deployments.
Before you begin with Grafana Agent static
In order to scrape Microsoft SQL Server metrics, you must have a user configured with the following grants:
GRANT VIEW ANY DEFINITION TO <MONITOR_USER>;
GRANT VIEW SERVER STATE TO <MONITOR_USER>;
Install Microsoft SQL Server integration
- In your Grafana Cloud stack, click Connections in the left-hand menu.
- Find Microsoft SQL Server and click its tile to open the integration.
- Review the prerequisites in the Configuration Details tab and set up Grafana Agent to send Microsoft SQL Server metrics and logs to your Grafana Cloud instance.
- Click Install to add this integration’s pre-built dashboards and alerts to your Grafana Cloud instance, and you can start monitoring your Microsoft SQL Server setup.
Post-install configuration for the Microsoft SQL Server integration
In the agent configuration file, the agent must be provided a connection string with the username, password, and a host:port pair. To configure this, modify the connection_string in the configuration, under the integrations.mssql section.
Also, rather than using SQL Server credentials to authenticate, it is possible to use Windows credentials by modifying the connecton_string accordingly (see the Authentication section of the Grafana Agent MSSQL Integration documentation).
The ability to pull in custom metrics (outside of the defaults) is also available for this integration. To do this, use the query_config parameter, under the integrations.mssql section of your configuration. After configuring to collect custom metrics, the default dashboards will have to be manually modified to include any reference to these new metrics.
This integration supports both metrics and logs from an MSSQL instance. In order to see these signals correlated on the same dashboard, the job and instance labels must match for the metrics scrape config and the logs scrape config in the Agent configuration file (replace <your-instance-name> with an identifier for your instance):
For the logs section, you may remove the job that does not correspond to your OS (e.g. remove the integrations/mssql-linux job on Windows systems).
On Linux, you will also need to add the grafana-agent user to the mssql group to get logs:
sudo usermod -a -G mssql grafana-agentConfiguration snippets for Grafana Agent
Below integrations, insert the following lines and change the URLs according to your environment:
  mssql:
    enabled: true
    scrape_interval: 60s
    scrape_integration: true
    instance: '<your-instance-name>'
    connection_string: 'sqlserver://user:pass@127.0.0.1:1433' # replace with your connection string
Below logs.configs.scrape_configs, insert the following lines according to your environment.
Full example configuration for Grafana Agent
Refer to the following Grafana Agent configuration for a complete example that contains all the snippets used for the Microsoft SQL Server integration. This example also includes metrics that are sent to monitor your Grafana Agent instance.
Dashboards
The Microsoft SQL Server integration installs the following dashboards in your Grafana Cloud instance to help monitor your system.
- MSSQL overview
- MSSQL pages
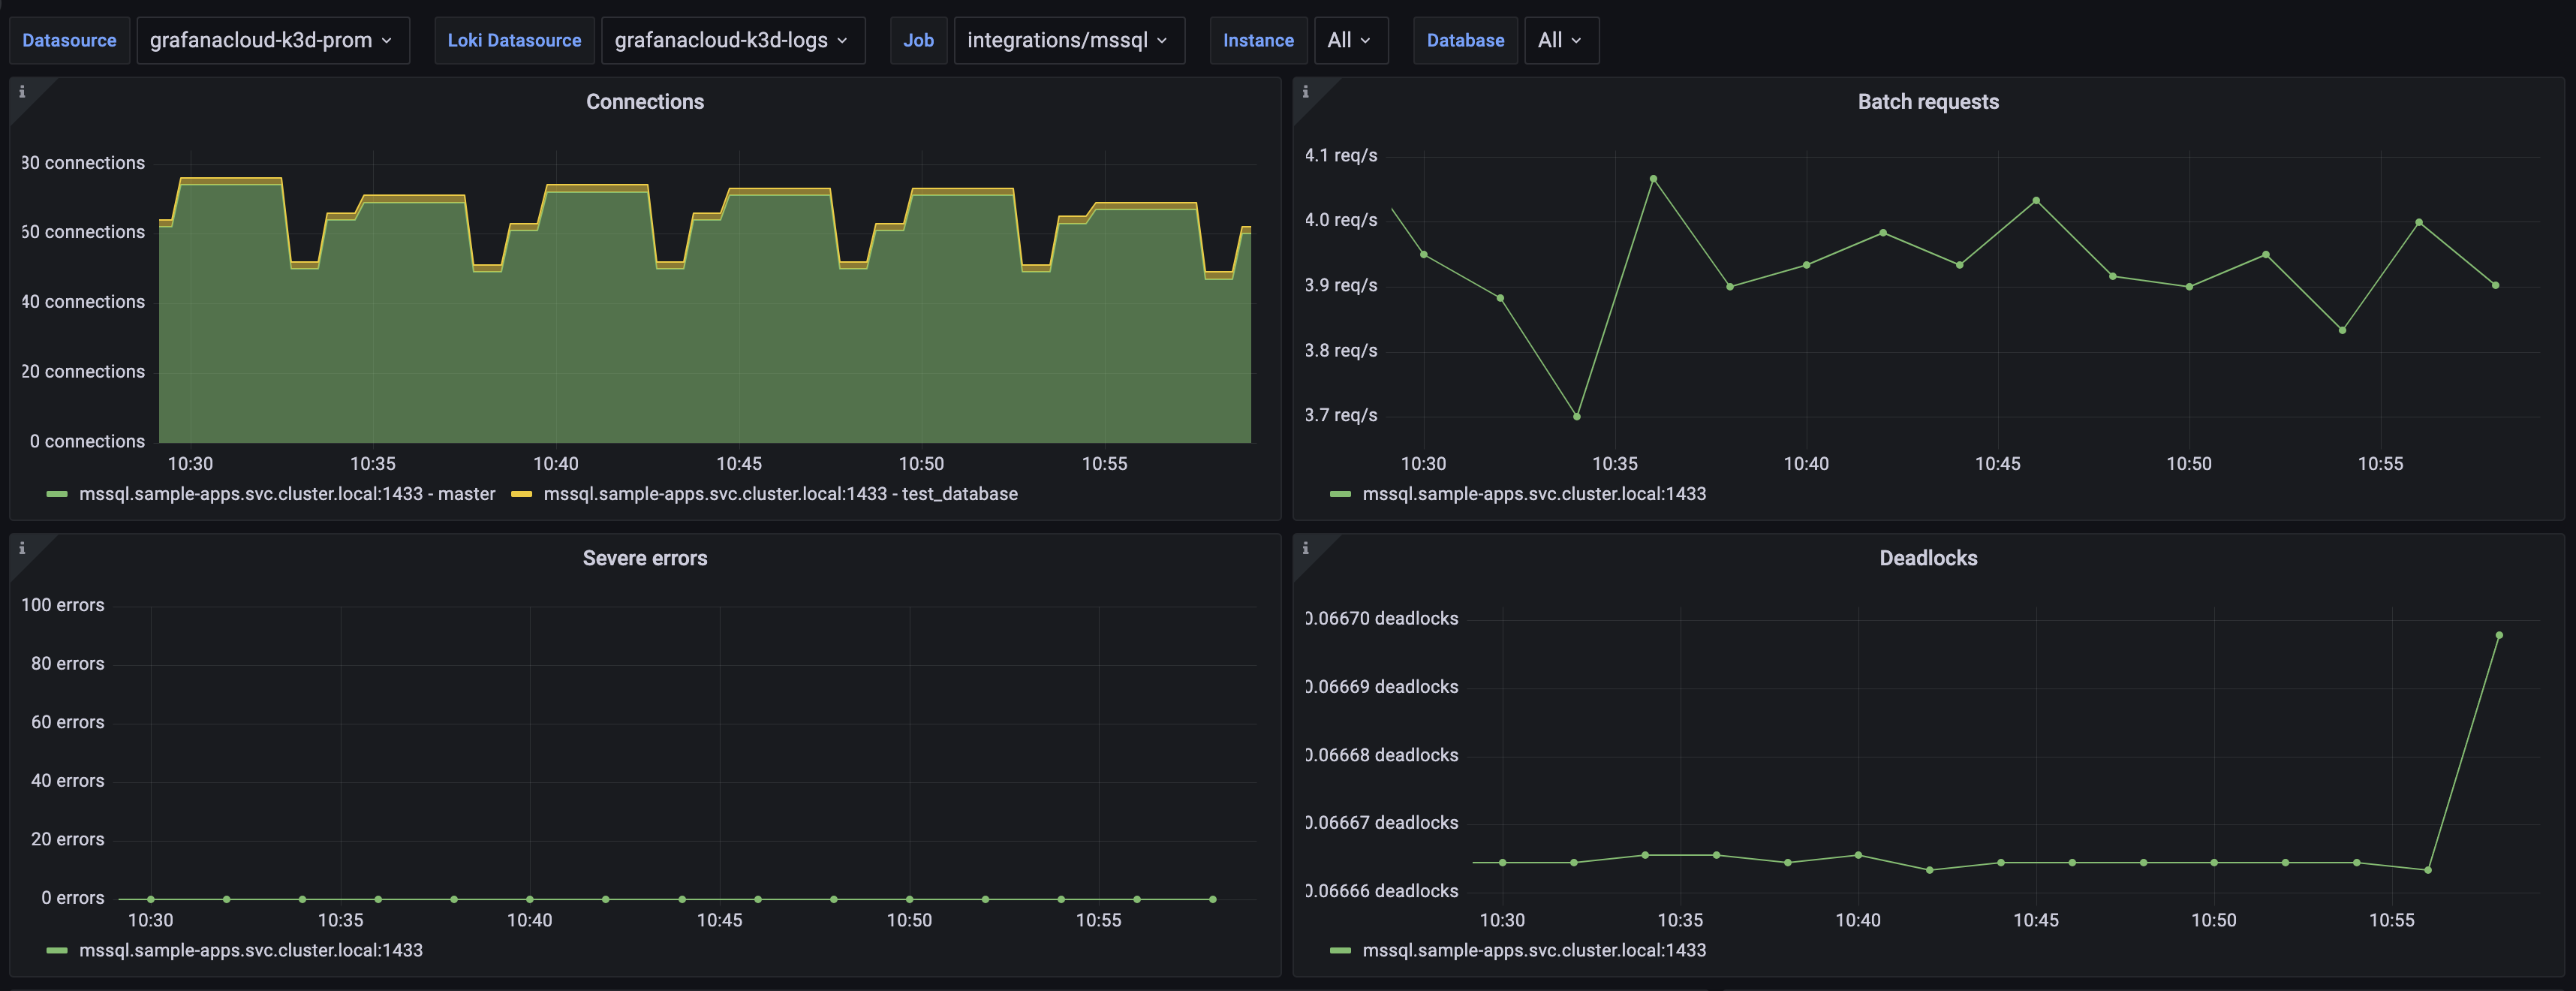
Microsoft SQL Server overview dashboard (1/3).
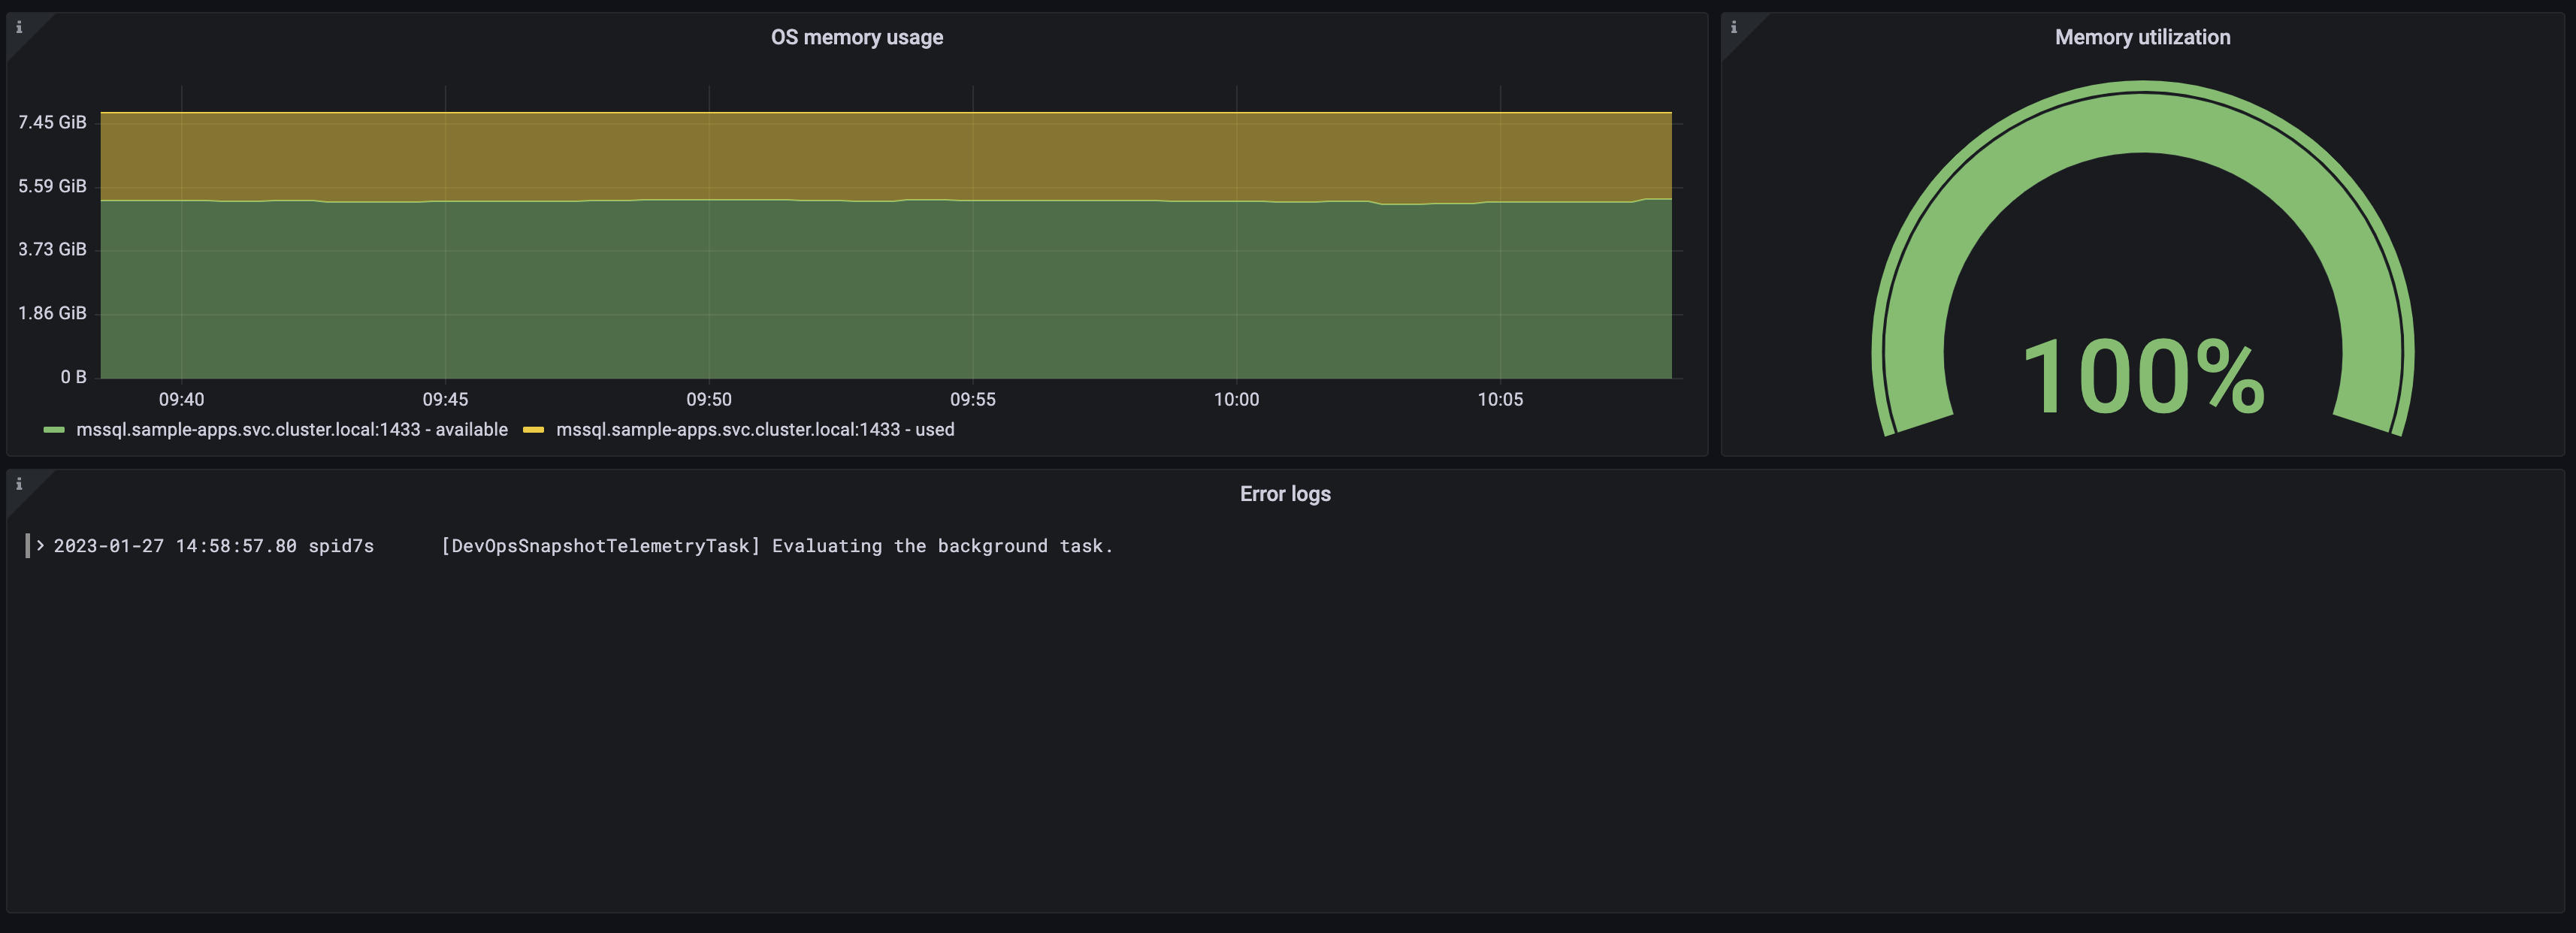
Microsoft SQL Server overview dashboard (2/3).
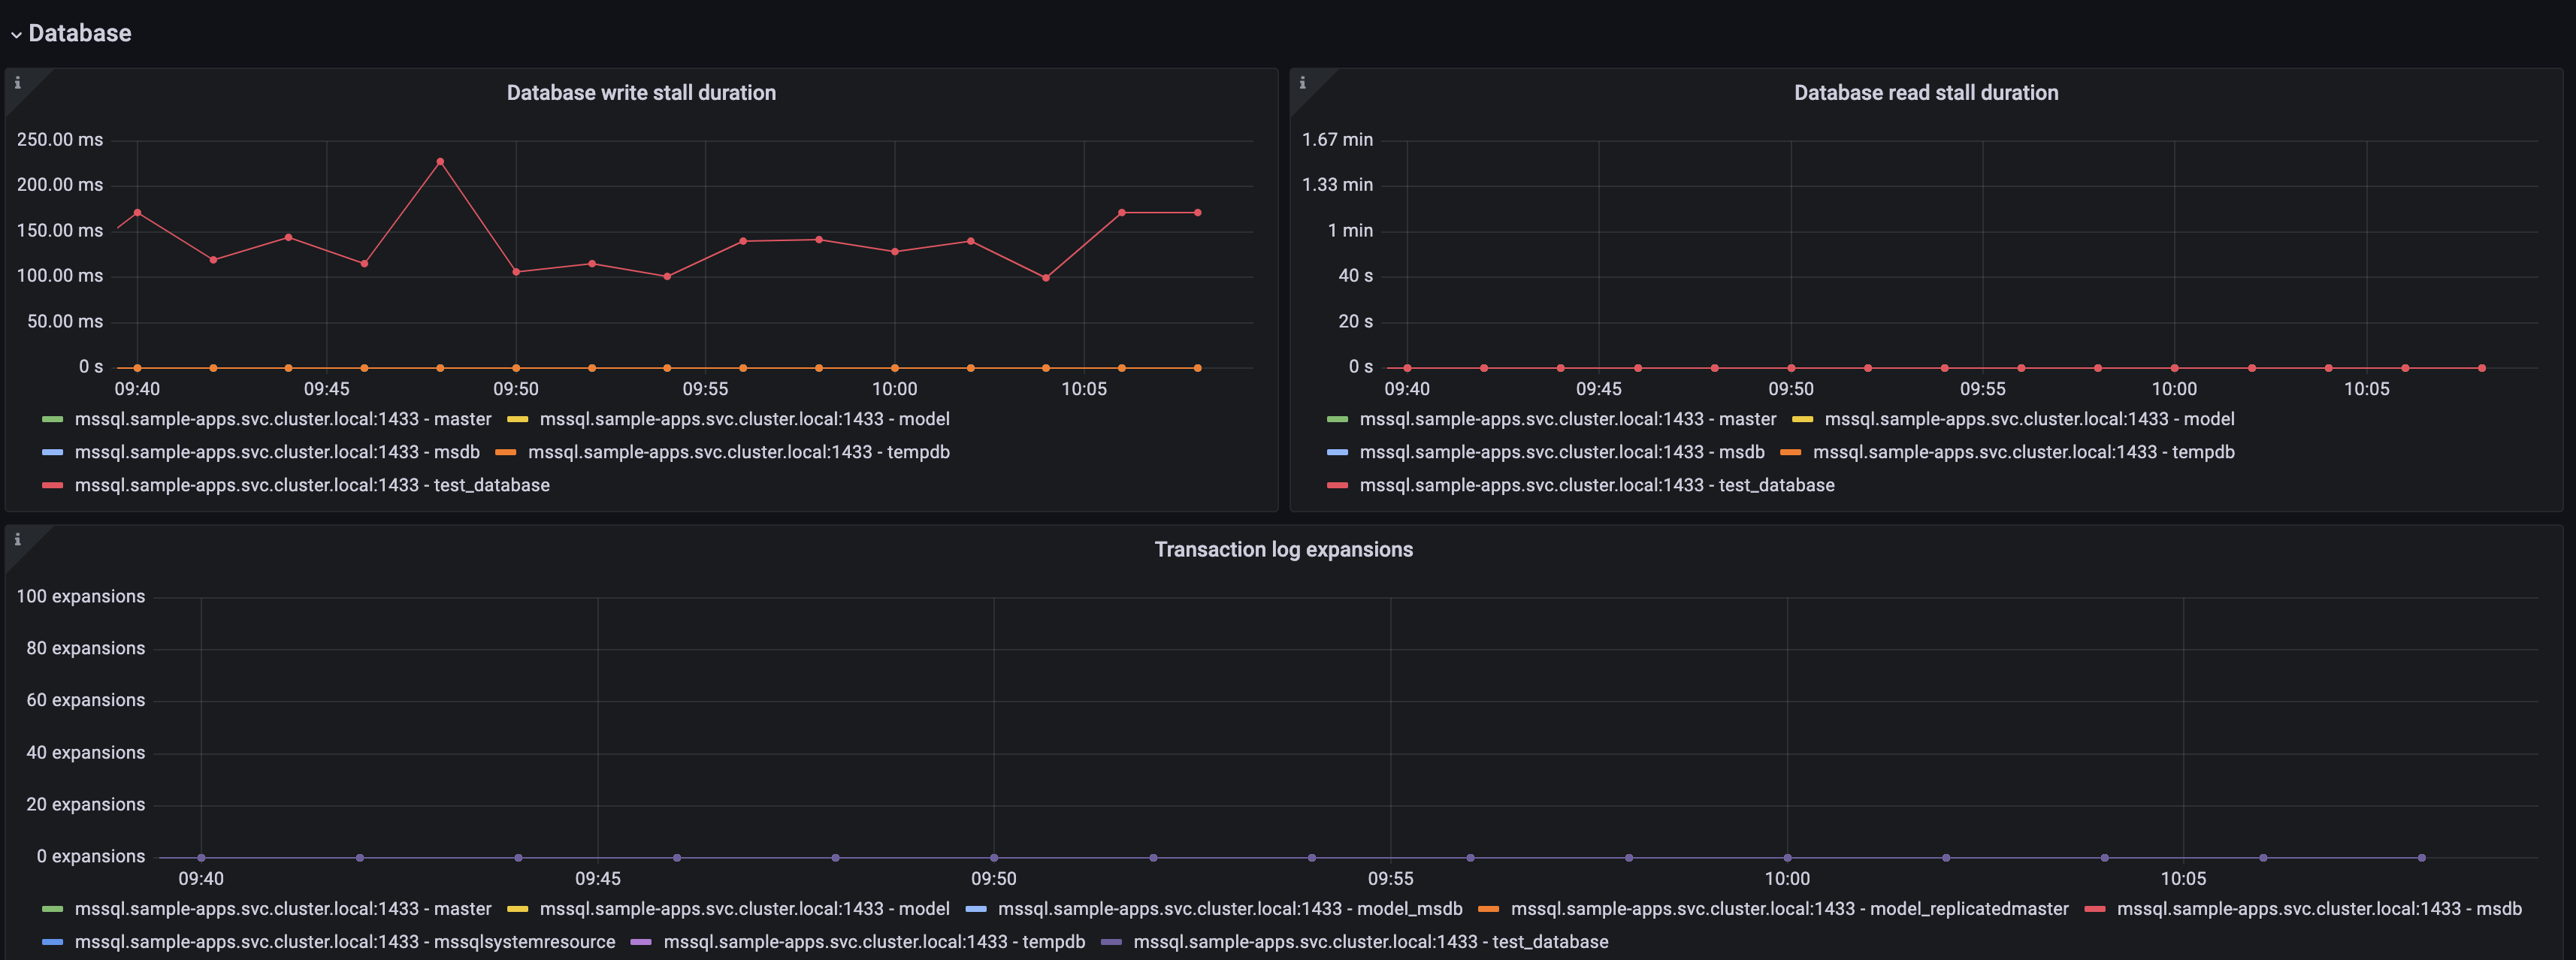
Microsoft SQL Server overview dashboard (3/3).
Alerts
The Microsoft SQL Server integration includes the following useful alerts:
Metrics
The most important metrics provided by the Microsoft SQL Server integration, which are used on the pre-built dashboards and Prometheus alerts, are as follows:
- mssql_available_commit_memory_bytes
- mssql_batch_requests_total
- mssql_buffer_cache_hit_ratio
- mssql_build_info
- mssql_checkpoint_pages_sec
- mssql_connections
- mssql_deadlocks_total
- mssql_io_stall_seconds_total
- mssql_kill_connection_errors_total
- mssql_log_growths_total
- mssql_os_memory
- mssql_os_page_file
- mssql_page_fault_count_total
- mssql_server_target_memory_bytes
- mssql_server_total_memory_bytes
- up
Changelog
Cost
By connecting your Microsoft SQL Server instance to Grafana Cloud, you might incur charges. To view information on the number of active series that your Grafana Cloud account uses for metrics included in each Cloud tier, see Active series and dpm usage and Cloud tier pricing.
Was this page helpful?
Related resources from Grafana Labs


