
Grafana Agent health integration for Grafana Cloud
The Grafana agent integration lets you monitor metrics and logs of a Grafana agent instance
This integration includes 4 useful alerts and 5 pre-built dashboards to help monitor and visualize Grafana Agent health metrics and logs.
Grafana Agent static configuration (deprecated)
The following section shows configuration for running Grafana Agent in static mode which is deprecated. You should use Grafana Alloy for all new deployments.
Before you begin with Grafana Agent static
This integration relies on metrics emitted by Grafana Agent. See the following sections for details.
Install Grafana Agent health integration
- In your Grafana Cloud stack, click Connections in the left-hand menu.
- Find Grafana Agent health and click its tile to open the integration.
- Review the prerequisites in the Configuration Details tab and set up Grafana Agent to send Grafana Agent health metrics and logs to your Grafana Cloud instance.
- Click Install to add this integration’s pre-built dashboards and alerts to your Grafana Cloud instance, and you can start monitoring your Grafana Agent health setup.
Post-install configuration for the Grafana Agent health integration
This integration supports metrics and logs for Grafana Agent. In order to enable logs, journal scraping needs to be enabled for Linux, and Windows event log scraping needs to enabled for Windows. Config snippets for both are available in the next section.
If you want to see your logs and metrics correlated on your dashboards, as a single pane of glass, ensure the following:
jobandinstancelabel values must match foragentintegration andlogsscrape config in your agent configuration file.joblabel must be set tointegrations/agent(already configured in the snippets).instancelabel must be set to a value that uniquely identifies your Grafana agent node. Please replace the default hostname value according to your environment - it should be set manually. Note that if you use localhost for multiple nodes, the dashboards will not be able to filter correctly by instance.
For a full description of configuration options see grafana agent integration in Grafana Agent documentation.
Configuration snippets for Grafana Agent
This integration relies on the Agent exporter, which is provided by default (with a reduced set of metrics) when you installed Grafana Agent.
Replace the existing agent entry with the one provided here.
Below integrations, insert the following lines, following the instructions above:
  agent:
    enabled: true
    relabel_configs:
      - action: replace
        source_labels:
          - agent_hostname
        target_label: instance
Below logs.configs.scrape_configs, insert the following lines according to your environment.
    - job_name: integrations/agent
      journal:
        max_age: 24h
        labels:
          job: integrations/agent
      pipeline_stages:
        - match:
            selector: '{unit!="grafana-agent.service"}'
            action: drop
            drop_counter_reason: only_keep_grafana_agent_logs
        - regex:
            expression: "(level=(?P<log_level>[\\s]*debug|warn|info|error))"
        - labels:
            level: log_level
      relabel_configs:
        - source_labels: ['__journal__systemd_unit']
          target_label: 'unit'
        - source_labels: ['__journal__hostname']
          target_label: 'instance'
Windows specific:
For Windows add the following snippet below logs.configs.scrape_configs instead:
    - job_name: integrations/agent
      windows_events:
        use_incoming_timestamp: true
        bookmark_path: "C:\\Program Files\\Grafana Agent\\bookmarks-agent.xml"
        eventlog_name: "Application"
        xpath_query: "*[System[Provider[@Name='Grafana Agent']]]"
        labels:
          job: integrations/agent
      relabel_configs:
        - source_labels: ['computer']
          target_label: 'instance'
        - replacement: grafana-agent.service
          target_label: unit
      pipeline_stages:
      - json:
          expressions:
            message: message
      - regex:
          expression: "(level=(?P<log_level>[\\s]*debug|warn|info|error))"
      - labels:
          level: log_level
      - output:
          source: message
The bookmark_path in the configuration provided is set to a file inside the default Grafana Agent installation path in Windows. If you wish to configure a different bookmark path, please update it accordingly.
Full example configuration for Grafana Agent
Refer to the following Grafana Agent configuration for a complete example that contains all the snippets used for the Grafana Agent health integration. This example also includes metrics that are sent to monitor your Grafana Agent instance.
Dashboards
The Grafana Agent health integration installs the following dashboards in your Grafana Cloud instance to help monitor your system.
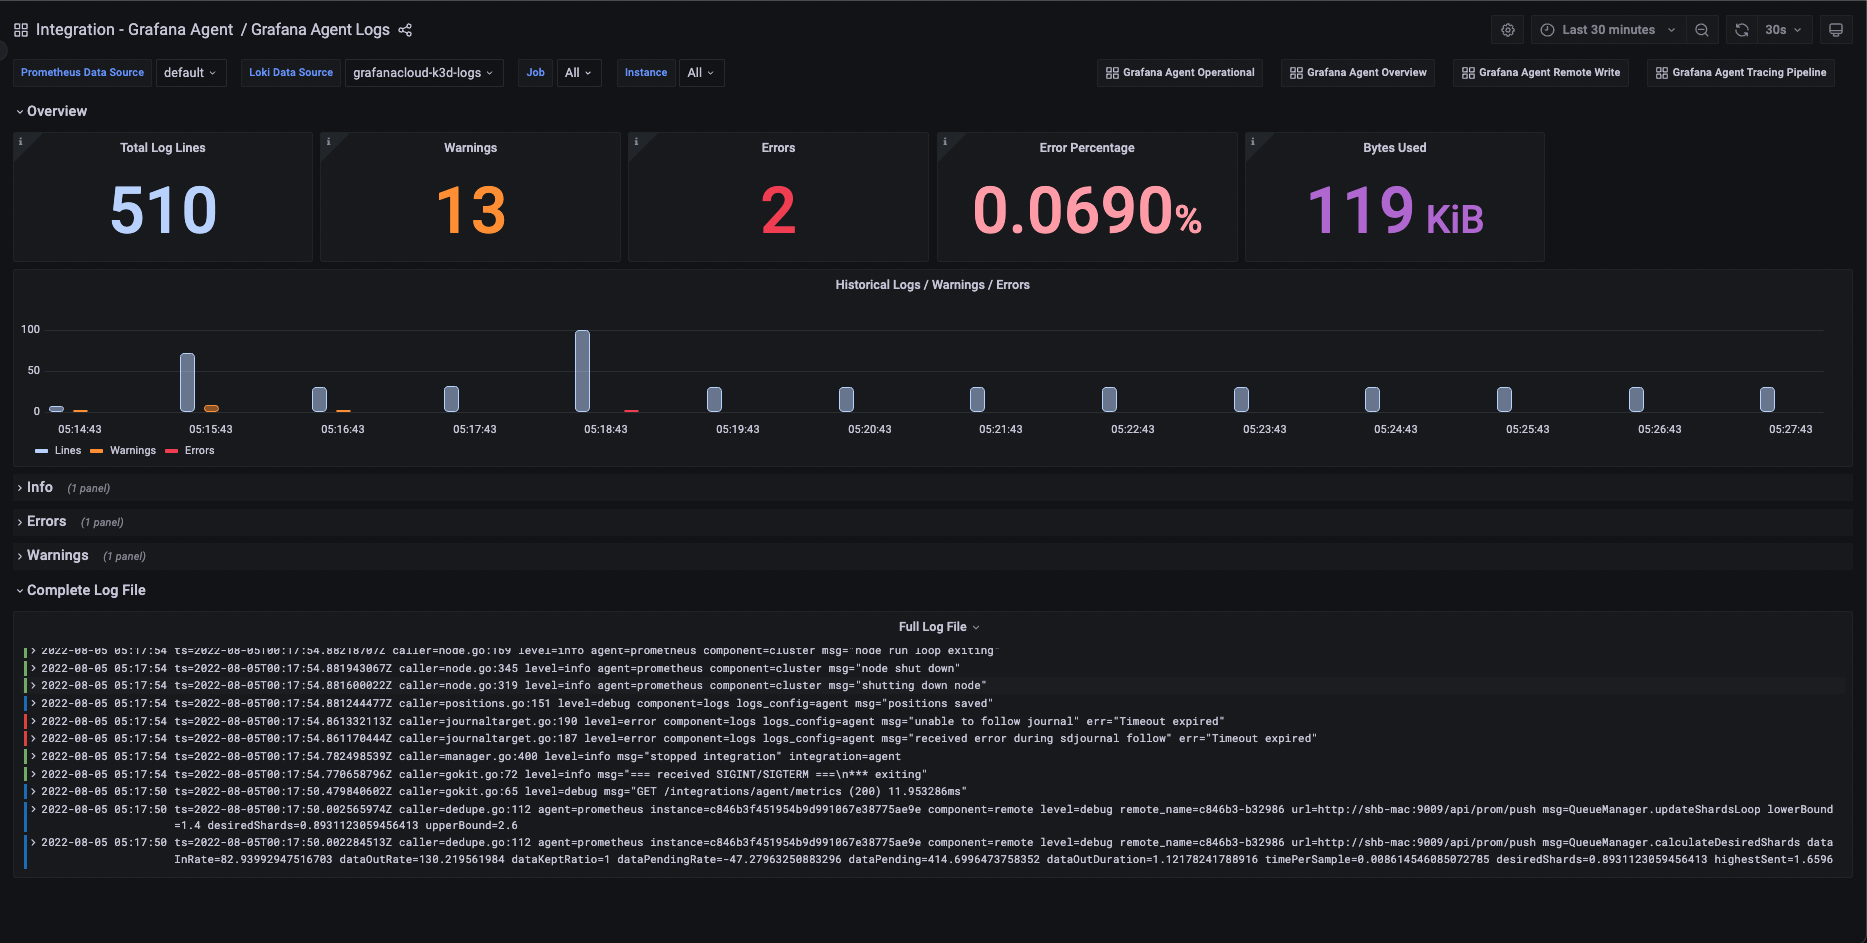
- Grafana Agent Logs
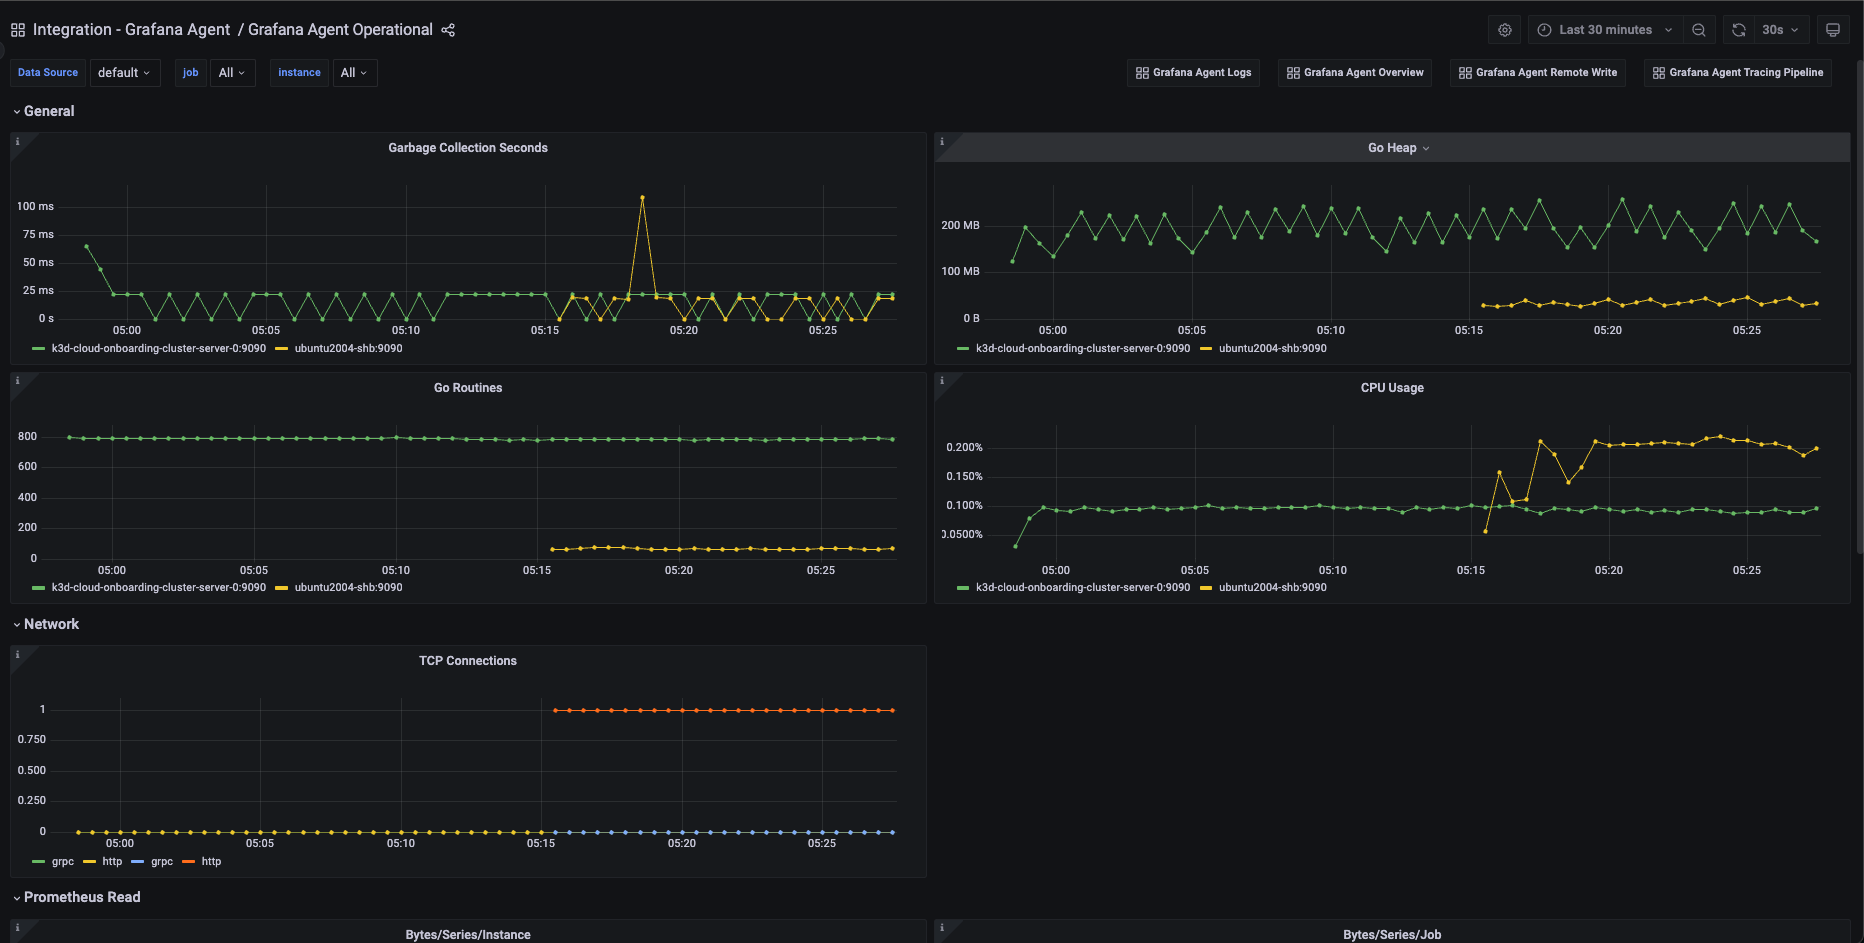
- Grafana Agent Operational
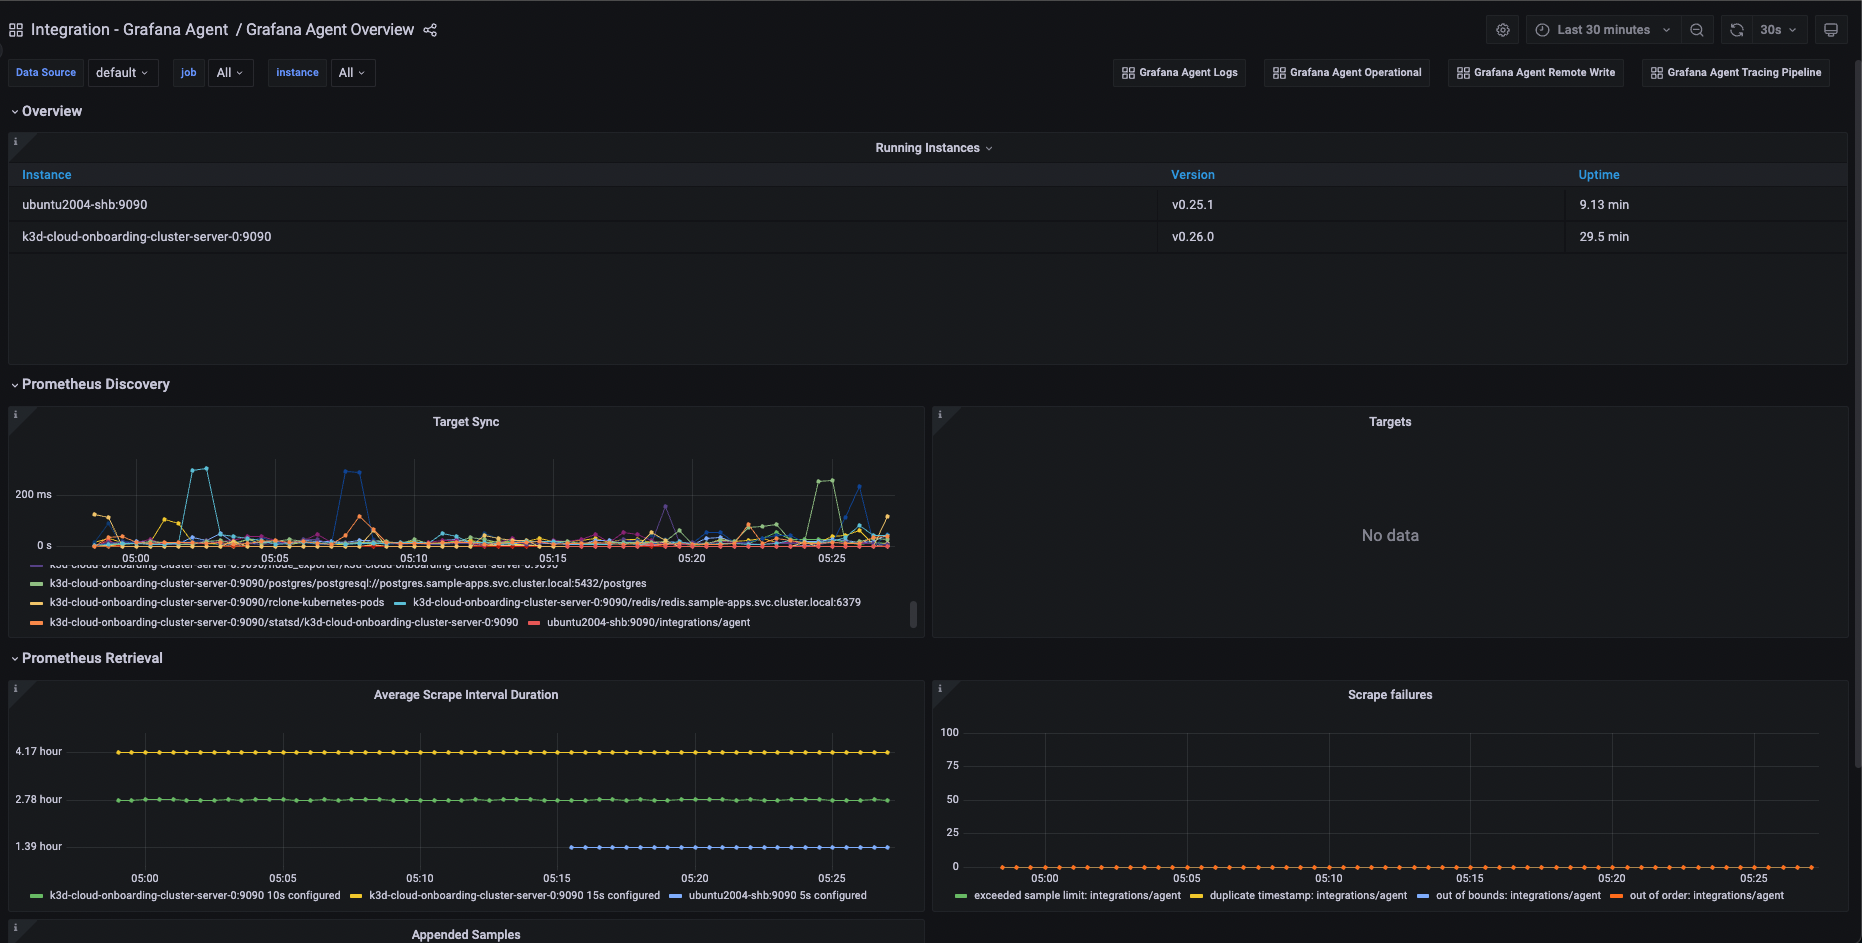
- Grafana Agent Overview
- Grafana Agent Remote Write
- Grafana Agent Tracing Pipeline
Grafana Agent Overview
Grafana Agent Logs
Grafana Agent Operational
Alerts
The Grafana Agent health integration includes the following useful alerts:
Metrics
The most important metrics provided by the Grafana Agent health integration, which are used on the pre-built dashboards and Prometheus alerts, are as follows:
- agent_build_info
- agent_tcp_connections
- agent_wal_samples_appended_total
- agent_wal_storage_active_series
- go_gc_duration_seconds_count
- go_goroutines
- go_memstats_heap_inuse_bytes
- process_cpu_seconds_total
- process_start_time_seconds
- prometheus_remote_storage_enqueue_retries_total
- prometheus_remote_storage_highest_timestamp_in_seconds
- prometheus_remote_storage_queue_highest_sent_timestamp_seconds
- prometheus_remote_storage_samples_dropped_total
- prometheus_remote_storage_samples_failed_total
- prometheus_remote_storage_samples_pending
- prometheus_remote_storage_samples_retried_total
- prometheus_remote_storage_samples_total
- prometheus_remote_storage_sent_batch_duration_seconds_bucket
- prometheus_remote_storage_sent_batch_duration_seconds_count
- prometheus_remote_storage_sent_batch_duration_seconds_sum
- prometheus_remote_storage_shard_capacity
- prometheus_remote_storage_shards
- prometheus_remote_storage_shards_desired
- prometheus_remote_storage_shards_max
- prometheus_remote_storage_shards_min
- prometheus_remote_storage_succeeded_samples_total
- prometheus_sd_discovered_targets
- prometheus_target_interval_length_seconds_count
- prometheus_target_interval_length_seconds_sum
- prometheus_target_scrapes_exceeded_sample_limit_total
- prometheus_target_scrapes_sample_duplicate_timestamp_total
- prometheus_target_scrapes_sample_out_of_bounds_total
- prometheus_target_scrapes_sample_out_of_order_total
- prometheus_target_sync_length_seconds_sum
- prometheus_wal_watcher_current_segment
- traces_exporter_send_failed_spans_total
- traces_exporter_sent_spans_total
- traces_receiver_accepted_spans_total
- traces_receiver_refused_spans_total
- up
Changelog
# 1.0.1 - April 2024

* Update to latest mixin, fixes in Tracing pipeline dashboard

# 1.0.0 - March 2024

* Update to latest mixin, replacing Angular panels with React-based panels

# 0.0.6 - September 2023

* New Filter Metrics option for configuring the Grafana Agent, which saves on metrics cost by dropping any metric not used by this integration. Beware that anything custom built using metrics that are not on the snippet will stop working.

# 0.0.5 - August 2023

* Add instance label detection for logs on Linux

# 0.0.4 - August 2023

* Add regex filter for logs datasource

# 0.0.3 - August 2023

* Updates agent configuration:
    * Set bookmark path to default agent installation directory for windows
    * Separate bookmark filename from system and application event logs bookmark file

# 0.0.2 - June 2023

* Update mixin to include alerts

# 0.0.1 - July 2022

* Initial release
Cost
By connecting your Grafana Agent health instance to Grafana Cloud, you might incur charges. To view information on the number of active series that your Grafana Cloud account uses for metrics included in each Cloud tier, see Active series and dpm usage and Cloud tier pricing.
Was this page helpful?
Related resources from Grafana Labs


