
Analyze metrics usage with the Prometheus API
If you have a large number of active series or larger endpoints (100k’s of series and bigger), the analytical Prometheus queries might run longer than the Grafana Explorer is configured to wait. In this case, we recommend directly interacting with the Prometheus HTTP API.
In addition, you can use the Adaptive Metrics cost optimization tooling to help reduce costs.
Before you begin
To begin with this section, you should have the jq, curl, sort, and date command-line utilities installed on your machine. You can also use an API request tool like Postman, but configuring such tools goes beyond the scope of this guide.
Set the environment to query the API
Open a command-line shell like bash and set the following two variables that will be referenced in subsequent curl commands:
login="your_endpoint_user:your_cloud_access_policy_token>"
url="your_metrics_instance_query_endpoint"
Replace your_endpoint_user with the User parameter from the Prometheus endpoint Details page. You can navigate to the Prometheus endpoint details page from the Cloud Portal:
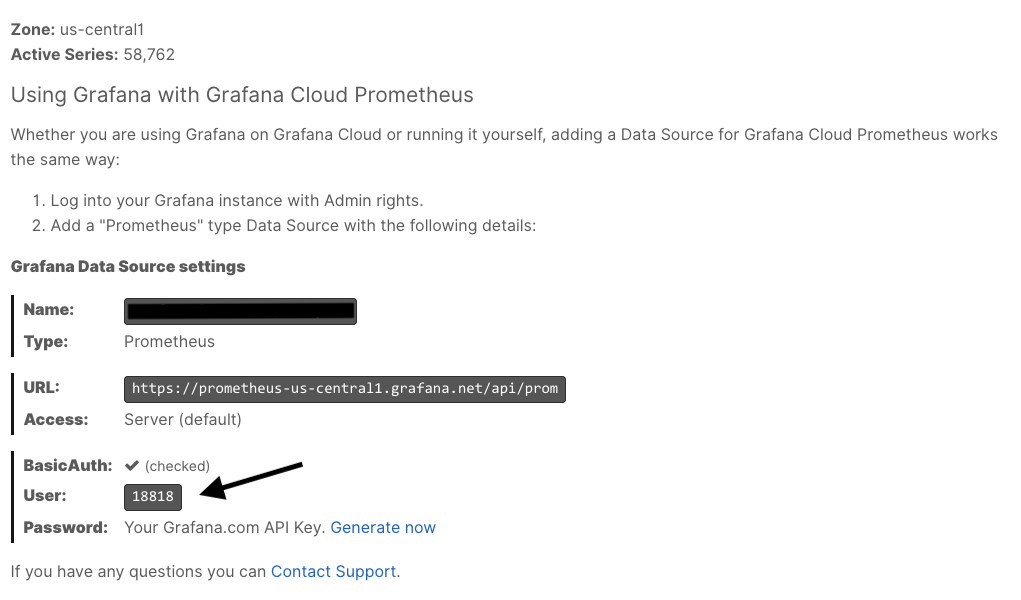
In the example above, the User is 18818.
Replace your_cloud_access_policy_token with a token for a Cloud Access Policy with the metrics:read scope. To do this, follow the instructions in Create a Cloud Access Policy.
Once you’ve set the login and url variables, you can query the Prometheus API.
Fetch a list of active metrics and their cardinalities
You can fetch a list of active metrics and cardinalities using the /query API endpoint, which accepts a PromQL query as a parameter.
We’ll first query the API for a list of metrics, and then loop over this list, querying the API once again for an active series count for each metric.
Change the
nowvariable to the current time:now=$(date +%s)Run the loop using
curl:curl -s -u $login $url/api/v1/label/__name__/values \ | jq -r ".data[]" \ | while read metric; do count=$(curl -s \ -u $login \ --data-urlencode 'query=count({__name__="'$metric'"})' \ --data-urlencode "time=$now" \ $url/api/v1/query \ | jq -r ".data.result[0].value[1]") echo "$count $metric" done
This command first queries the /api/v1/label/ metadata endpoint with the __name__ meta-label to fetch a list of metric names. It then uses the jq utility to extract the data field from the JSON response.
Finally, the while loop iterates over the metrics, querying the API at /api/v1/query with the metric name and count() operator for a count of active series for each metric. The metric cardinality and metric name are then printed to stdout.
You can save the output to a file by appending > metric_cardinalities.out to the end of the command. You can then import this data into a spreadsheet for further analysis.
Fetch a list of active series for a given metric
To further drill down into a high cardinality metric, you can fetch a list of active series for any given metric.
Change the
nowvariable to the current time:now=$(date +%s)Set the
metricvariable to the metric you’d like to query by replacing<high_cardinality_metric>:metric=<high_cardinality_metric>Use
curlto perform the following request against the Prometheus API:curl -s \ -u $login \ --data-urlencode "query=$metric" \ --data-urlencode "time=$now" \ $url/api/v1/query \ | jq -c ".data.result[].metric"
This command uses the Prometheus API’s Query endpoint to fetch a list of active time series for a given metric. To learn more about the Prometheus HTTP API, see the Prometheus API docs.
Fetch a list of all metrics
Note
This method may report some inactive metrics.
To use the metadata API to quickly fetch a list of all metrics, perform the following HTTP request using curl:
curl -s -u $login $url/api/v1/label/__name__/values | jq -r ".data[]" | sortThis queries the /api/v1/label endpoint for metric names using the __name__ meta-label. The result is then extracted using jq and sorted using the sort utility.
Fetch a list of labels and their cardinalities
Note
This method may report some inactive metrics.
To fetch a list of labels and their cardinalities (for example the number of unique hostname values), perform the following HTTP request using curl:
curl -s -u $login $url/api/v1/labels \
| jq -r ".data[]" \
| while read label; do
    count=$(curl -s -u $login $url/api/v1/label/$label/values \
    | jq -r ".data|length")
    echo "$count $label"
  done \
| sort -n
This request fetches a list of label names and then loops through them, fetching a list of label values for each label name. jq counts the length of the response list and the output is printed to stdout. The sort utility sorts the resulting count label list by label cardinality, which helps you identify the highest cardinality labels (labels with the most values).
Fetch a list of series per value for a given label
Note
This method may report some inactive metrics.
To fetch a list of values for a given label, and the number of active series using that value label.
First set the bash variable label to the name of the label you wish to query:
label=<LABEL NAME>Then, run the following command:
curl -s -u $login $url/api/v1/label/$label/values \
| jq -r ".data[]" \
| while read label_value; do
    count=$(curl -s \
        -u $login \
        --data-urlencode 'query=count({'$label'=~"'$label_value'"})' \
        --data-urlencode "time=$now" \
        $url/api/v1/query \
    | jq -r ".data.result[0].value[1]")
    echo "$count $label_value"
done
This request fetches a list of values and then loops through them. Then the query retrieves a list of series for each label value and counts them. The output shows a list of label values and a number of series printed to stdout.
Was this page helpful?
Related resources from Grafana Labs


