
Application errors overview
Grafana Cloud
Application errors overview
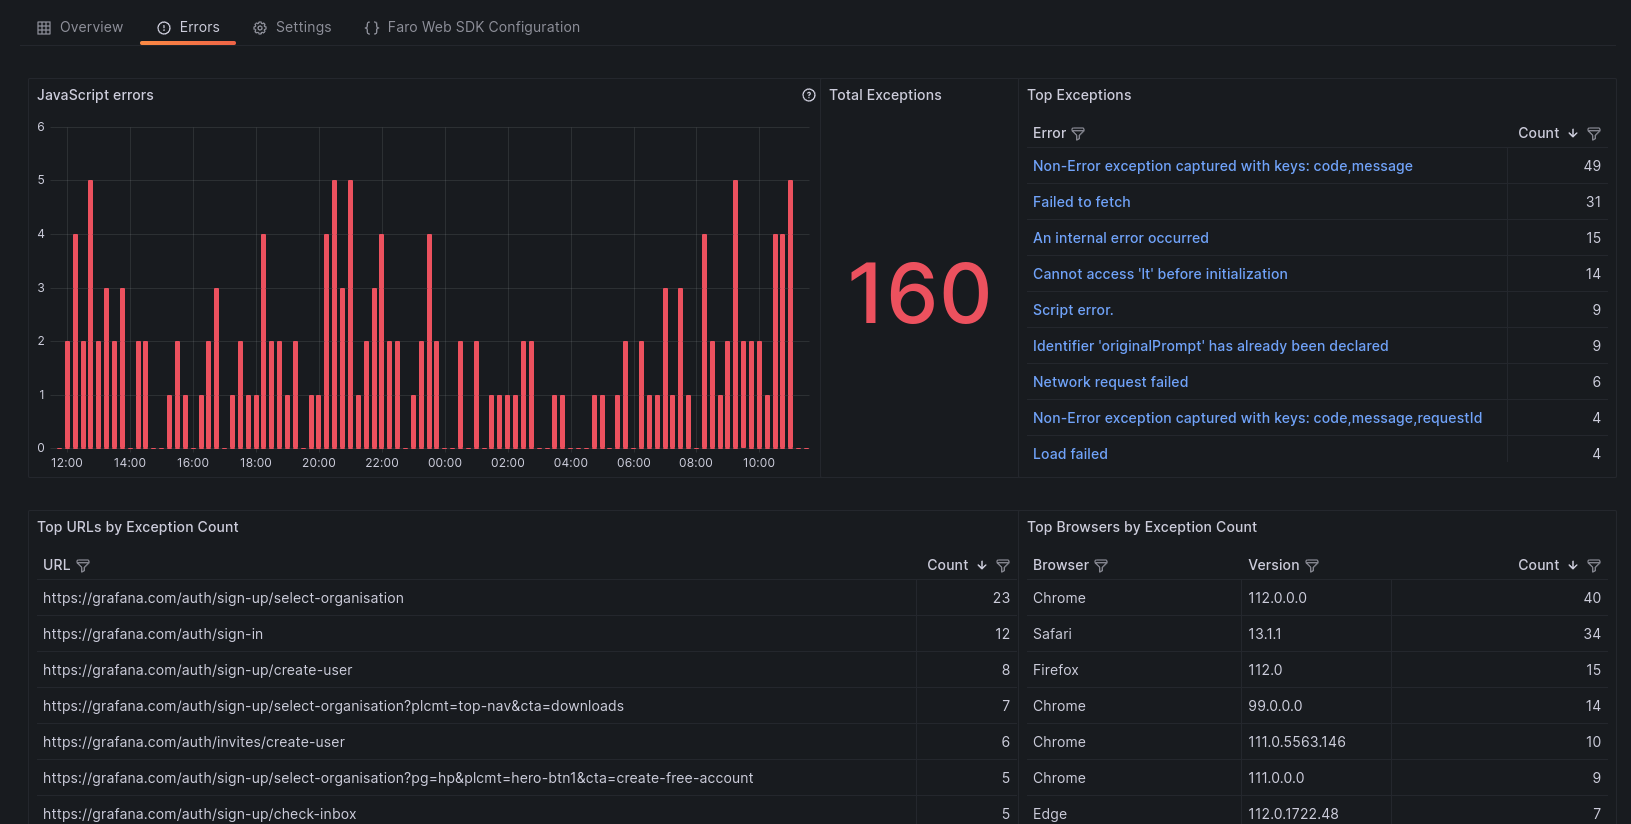
The Errors Overview page gives insights into your application’s errors:
- View how many errors your application is generating within a given time frame
- Filter results based on an error
- Filter out noisy errors
- Inspect error context: stack trace, session ids, metadata
- Identify dominant exceptions
- Identify URLs that are generating errors
- Segregate error count based on browsers
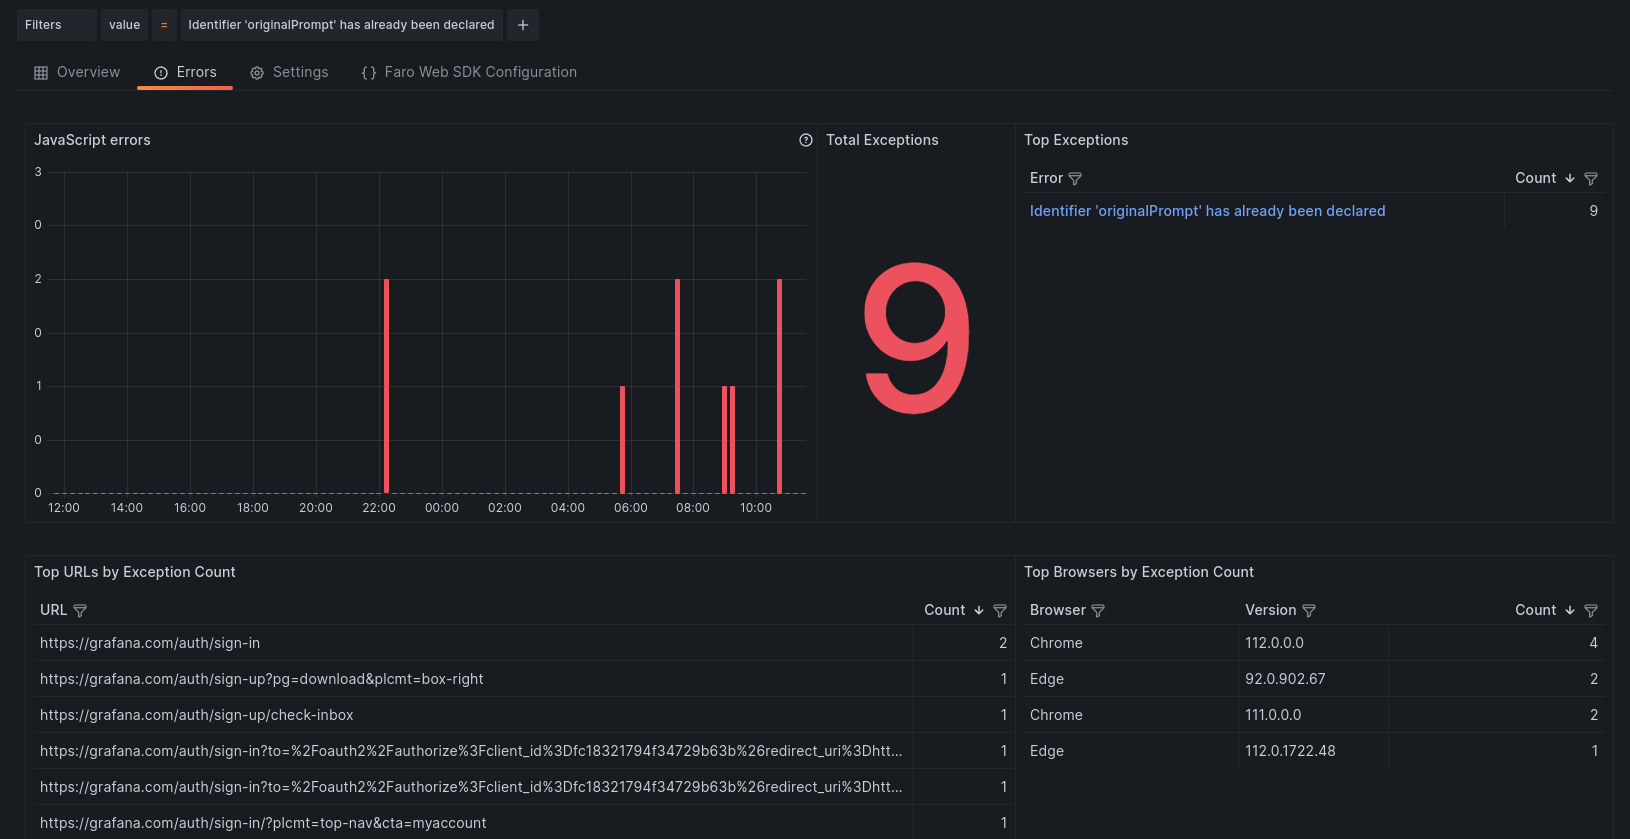
Filter results based on an Error
To isolate the panels based on a specific errors:
- Navigate into the Top Exceptions panel
- Find the Error that you want to filter
- Click the ‘+’ sign, magnifying glass

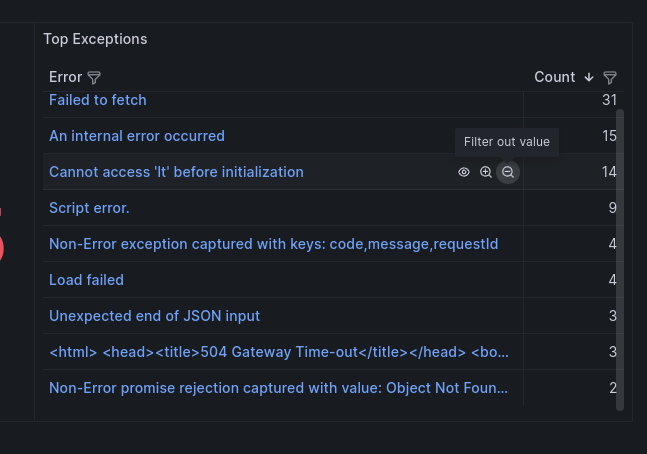
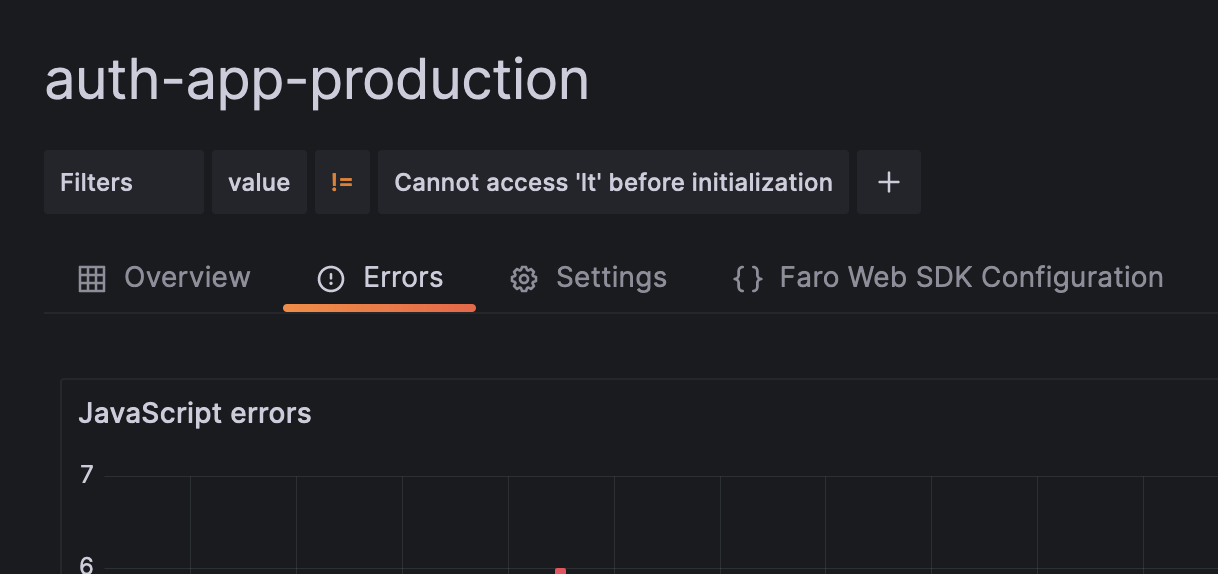
Filter out an Error
To remove an error from the results:
- Navigate into the Top Exceptions panel
- Find the Error that you want to filter
- Click the ‘-’ sign, magnifying glass
View Error context
To expand the Error and context: stack trace, browser, OS, and other metadata.
- Navigate into the Top Exceptions panel
- Find the Error that you want to filter
- Click the name of the blue colored error

You can follow the process above to filter based on:
- URL paths on the Top URLs by Exception Count panel
- Browser Name on the Browser column of the Top Browsers by Exception Count
- Browser Version on the Version column of the Top Browsers by Exception Count
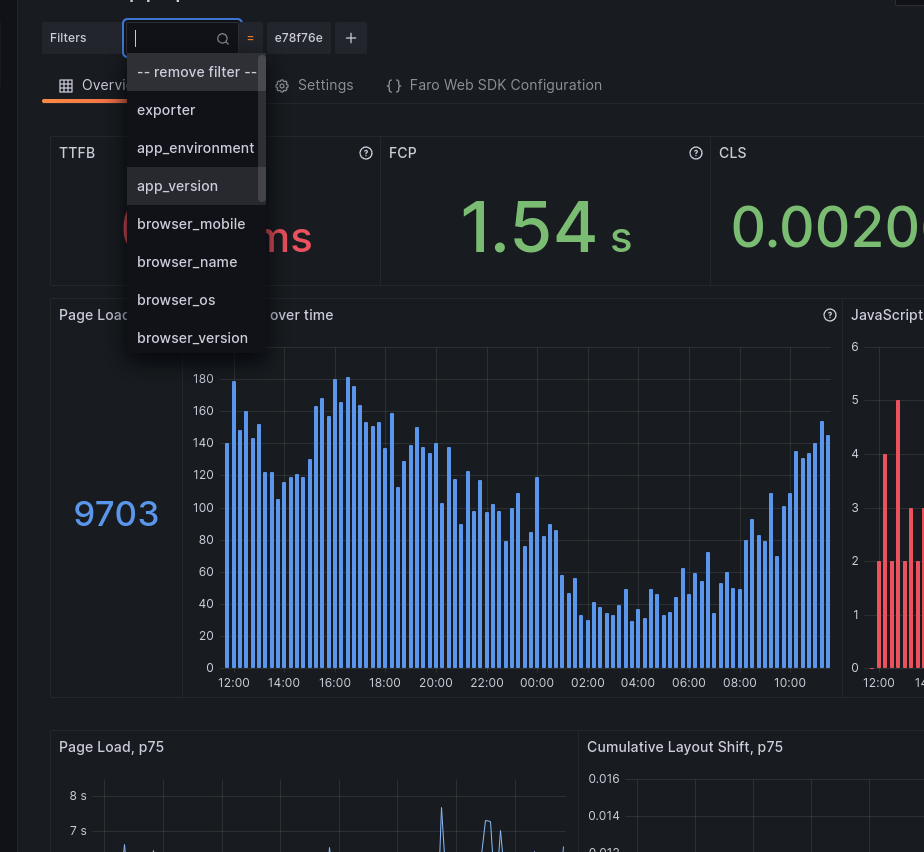
Adding a meta filter
You can also add other metadata filters as you would in the Performance Overview page. To add a meta filter:
- Click the ‘+’ button
- Select the meta label that you want from the drop-down
- Select the value from the drop-down

To edit a meta filter value:
- Click the value of the filter you want to change
- Select the new value from the drop-down
To remove a meta filter
- Click the label of the filter you want to remove
- Select ‘–remove filter–’ from top the drop-down list
Was this page helpful?
Related resources from Grafana Labs
17 Sep

Getting started with managing your metrics, logs, and traces using Grafana
In this webinar, we’ll demo how to get started using the LGTM Stack: Loki for logs, Grafana for visualization, Tempo for traces, and Mimir for metrics.
11 Sep

Intro to Kubernetes monitoring in Grafana Cloud
In this webinar you’ll learn how Grafana offers developers and SREs a simple and quick-to-value solution for monitoring their Kubernetes infrastructure.
60 min

Building advanced Grafana dashboards
In this webinar, we’ll demo how to build and format Grafana dashboards.