
PostgreSQL integration for Grafana Cloud
PostgreSQL is a free and open-source relational database management system (RDBMS) emphasizing extensibility and SQL compliance.
This integration includes 15 useful alerts and 2 pre-built dashboards to help monitor and visualize PostgreSQL metrics and logs.
Before you begin
The PostgreSQL user is required to gather metrics. While you can use root user for testing, we strongly advice that you configure a separate user for Grafana Alloy, and give it only the strictly mandatory security privileges necessary for monitoring your node, as per the official documentation.
If you want to collect logs from your PostgreSQL nodes, please check the official documentation since it only writes logs to stderr by default.
Install PostgreSQL integration for Grafana Cloud
- In your Grafana Cloud stack, click Connections in the left-hand menu.
- Find PostgreSQL and click its tile to open the integration.
- Review the prerequisites in the Configuration Details tab and set up Grafana Alloy to send PostgreSQL metrics and logs to your Grafana Cloud instance.
- Click Install to add this integration’s pre-built dashboards and alerts to your Grafana Cloud instance, and you can start monitoring your PostgreSQL setup.
Configuration snippets for Grafana Alloy
Simple mode
These snippets are configured to scrape a single PostgreSQL node running locally with default ports.
Manually copy and append the following snippets into your Grafana Alloy configuration file.
Integrations snippets
prometheus.exporter.postgres "integrations_postgres_exporter" {
    data_source_names = ["postgresql://localhost:5432/postgres"]
}
discovery.relabel "integrations_postgres_exporter" {
    targets = prometheus.exporter.postgres.integrations_postgres_exporter.targets

    rule {
        target_label = "instance"
        replacement  = constants.hostname
    }
    rule {
        target_label = "job"
        replacement  = "integrations/postgres_exporter"
    }
}
prometheus.scrape "integrations_postgres_exporter" {
    targets    = discovery.relabel.integrations_postgres_exporter.output
    forward_to = [prometheus.remote_write.metrics_service.receiver]
    job_name   = "integrations/postgres_exporter"
}
Logs snippets
darwin
local.file_match "logs_integrations_postgres_exporter" {
    path_targets = [{
        __address__ = "localhost",
        __path__    = "/var/log/postgresql/postgres.log",
        instance    = constants.hostname,
        job         = "integrations/postgres_exporter",
    }]
}
loki.source.file "logs_integrations_postgres_exporter" {
    targets    = local.file_match.logs_integrations_postgres_exporter.targets
    forward_to = [loki.write.grafana_cloud_loki.receiver]
}
linux
local.file_match "logs_integrations_postgres_exporter" {
    path_targets = [{
        __address__ = "localhost",
        __path__    = "/var/log/postgresql/postgres.log",
        instance    = constants.hostname,
        job         = "integrations/postgres_exporter",
    }]
}
loki.source.file "logs_integrations_postgres_exporter" {
    targets    = local.file_match.logs_integrations_postgres_exporter.targets
    forward_to = [loki.write.grafana_cloud_loki.receiver]
}
windows
local.file_match "logs_integrations_postgres_exporter" {
    path_targets = [{
        __address__ = "localhost",
        __path__    = "C:\\Program Files\\PostgreSQL\\*\\data\\pg_log",
        instance    = constants.hostname,
        job         = "integrations/postgres_exporter",
    }]
}
loki.source.file "logs_integrations_postgres_exporter" {
    targets    = local.file_match.logs_integrations_postgres_exporter.targets
    forward_to = [loki.write.grafana_cloud_loki.receiver]
}
Advanced mode
To instruct Grafana Alloy to scrape your PostgreSQL nodes, go though the subsequent instructions.
The snippets provide examples to guide you through the configuration process.
First, manually copy and append the following snippets into your Grafana Alloy configuration file.
Then follow the instructions below to modify the necessary variables.
Advanced integrations snippets
prometheus.exporter.postgres "integrations_postgres_exporter" {
    data_source_names = ["postgresql://localhost:5432/postgres"]
}
discovery.relabel "integrations_postgres_exporter" {
    targets = prometheus.exporter.postgres.integrations_postgres_exporter.targets

    rule {
        target_label = "instance"
        replacement  = constants.hostname
    }
    rule {
        target_label = "job"
        replacement  = "integrations/postgres_exporter"
    }
}
prometheus.scrape "integrations_postgres_exporter" {
    targets    = discovery.relabel.integrations_postgres_exporter.output
    forward_to = [prometheus.remote_write.metrics_service.receiver]
    job_name   = "integrations/postgres_exporter"
}
Add a pair of prometheus.exporter.postgres and discovery.relabel to your Grafana Alloy configuration to monitor a Postgres instance.
For ease of use, the provided snippets sets the instance label to the hostname using the constants.hostname Agent Flow constant variable. If you are scraping using a remote Agent Flow instance please change it to a value that identifies this instance.
Make sure to change the data_source_names to the addresses of the Postgres server you want to monitor in the Alloy config.
Refer to the linked documentation for the full array of options.
Finally, reference each discovery.relabel component within the targets property of the prometheus.scrape component.
Advanced logs snippets
darwin
local.file_match "logs_integrations_postgres_exporter" {
    path_targets = [{
        __address__ = "localhost",
        __path__    = "/var/log/postgresql/postgres.log",
        instance    = constants.hostname,
        job         = "integrations/postgres_exporter",
    }]
}
loki.source.file "logs_integrations_postgres_exporter" {
    targets    = local.file_match.logs_integrations_postgres_exporter.targets
    forward_to = [loki.write.grafana_cloud_loki.receiver]
}
To collect logs from unix-like systems, you need a pair of loki.source.file, and local.file_match components.
The provided snippet is pre-configured with the default log write location for unix-like OS environments.
If you wish to capture other log files, you must add new maps to the path_targets list parameter of the local.file_match component, and include it in the targets list of loki.source.file component. Make sure that the new entry has the same instance and job labels, so it is matched to the correct instance to be shown in the Logs dashboard.
The log write location depends on your PostgreSQL configuration, make sure to configure __path__ within local.file_match accordingly.
linux
local.file_match "logs_integrations_postgres_exporter" {
    path_targets = [{
        __address__ = "localhost",
        __path__    = "/var/log/postgresql/postgres.log",
        instance    = constants.hostname,
        job         = "integrations/postgres_exporter",
    }]
}
loki.source.file "logs_integrations_postgres_exporter" {
    targets    = local.file_match.logs_integrations_postgres_exporter.targets
    forward_to = [loki.write.grafana_cloud_loki.receiver]
}
To collect logs from unix-like systems, you need a pair of loki.source.file, and local.file_match components.
The provided snippet is pre-configured with the default log write location for unix-like OS environments.
If you wish to capture other log files, you must add new maps to the path_targets list parameter of the local.file_match component, and include it in the targets list of loki.source.file component. Make sure that the new entry has the same instance and job labels, so it is matched to the correct instance to be shown in the Logs dashboard.
The log write location depends on your PostgreSQL configuration, make sure to configure __path__ within local.file_match accordingly.
windows
local.file_match "logs_integrations_postgres_exporter" {
    path_targets = [{
        __address__ = "localhost",
        __path__    = "C:\\Program Files\\PostgreSQL\\*\\data\\pg_log",
        instance    = constants.hostname,
        job         = "integrations/postgres_exporter",
    }]
}
loki.source.file "logs_integrations_postgres_exporter" {
    targets    = local.file_match.logs_integrations_postgres_exporter.targets
    forward_to = [loki.write.grafana_cloud_loki.receiver]
}
To collect logs from Windows systems, you need a pair of loki.source.file, and local.file_match components.
The provided snippet is pre-configured with the default log write location for Windows OS environments.
If you wish to capture other log files, you must add new maps to the path_targets list parameter of the local.file_match component, and include it in the targets list of loki.source.file component. Make sure that the new entry has the same instance and job labels, so it is matched to the correct instance to be shown in the Logs dashboard.
The log write location depends on your PostgreSQL configuration, make sure to configure __path__ within local.file_match accordingly.
You can also configure your PostgreSQL nodes to write logs to eventlog, in which case you will need to use the loki.source.windowsevent component instead of local.file_match and loki.source.file.
Grafana Agent static configuration (deprecated)
The following section shows configuration for running Grafana Agent in static mode which is deprecated. You should use Grafana Alloy for all new deployments.
Before you begin with Grafana Agent static
The PostgreSQL user is required to gather metrics. While you can use root user for testing, we strongly advice that you configure a separate user for the Grafana Agent, and give it only the strictly mandatory security privileges necessary for monitoring your node, as per the official documentation.
Install PostgreSQL integration
- In your Grafana Cloud stack, click Connections in the left-hand menu.
- Find PostgreSQL and click its tile to open the integration.
- Review the prerequisites in the Configuration Details tab and set up Grafana Agent to send PostgreSQL metrics and logs to your Grafana Cloud instance.
- Click Install to add this integration’s pre-built dashboards and alerts to your Grafana Cloud instance, and you can start monitoring your PostgreSQL setup.
Post-install configuration for the PostgreSQL integration
Enable the integration by manually adding the provided snippets to your agent configuration file.
This integration supports metrics and logs from Postgres. In order to see those signals correlated on your dashboard, as a single pane of glass, ensure the following:
jobandinstancelabels must match forpostgres_exporter(metrics) andlogsin the Agent configuration file.joblabel must be set tointegrations/postgres_exporter(already configured in the snippets).instancelabel must be set to a value that uniquely identifies your Postgres Node. Replace it manually, according to your environment. Note that if you uselocalhostfor multiple nodes, the dashboards will not be able to filter correctly by instance.
Make sure to change the data_source_names to the addresses of the Postgres servers you want to monitor in the agent config.
For a full description of configuration options see how to configure the postgres_exporter_config block in the agent documentation.
Make sure to configure the right logs path to scrape your postgres log files under __path__ entry of your log snippet. To indetify your logs location, please follow the official documentation.
Configuration snippets for Grafana Agent
Below integrations, insert the following lines and change the URLs according to your environment:
  postgres_exporter:
    enabled: true
    instance: '<your-instance-name>' # must match instance used in logs
    data_source_names:
      - 'postgresql://<username>:<password>@<your_postgres_instance_name>:5432/postgres' # replace with your connection string
Below logs.configs.scrape_configs, insert the following lines according to your environment.
    - job_name: integrations/postgres_exporter
      static_configs:
      - targets:
        - localhost
        labels:
          instance: '<your-instance-name>'
          __path__: /usr/local/var/log/postgres.log
          job: integrations/postgres_exporter
Full example configuration for Grafana Agent
Refer to the following Grafana Agent configuration for a complete example that contains all the snippets used for the PostgreSQL integration. This example also includes metrics that are sent to monitor your Grafana Agent instance.
Dashboards
The PostgreSQL integration installs the following dashboards in your Grafana Cloud instance to help monitor your system.
- PostgreSQL logs
- Postgres Overview
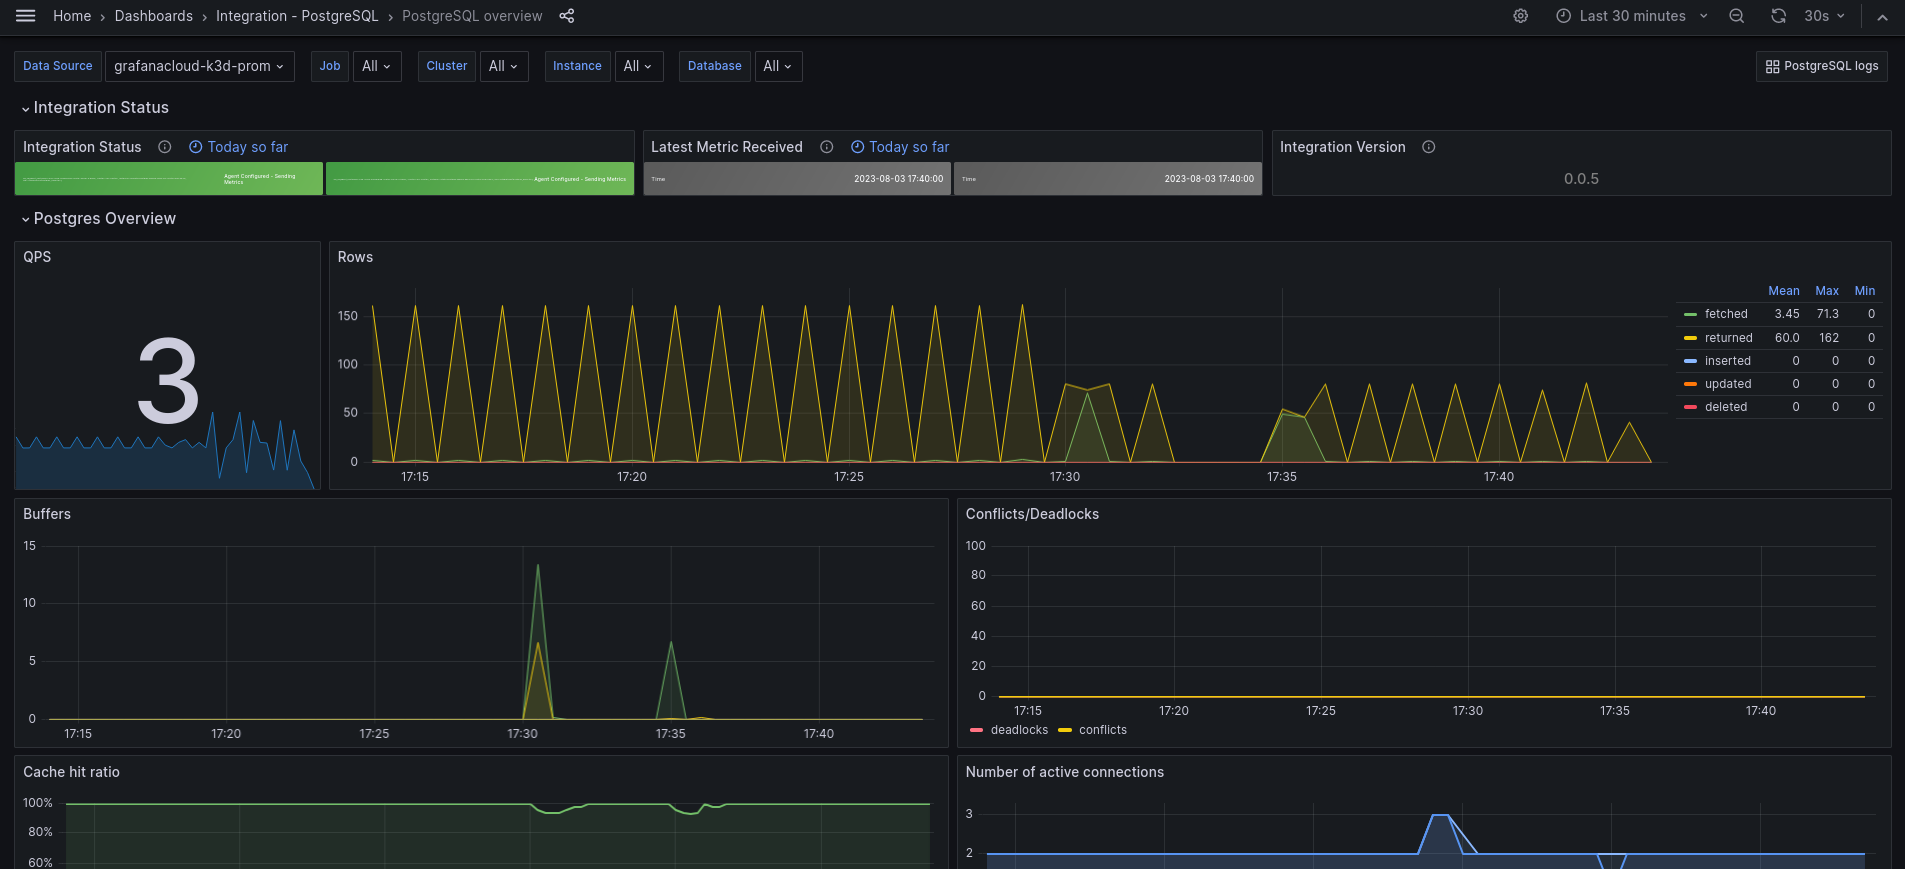
PostgreSQL overview dashboard
PostgreSQL logs dashboard

Alerts
The PostgreSQL integration includes the following useful alerts:
Metrics
The most important metrics provided by the PostgreSQL integration, which are used on the pre-built dashboards and Prometheus alerts, are as follows:
- pg_database_size_bytes
- pg_exporter_last_scrape_error
- pg_locks_count
- pg_replication_is_replica
- pg_replication_lag
- pg_replication_slots_active
- pg_settings_autovacuum_vacuum_scale_factor
- pg_settings_autovacuum_vacuum_threshold
- pg_settings_block_size
- pg_settings_max_connections
- pg_settings_max_locks_per_transaction
- pg_settings_superuser_reserved_connections
- pg_stat_activity_count
- pg_stat_activity_max_tx_duration
- pg_stat_bgwriter_buffers_alloc_total
- pg_stat_bgwriter_buffers_backend_fsync_total
- pg_stat_bgwriter_buffers_backend_total
- pg_stat_bgwriter_buffers_checkpoint_total
- pg_stat_bgwriter_buffers_clean_total
- pg_stat_bgwriter_checkpoints_req_total
- pg_stat_bgwriter_checkpoints_timed_total
- pg_stat_database_blks_hit
- pg_stat_database_blks_read
- pg_stat_database_conflicts
- pg_stat_database_deadlocks
- pg_stat_database_numbackends
- pg_stat_database_tup_deleted
- pg_stat_database_tup_fetched
- pg_stat_database_tup_inserted
- pg_stat_database_tup_returned
- pg_stat_database_tup_updated
- pg_stat_database_xact_commit
- pg_stat_database_xact_rollback
- pg_stat_user_tables_n_dead_tup
- pg_stat_user_tables_n_live_tup
- pg_up
- process_cpu_seconds_total
- process_resident_memory_bytes
- process_virtual_memory_bytes
- up
Changelog
Cost
By connecting your PostgreSQL instance to Grafana Cloud, you might incur charges. To view information on the number of active series that your Grafana Cloud account uses for metrics included in each Cloud tier, see Active series and dpm usage and Cloud tier pricing.
Was this page helpful?
Related resources from Grafana Labs


