
Apache Cassandra integration for Grafana Cloud
Apache Cassandra is an open source NoSQL distributed database. This integration for Grafana Cloud allows users to collect metrics and system logs for monitoring an Apache Cassandra instance or clustered deployment.
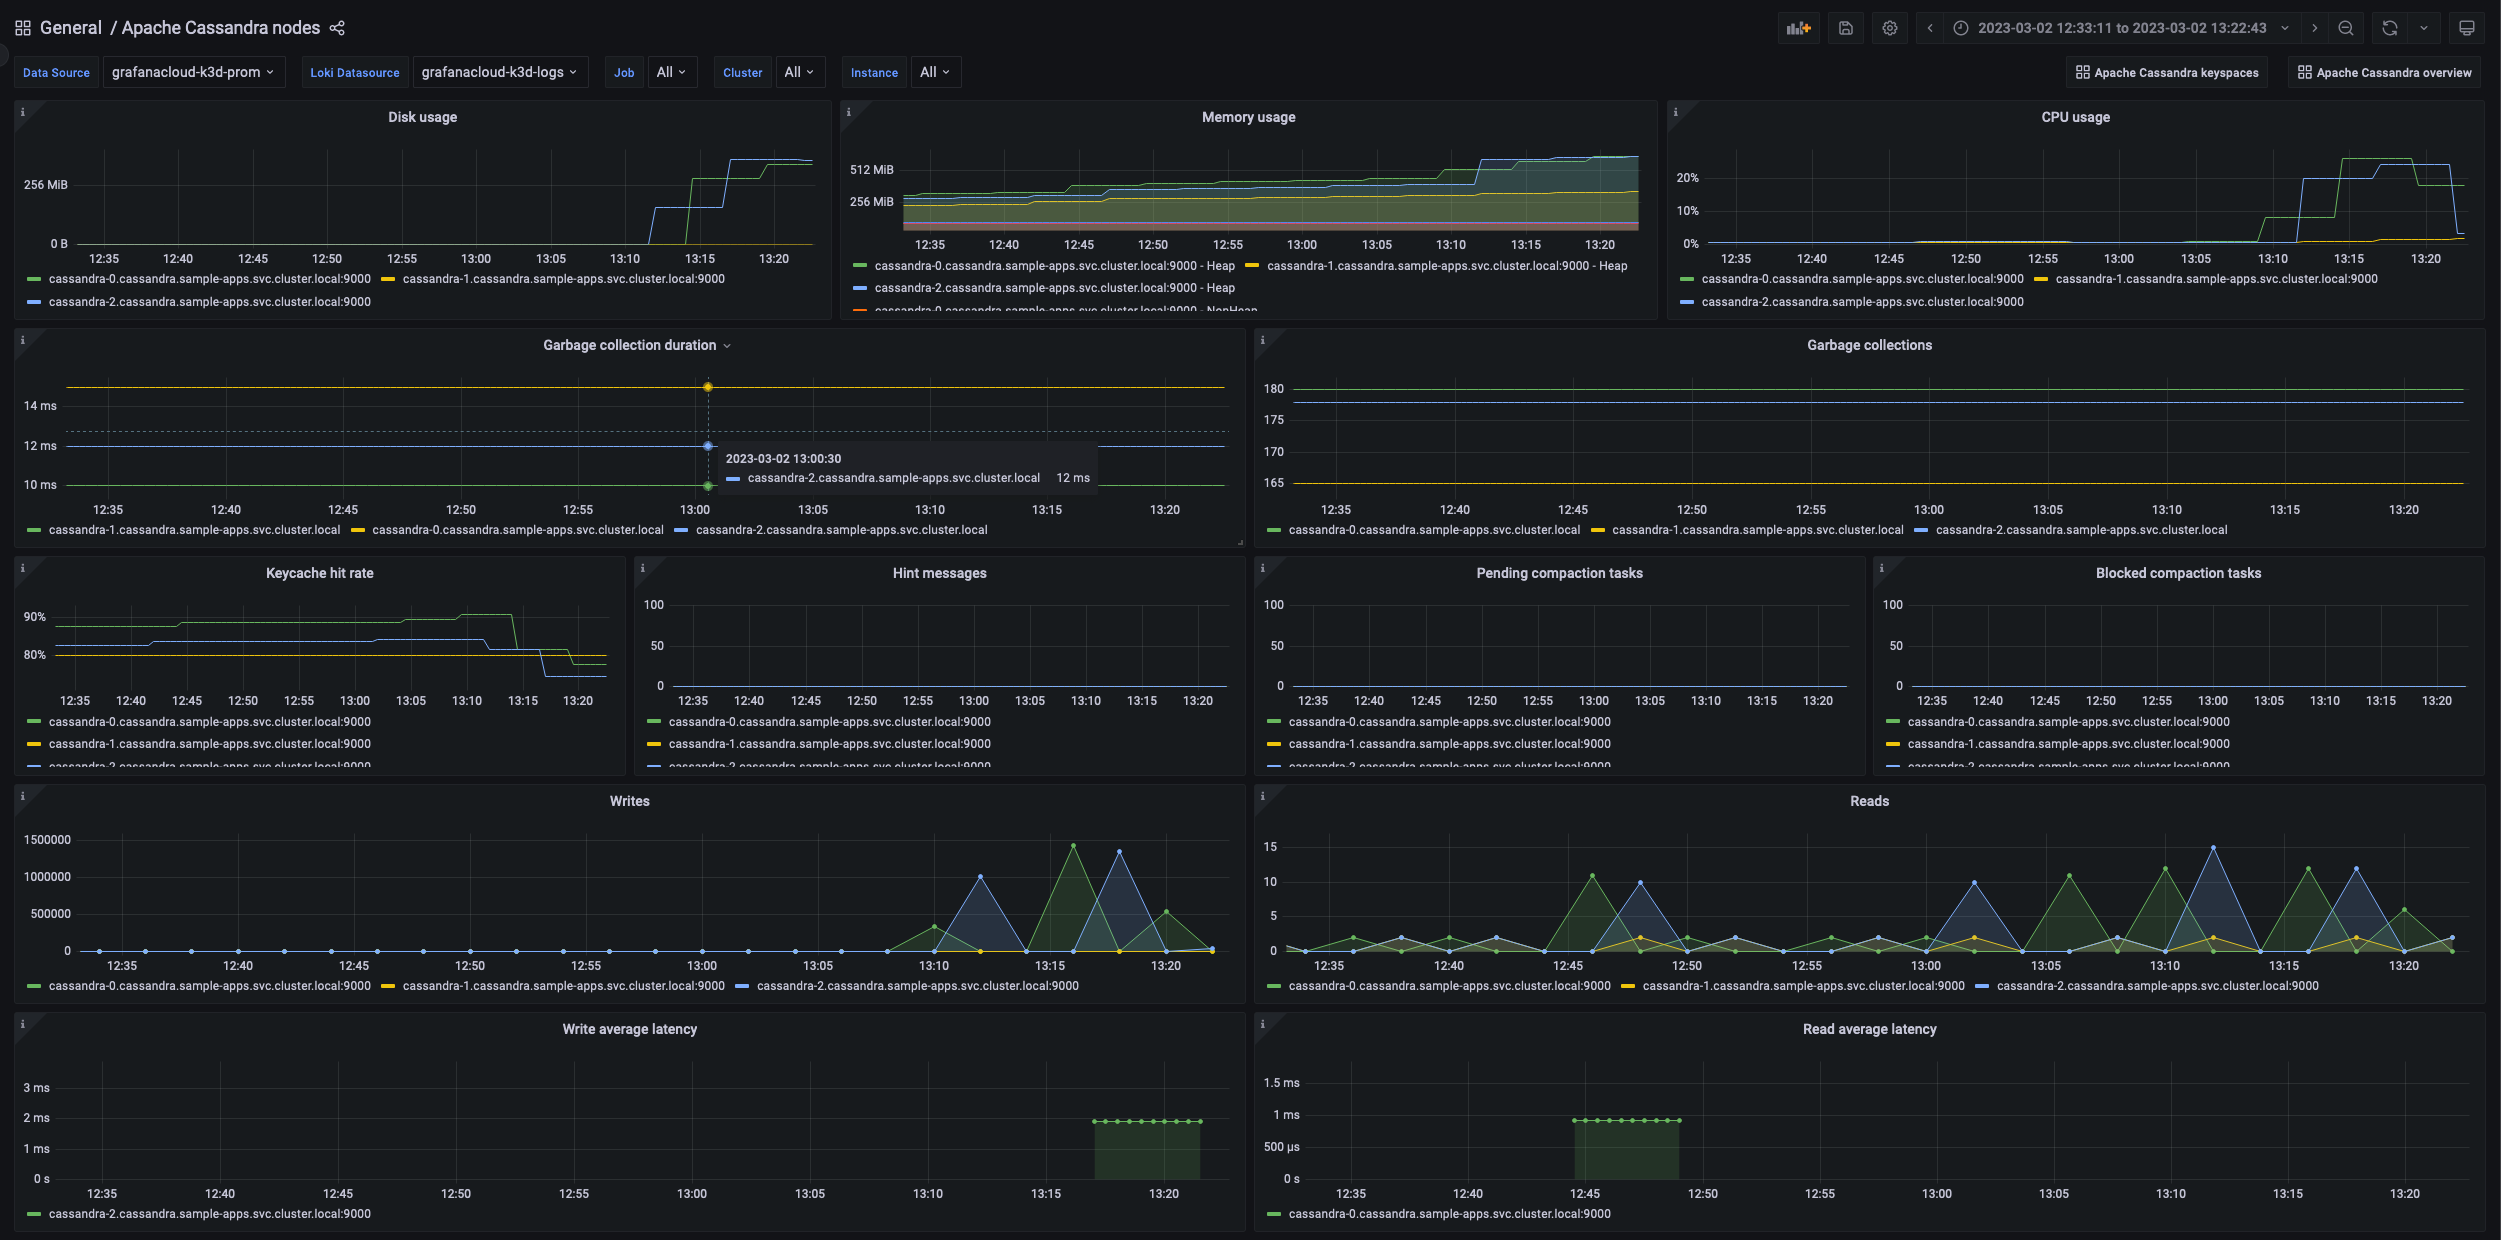
Metrics include number of nodes in a cluster, virtual memory and cpu usage, read/write latencies, compaction tasks, and garbage collections. It includes useful visualizations for cluster, node, and keyspace metrics.
This integration includes 8 useful alerts and 3 pre-built dashboards to help monitor and visualize Apache Cassandra metrics and logs.
Before you begin
In order for the integration to properly work, you must set up the JMX Exporter for Prometheus on each node in your cluster.
Set up JMX Exporter
Each instance of the JMX Exporter can be run with this Apache Cassandra JMX Exporter configuration file.
For more information on how to configure the JVM on each node, please refer to the JMX Exporter documentation for further configuration details.
Apache Cassandra nodes by default expose 7199 for JMX by default, please make sure the port matches your environment. The JMX URL for the exporter should be properly configured to match your environment e.g. jmxUrl: service:jmx:rmi:///jndi/rmi://localhost:7199/jmxrmi
Once deployed, Grafana Alloy instance should be able to reach the JMX Exporter’s exposed endpoint in order to scrape metrics.
Install Apache Cassandra integration for Grafana Cloud
- In your Grafana Cloud stack, click Connections in the left-hand menu.
- Find Apache Cassandra and click its tile to open the integration.
- Review the prerequisites in the Configuration Details tab and set up Grafana Alloy to send Apache Cassandra metrics and logs to your Grafana Cloud instance.
- Click Install to add this integration’s pre-built dashboards and alerts to your Grafana Cloud instance, and you can start monitoring your Apache Cassandra setup.
Configuration snippets for Grafana Alloy
Advanced mode
The following snippets provide examples to guide you through the configuration process.
To instruct Grafana Alloy to scrape your Apache Cassandra instances, manually copy and append the snippets to your alloy configuration file, then follow subsequent instructions.
Advanced metrics snippets
prometheus.scrape "metrics_integrations_integrations_apache_cassandra" {
	targets = concat(
		[{
			__address__       = "<your-jmx-exporter-hostname:9000>",
			cassandra_cluster = "<your-cluster-name>",
			cluster           = "<your-k8s-cluster-name>",
			instance          = constants.hostname,
		}],
		[{
			__address__       = "<your-jmx-exporter-hostname:9001>",
			cassandra_cluster = "<your-cluster-name>",
			cluster           = "<your-k8s-cluster-name>",
			instance          = constants.hostname,
		}],
		[{
			__address__       = "<your-jmx-exporter-hostname:9002>",
			cassandra_cluster = "<your-cluster-name>",
			cluster           = "<your-k8s-cluster-name>",
			instance          = constants.hostname,
		}],
	)
	forward_to = [prometheus.remote_write.metrics_service.receiver]
	job_name   = "integrations/apache-cassandra"
}
To monitor your Apache Cassandra instance, you must use a discovery.relabel component to discover your Apache Cassandra Prometheus endpoint and apply appropriate labels, followed by a prometheus.scrape component to scrape it.
Configure the following properties within each discovery.relabel component:
__address__: The address to your Apache Cassandra Prometheus metrics endpoint.instancelabel:constants.hostnamesets theinstancelabel to your Grafana Alloy server hostname. If that is not suitable, change it to a value uniquely identifies this Apache Cassandra instance. Make sure this label value is the same for all telemetry data collected for this instance.cassandra_cluster: Thecassandra_clusterlabel to group your Apache Cassandra instances within a cluster. Set the same value for all nodes within your cluster.cluster: if you are running your Cassandra instance within a k8s cluster, set the name of it to allow k8s cluster grouping.
If you have multiple Apache Cassandra servers to scrape, configure one discovery.relabel for each and scrape them by including each under targets within the prometheus.scrape component.
Advanced logs snippets
darwin
local.file_match "logs_integrations_integrations_apache_cassandra" {
	path_targets = [{
		__address__       = "localhost",
		__path__          = "/var/log/cassandra/system.log",
		cassandra_cluster = "<your-cluster-name>",
		cluster           = "<your-k8s-cluster-name>",
		instance          = constants.hostname,
		job               = "integrations/apache-cassandra",
	}]
}

loki.source.file "logs_integrations_integrations_apache_cassandra" {
	targets    = local.file_match.logs_integrations_integrations_apache_cassandra.targets
	forward_to = [loki.write.grafana_cloud_loki.receiver]
}
To monitor your Apache Cassandra instance logs, you will use a combination of the following components:
local.file_match defines where to find the log file to be scraped. Change the following properties according to your environment:
__address__: The Apache Cassandra instance address__path__: The path to the log file.instancelabel:constants.hostnamesets theinstancelabel to your Grafana Alloy server hostname. If that is not suitable, change it to a value uniquely identifies this Apache Cassandra instance. Make sure this label value is the same for all telemetry data collected for this instance.cassandra_cluster: Thecassandra_clusterlabel to group your Apache Cassandra instances within a cluster. Set the same value for all nodes within your cluster.cluster: if you are running your Cassandra instance within a k8s cluster, set the name of it to allow k8s cluster grouping.
loki.source.file sends logs to Loki.
linux
local.file_match "logs_integrations_integrations_apache_cassandra" {
	path_targets = [{
		__address__       = "localhost",
		__path__          = "/var/log/cassandra/system.log",
		cassandra_cluster = "<your-cluster-name>",
		cluster           = "<your-k8s-cluster-name>",
		instance          = constants.hostname,
		job               = "integrations/apache-cassandra",
	}]
}

loki.source.file "logs_integrations_integrations_apache_cassandra" {
	targets    = local.file_match.logs_integrations_integrations_apache_cassandra.targets
	forward_to = [loki.write.grafana_cloud_loki.receiver]
}
To monitor your Apache Cassandra instance logs, you will use a combination of the following components:
local.file_match defines where to find the log file to be scraped. Change the following properties according to your environment:
__address__: The Apache Cassandra instance address__path__: The path to the log file.instancelabel:constants.hostnamesets theinstancelabel to your Grafana Alloy server hostname. If that is not suitable, change it to a value uniquely identifies this Apache Cassandra instance. Make sure this label value is the same for all telemetry data collected for this instance.cassandra_cluster: Thecassandra_clusterlabel to group your Apache Cassandra instances within a cluster. Set the same value for all nodes within your cluster.cluster: if you are running your Cassandra instance within a k8s cluster, set the name of it to allow k8s cluster grouping.
loki.source.file sends logs to Loki.
windows
local.file_match "logs_integrations_integrations_apache_cassandra" {
	path_targets = [{
		__address__       = "localhost",
		__path__          = "/var/log/cassandra/system.log",
		cassandra_cluster = "<your-cluster-name>",
		cluster           = "<your-k8s-cluster-name>",
		instance          = constants.hostname,
		job               = "integrations/apache-cassandra",
	}]
}

loki.source.file "logs_integrations_integrations_apache_cassandra" {
	targets    = local.file_match.logs_integrations_integrations_apache_cassandra.targets
	forward_to = [loki.write.grafana_cloud_loki.receiver]
}
To monitor your Apache Cassandra instance logs, you will use a combination of the following components:
local.file_match defines where to find the log file to be scraped. Change the following properties according to your environment:
__address__: The Apache Cassandra instance address__path__: The path to the log file.instancelabel:constants.hostnamesets theinstancelabel to your Grafana Alloy server hostname. If that is not suitable, change it to a value uniquely identifies this Apache Cassandra instance. Make sure this label value is the same for all telemetry data collected for this instance.cassandra_cluster: Thecassandra_clusterlabel to group your Apache Cassandra instances within a cluster. Set the same value for all nodes within your cluster.cluster: if you are running your Cassandra instance within a k8s cluster, set the name of it to allow k8s cluster grouping.
loki.source.file sends logs to Loki.
Kubernetes instructions
Before you begin with Kubernetes
Please note: These instructions assume the use of the Kubernetes Monitoring Helm chart
In order for the integration to properly work, you must set up the JMX Exporter for Prometheus on each node in your cluster.
Set up JMX Exporter
Each instance of the JMX Exporter can be run with this Apache Cassandra JMX Exporter configuration file.
For more information on how to configure the JVM on each node, please refer to the JMX Exporter documentation for further configuration details.
Apache Cassandra nodes by default expose 7199 for JMX by default, please make sure the port matches your environment. The JMX URL for the exporter should be properly configured to match your environment e.g. jmxUrl: service:jmx:rmi:///jndi/rmi://localhost:7199/jmxrmi
Configuration snippets for Kubernetes Helm chart
The following snippets provide examples to guide you through the configuration process.
To scrape your Apache Cassandra instances, manually modify your Kubernetes Monitoring Helm chart with these configuration snippets.
Replace any values between the angle brackets <> in the provided snippets with your desired configuration values.
Metrics snippets
Logs snippets
podLogs:
    extraDiscoveryRules: |-
        rule {
            source_labels = ["__meta_kubernetes_pod_label_<apache_cassandra_pod_label>"]
            regex = "<apache_cassandra_pod_label_value>"
            replacement = "apache_cassandra"
            target_label = "integration"
        }

    extraLogProcessingStages: |-
        stage.match {
            selector = "{integration=\\"apache_cassandra\\"}"

            stage.template {
                source   = "instance"
                template = "{{ .namespace }}-{{ .container }}"
            }

            stage.static_labels {
                values = {
                    cassandra_cluster = "<your-cassandra-cluster-name>",
                    job               = "integrations/apache-cassandra",
                }
            }

            stage.labels {
                values = {
                    instance = null,
                }
            }
        }
Grafana Agent static configuration (deprecated)
The following section shows configuration for running Grafana Agent in static mode which is deprecated. You should use Grafana Alloy for all new deployments.
Before you begin with Grafana Agent static
In order for the integration to properly work, you must set up the JMX Exporter for Prometheus on each node in your cluster.
Set up JMX Exporter
Each instance of the JMX Exporter can be run with this Apache Cassandra JMX Exporter configuration file.
For more information on how to configure the JVM on each node, please refer to the JMX Exporter documentation for further configuration details.
Apache Cassandra nodes by default expose 7199 for JMX by default, please make sure the port matches your environment. The JMX URL for the exporter should be properly configured to match your environment e.g. jmxUrl: service:jmx:rmi:///jndi/rmi://localhost:7199/jmxrmi
Once deployed, the Grafana Agent should be able to reach the JMX Exporter’s exposed endpoint in order to scrape metrics.
Install Apache Cassandra integration
- In your Grafana Cloud stack, click Connections in the left-hand menu.
- Find Apache Cassandra and click its tile to open the integration.
- Review the prerequisites in the Configuration Details tab and set up Grafana Agent to send Apache Cassandra metrics and logs to your Grafana Cloud instance.
- Click Install to add this integration’s pre-built dashboards and alerts to your Grafana Cloud instance, and you can start monitoring your Apache Cassandra setup.
Post-install configuration for the Apache Cassandra integration
After enabling the metrics generation, instruct the Grafana Agent to scrape your Apache Cassandra nodes.
Make sure to change targets in the snippet according to your environment.
You must configure a custom label for this integration:
cluster, the value that identifies a Apache Cassandra cluster
You can define a cluster label by adding an extra label to the scrape_configs of the JMX Exporter.
If you want to show logs and metrics signals correlated in your dashboards as a single pane of glass, ensure the following:
jobandinstancelabel values must match for the Apache Cassandra integration and logs scrape config in your agent configuration file.jobmust be set tointegrations/apache-cassandrainstancelabel must be set to a value that uniquely identifies your Apache Cassandra node. Please replace the default hostname value according to your environment - it should be set manually. Note that if you use localhost for multiple nodes, the dashboards will not be able to filter correctly by instance.cassandra_clustermust be the value that identifies the Apache Cassandra Cluster this node belongs to.
Configuration snippets for Grafana Agent
Below metrics.configs.scrape_configs, insert the following lines and change the URLs according to your environment:
    - job_name: integrations/apache-cassandra
      metrics_path: "/metrics"
      static_configs:
        - targets:
            - '<your-jmx-exporter-hostname:9000>'
            - '<your-jmx-exporter-hostname:9001>'
            - '<your-jmx-exporter-hostname:9002>'
          labels:
            cassandra_cluster: '<your-cluster-name>'
            cluster: '<your-k8s-cluster-name>'
            instance: '<your-instance-name>'
Below logs.configs.scrape_configs, insert the following lines according to your environment.
    - job_name: integrations/apache-cassandra
      static_configs:
        - targets: [localhost]
          labels:
            job: integrations/apache-cassandra
            instance: '<your-instance-name>'
            cassandra_cluster: <your-cluster-name>
            cluster: '<your-k8s-cluster-name>'
            __path__: /var/log/cassandra/system.log
Full example configuration for Grafana Agent
Refer to the following Grafana Agent configuration for a complete example that contains all the snippets used for the Apache Cassandra integration. This example also includes metrics that are sent to monitor your Grafana Agent instance.
Dashboards
The Apache Cassandra integration installs the following dashboards in your Grafana Cloud instance to help monitor your system.
- Apache Cassandra keyspaces
- Apache Cassandra nodes
- Apache Cassandra overview
Apache Cassandra overview 1

Apache Cassandra overview 2

Apache Cassandra nodes 1
Alerts
The Apache Cassandra integration includes the following useful alerts:
Metrics
The most important metrics provided by the Apache Cassandra integration, which are used on the pre-built dashboards and Prometheus alerts, are as follows:
- cassandra_cache_hitrate
- cassandra_cache_size
- cassandra_clientrequest_latency_seconds_count
- cassandra_clientrequest_timeouts_count
- cassandra_clientrequest_unavailables_count
- cassandra_compaction_pendingtasks
- cassandra_connection_largemessageactivetasks
- cassandra_connection_largemessagedroppedtasks
- cassandra_connection_largemessagependingtasks
- cassandra_connection_smallmessageactivetasks
- cassandra_connection_smallmessagedroppedtasks
- cassandra_connection_smallmessagependingtasks
- cassandra_connection_timeouts_count
- cassandra_down_endpoint_count
- cassandra_keyspace_caspreparelatency_seconds
- cassandra_keyspace_pendingcompactions
- cassandra_keyspace_readlatency_seconds
- cassandra_keyspace_readlatency_seconds_average
- cassandra_keyspace_readlatency_seconds_count
- cassandra_keyspace_repairjobscompleted_count
- cassandra_keyspace_repairjobsstarted_count
- cassandra_keyspace_totaldiskspaceused
- cassandra_keyspace_writelatency_seconds
- cassandra_keyspace_writelatency_seconds_average
- cassandra_keyspace_writelatency_seconds_count
- cassandra_keyspace_writelatency_seconds_sum
- cassandra_messaging_crossnodelatency_seconds
- cassandra_storage_load_count
- cassandra_storage_totalhints_count
- cassandra_table_maxpartitionsize
- cassandra_table_readlatency_seconds_count
- cassandra_table_readlatency_seconds_sum
- cassandra_threadpools_currentlyblockedtasks_count
- cassandra_up_endpoint_count
- jvm_gc_collection_count
- jvm_gc_duration_seconds
- jvm_memory_usage_used_bytes
- jvm_physical_memory_size
- jvm_process_cpu_load
- up
Changelog
# 1.0.2 - April 2024

* Updated to latest mixin to fix the Hints Stored alert

# 1.0.1 - March 2024

* Updated to latest Mixin to fix CPU and Memory Alert queries

# 1.0.0 - October 2023

* Updated existing cluster label to casandra_cluster label
* Added Grafana Agent Operator configuration snippet to support Apache Cassandra in kubernetes cluster
* Added cluster selector to dashboard for kubernetes support
* Added default cluster label to agent config
* Bump version to 1.0.0

# 0.0.3 - September 2023

* New Filter Metrics option for configuring the Grafana Agent, which saves on metrics cost by dropping any metric not used by this integration. Beware that anything custom built using metrics that are not on the snippet will stop working.
* New hostname relabel option, which applies the instance name you write on the text box to the Grafana Agent configuration snippets, making it easier and less error prone to configure this mandatory label.

# 0.0.2 - August 2023

* Add regex filter for logs datasource

# 0.0.1 - March 2023

* Initial release
Cost
By connecting your Apache Cassandra instance to Grafana Cloud, you might incur charges. To view information on the number of active series that your Grafana Cloud account uses for metrics included in each Cloud tier, see Active series and dpm usage and Cloud tier pricing.
Was this page helpful?
Related resources from Grafana Labs


