
Shipping PostgreSQL logs to Grafana Cloud with Grafana Agent
Caution
Grafana Alloy is the new name for our distribution of the OTel collector. Grafana Agent has been deprecated and is in Long-Term Support (LTS) through October 31, 2025. Grafana Agent will reach an End-of-Life (EOL) on November 1, 2025. Read more about why we recommend migrating to Grafana Alloy.
This guide shows you how to push logs from a PostgreSQL instance to Grafana Cloud using Grafana Agent. It also shows you how to search, explore, and view those logs.
Prerequisites
Before you begin, you should have the following available:
- A Grafana Cloud account, as shown in Get started
- A Linux machine
- PostgreSQL installed on your machine
- Grafana Agent installed on your Linux machine, as shown in the PostgreSQL integration for Grafana Cloud quickstart
Once you have these installed, you’re ready to begin with this guide.
Configure the agent to collect and send PostgreSQL logs
Since your Linux machine is already running the agent, configuring it to send logs is accomplished by modifying the agent configuration YAML file.
The agent configuration is stored in /etc/grafana-agent.yaml by default. Open the file and add a logs section.
The Agent configuration should look like this:
The configuration above locates and parses PostgresSQL server logs by using an embedded [Promtail](/docs/grafana-cloud/send-data/agent/static/configuration/logs-config/).
Make sure that the job and instance labels match for logs and metrics. This ensures that we can quickly dive from metrics graphs to corresponding logs for more details on what actually happened.
You can find more information on configuring the PostgreSQL integration in our PostgreSQL integration documentation.
Check that logs are being ingested into Grafana Cloud
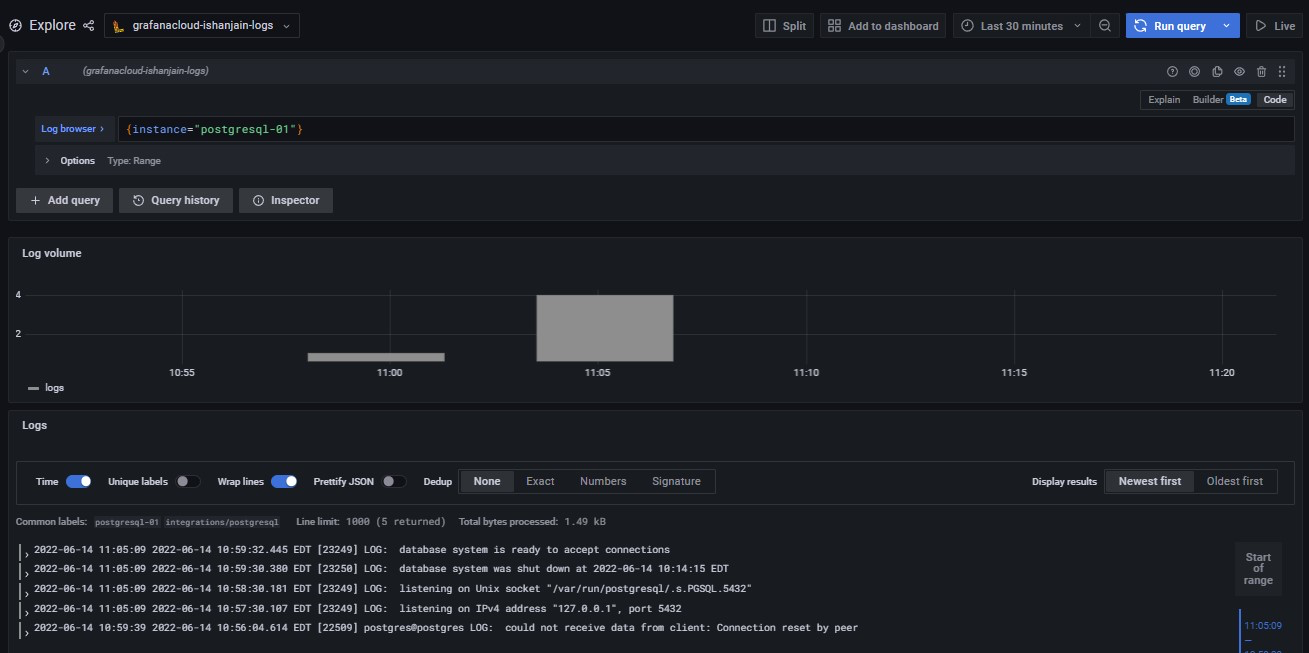
Logs should soon become available in Grafana Cloud. To test this, use the Explore feature. Click the Explore icon (looks like a compass) in the sidebar.
At the top of the page, use the dropdown menu to select your Loki logs data source.
In the Log Browser, Run the query {job="integrations/postgresql"}.
If no log lines appear, logs are not being collected. If you see log lines, this confirms that logs are being received.
If you can’t see logs after several minutes, check your steps for typos and check whether the agent is running on the Linux machine.
If everything is working correctly, you should see the following:
Conclusion
Complete instructions for creating a dashboard panel (indeed, multiple panels to create a dashboard) are available in the Grafana Add a panel documentation.
You can also use Pipelines to transform log lines, labels and timestamps.
Was this page helpful?
Related resources from Grafana Labs


