Monitoring a Linux host with Prometheus, Node Exporter, and Docker Compose
In this guide, you’ll learn how to run Prometheus and Node Exporter as Docker containers on a Linux machine, with the containers managed by Docker Compose. Docker Compose is a tool for defining and managing multi-container Docker applications. It uses YAML files to configure the application’s services and performs the creation and start-up process of all the containers with a single command. In combination, these tools allow you to collect detailed metrics from your Linux host, store them efficiently, and visualize them in a Grafana dashboard.
This guide will walk you through the process of setting up these tools to monitor your Linux host effectively.You’ll mount the relevant host directories into the Node Exporter and Prometheus containers, and configure Prometheus to scrape Node Exporter metrics and push them to Grafana Cloud. You’ll then install a preconfigured dashboard or create your own to visualize these system metrics.
Prerequisites
Before you begin you should have the following available:
- A Grafana Cloud account. To create an account, please see Grafana Cloud and click on Start for free.
- A Grafana Cloud Access Policy Token with the
metrics:writescope (permission) to send metrics to your Grafana Cloud Prometheus instance. - A Linux machine
- Docker and Docker Compose installed on your Linux machine
Step 1: Create the Compose file
In this step, you’ll create a docker-compose.yml file which will define our prometheus and node-exporter services, as well as our monitoring bridge network.
Open a file called docker-compose.yml in your favorite editor and paste in the following:
version: '3.8'

networks:
  monitoring:
    driver: bridge

volumes:
  prometheus_data: {}

services:
  node-exporter:
    image: prom/node-exporter:latest
    container_name: node-exporter
    restart: unless-stopped
    volumes:
      - /proc:/host/proc:ro
      - /sys:/host/sys:ro
      - /:/rootfs:ro
    command:
      - '--path.procfs=/host/proc'
      - '--path.rootfs=/rootfs'
      - '--path.sysfs=/host/sys'
      - '--collector.filesystem.mount-points-exclude=^/(sys|proc|dev|host|etc)($$|/)'
    expose:
      - 9100
    networks:
      - monitoring

  prometheus:
    image: prom/prometheus:latest
    container_name: prometheus
    restart: unless-stopped
    volumes:
      - ./prometheus.yml:/etc/prometheus/prometheus.yml
      - prometheus_data:/prometheus
    command:
      - '--config.file=/etc/prometheus/prometheus.yml'
      - '--storage.tsdb.path=/prometheus'
      - '--web.console.libraries=/etc/prometheus/console_libraries'
      - '--web.console.templates=/etc/prometheus/consoles'
      - '--web.enable-lifecycle'
    expose:
      - 9090
    networks:
      - monitoring
For the node-exporter service, we mount some necessary paths from the host into the container in :ro or read-only mode:
/proc/sys/
The prometheus service persists its data to a local directory on the host at ./prometheus_data. Docker Compose will create this directory after starting the prometheus container.
In the next step, we’ll create the Prometheus configuration file, which Compose will read from ./prometheus.yml.
Step 2: Create the Prometheus configuration file
In this step, you’ll configure Prometheus to scrape node-exporter metrics and ship them to Grafana Cloud. We’ll configure the following sections:
global: Global Prometheus config defaults. In this example, we set thescrape_intervalfor scraping metrics from configured jobs to 15 seconds.scrape_configs: Defined scrape jobs.remote_write: Configuration for Prometheus to send scraped metrics to a remote endpoint.
Create a Prometheus configuration file named prometheus.yml in the same directory as docker-compose.yml with the following:
global:
  scrape_interval: 1m

scrape_configs:
  - job_name: 'prometheus'
    scrape_interval: 1m
    static_configs:
      - targets: ['localhost:9090']

  - job_name: 'node'
    static_configs:
      - targets: ['node-exporter:9100']

remote_write:
  - url: '<Your Prometheus remote_write endpoint>'
    basic_auth:
      username: '<Your Grafana Username>'
      password: '<Your Grafana Cloud Access Policy Token>'
Edit this file to include your Grafana Cloud username, Access Policy token, and remote_write endpoint. You can find these in the Prometheus panel of the Cloud Portal.
Start the prometheus and node-exporter containers using the docker-compose command. Instruct Compose to run the containers in the background with the -d flag:
$ docker-compose up -dCreating network "root_monitoring" with driver "bridge"
Creating volume "root_prometheus_data" with default driver
. . .
Creating prometheus ... done
Creating node-exporter ... doneYou can get container status using docker-compose ps:
$ docker-compose ps Name Command State Ports
-----------------------------------------------------------------
node-exporter /bin/node_exporter --path. ... Up 9100/tcp
prometheus /bin/prometheus --config.f ... Up 9090/tcpVerify the status of prometheus by checking its logs. It should look something like this:
$ docker-compose logs -f prometheus. . .
prometheus | level=info ts=2021-08-09T21:33:36.913Z caller=main.go:1012 msg="Completed loading of configuration file" filename=/etc/prometheus/prometheus.yml totalDuration=1.811787ms remote_storage=385.158µs web_handler=479ns query_engine=883ns scrape=885.52µs scrape_sd=40.728µs notify=1.09µs notify_sd=1.44µs rules=1.209µs
prometheus | level=info ts=2021-08-09T21:33:36.913Z caller=main.go:796 msg="Server is ready to receive web requests."
prometheus | ts=2021-08-09T21:33:44.544Z caller=dedupe.go:112 component=remote level=info remote_name=cd5833 url=https://prometheus-blocks-prod-us-central1.grafana.net/api/prom/push msg="Done replaying WAL" duration=7.632082491sVerify the status of node-exporter by checking its logs. It should look something like this:
$ docker-compose logs -f node-exporter. . .
node-exporter | level=info ts=2021-08-09T21:33:36.852Z caller=node_exporter.go:115 collector=vmstat
node-exporter | level=info ts=2021-08-09T21:33:36.852Z caller=node_exporter.go:115 collector=xfs
node-exporter | level=info ts=2021-08-09T21:33:36.852Z caller=node_exporter.go:115 collector=zfs
node-exporter | level=info ts=2021-08-09T21:33:36.852Z caller=node_exporter.go:199 msg="Listening on" address=:9100
node-exporter | level=info ts=2021-08-09T21:33:36.852Z caller=tls_config.go:191 msg="TLS is disabled." http2=falseYou can now move on to querying these metrics from Grafana Cloud.
Step 3: Verify that metrics are being ingested
In this step, you’ll query your Prometheus metrics from Grafana Cloud.
Click Explore in the left-side menu to start. This will take you to the Explore view:
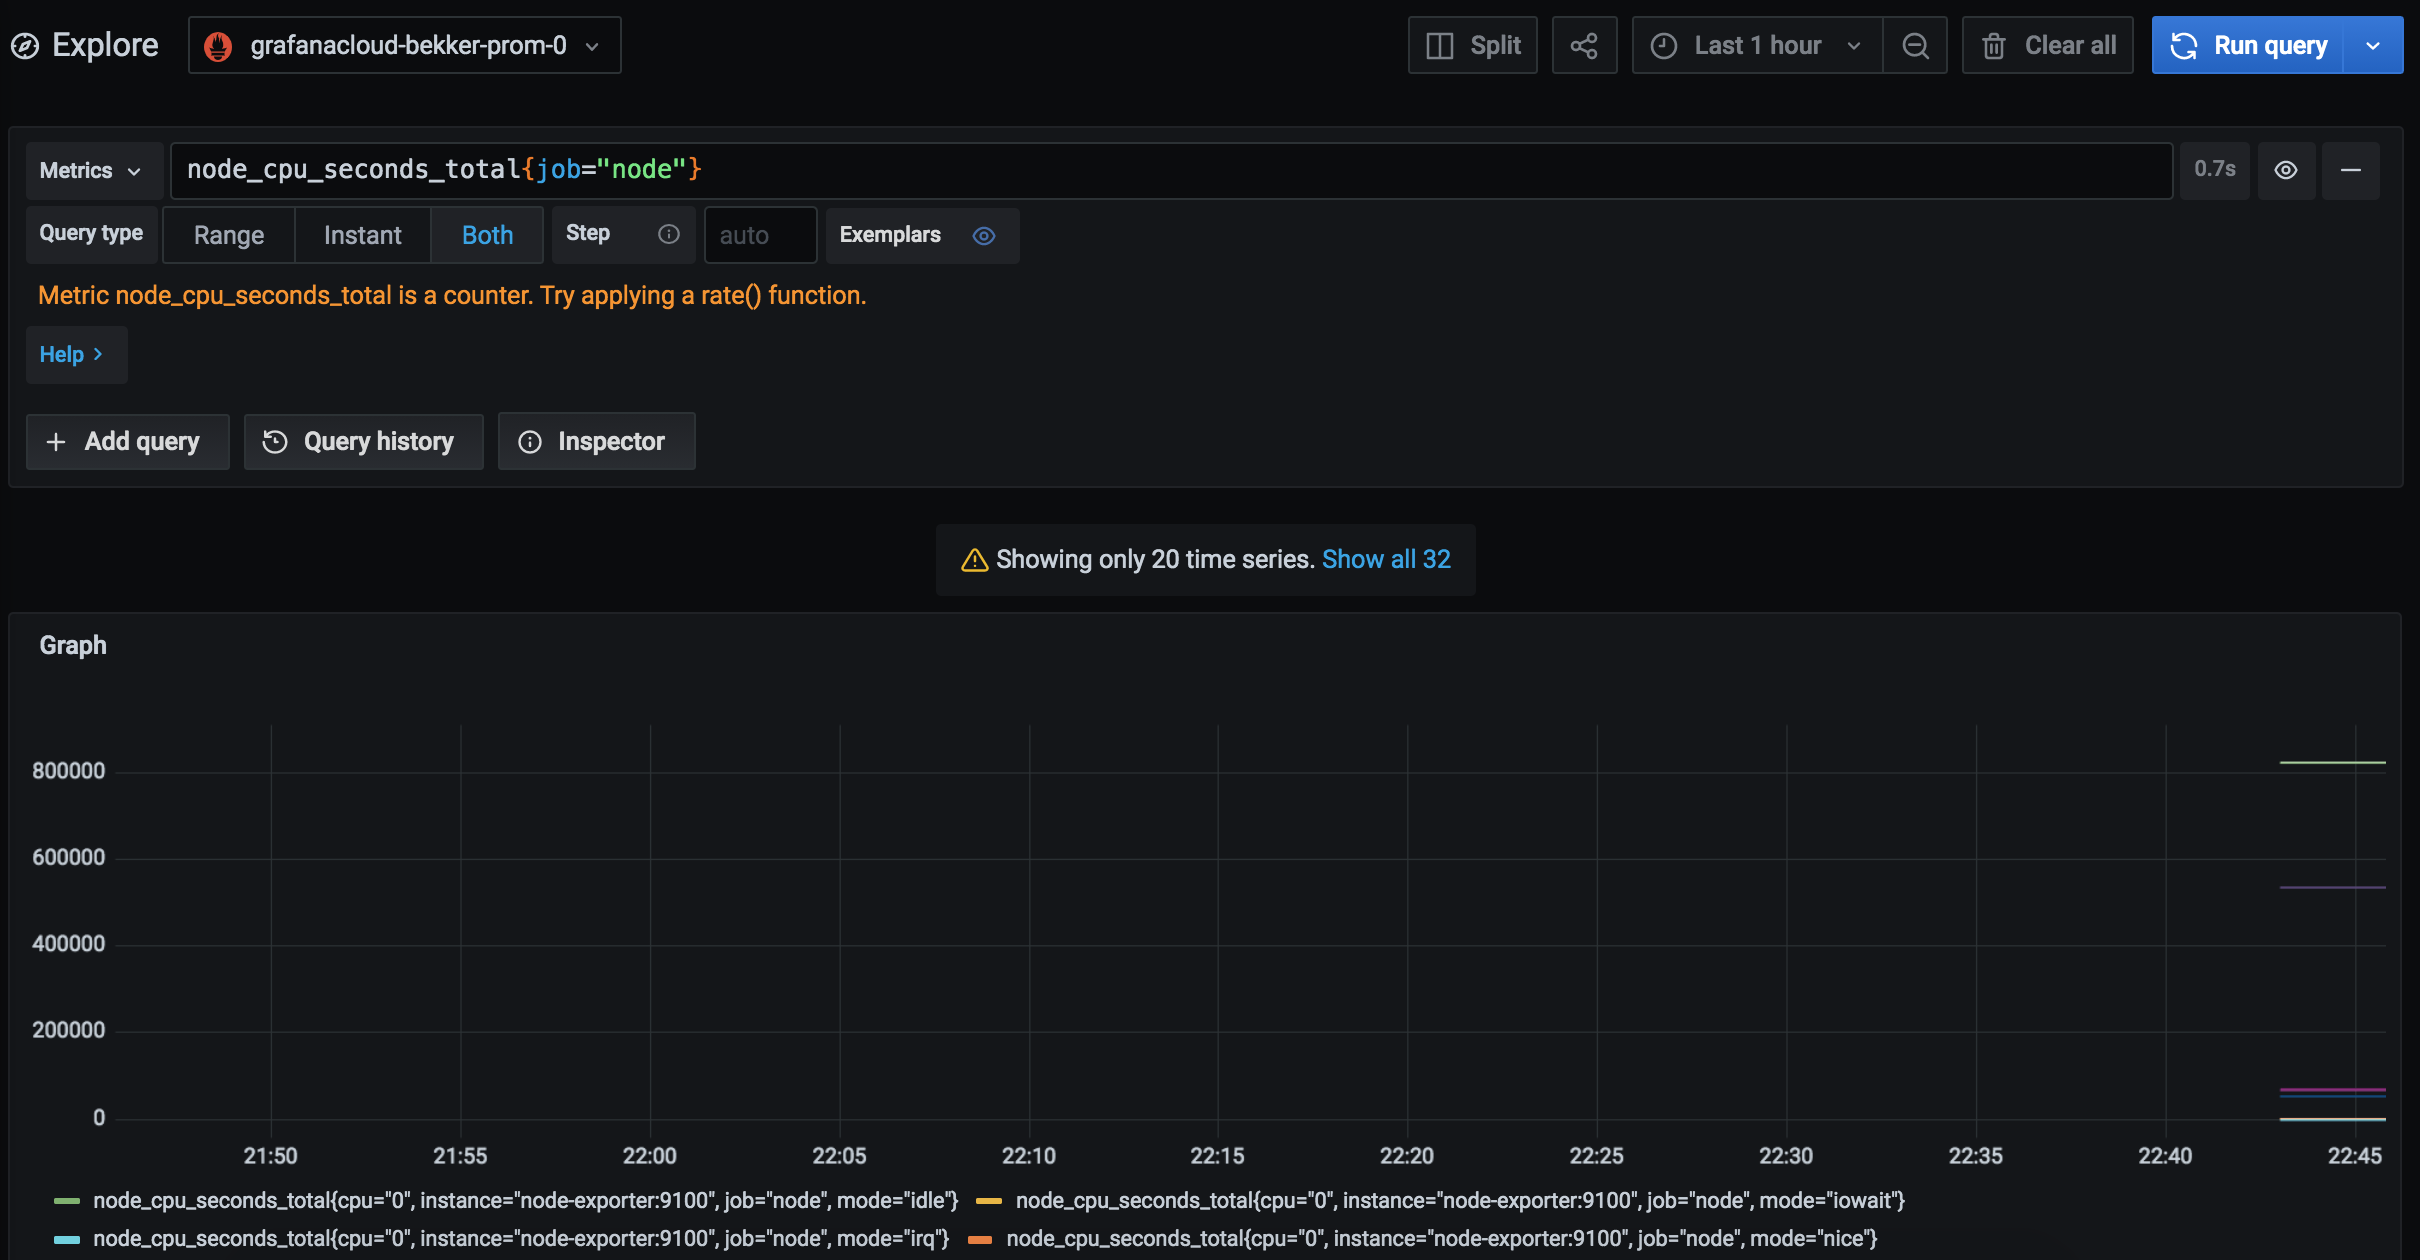
At the top of the page, use the dropdown menu to select your Prometheus data source.
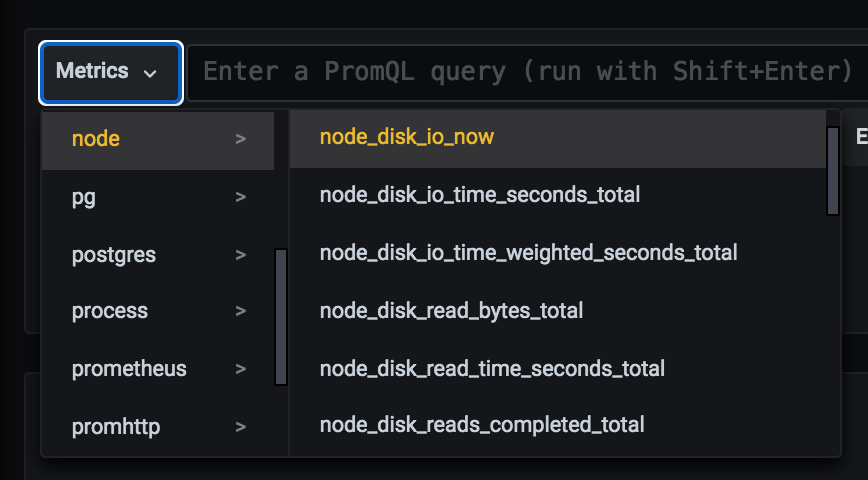
Use the Metrics browser to find the node_disk_io_now metric, then click on the job label and node label value. Recall that we set the job_name to node in our prometheus.yml configuration file.
If you cannot see metrics in the dropdown, metrics are not being ingested. You can also confirm ingestion by navigating to the billing dashboard.
If metrics do not appear after several minutes, check your work for typos, and make sure that both prometheus and node-exporter containers are running with the docker-compose ps command. Troubleshoot the logs with docker-compose logs -f .
Step 4: Configure a dashboard
In this step you’ll import a Grafana dashboard into your managed Grafana instance.
Official and community-built dashboards are listed on the Grafana website Dashboards page. Dashboards on this page will include information in the Overview tab about required configurations you may need to get the dashboard to work.
In this quickstart, we’ll use the Node Exporter Full dashboard. Note the dashboard’s ID: 1860.
In Grafana, click on Dashboards in the left-side menu to go to the Dashboards page.
Click New and select Import in the dropdown menu. Enter the dashboard’s ID and click Load. Select the appropriate Prometheus data source, and then click on Import.
Depending on your node exporter configuration, some panels may not function correctly. To learn how to configure node exporter to emit the required metrics, please see the node_exporter GitHub repo.
You can learn more about migrating and exporting dashboard in Export and import from the Grafana Cloud docs.
Conclusion
In this guide, you set up Prometheus and Node Exporter as Docker containers on a Linux machine to emit and scrape host metrics, with the containers managed by Docker Compose. You then imported a dashboard into your hosted Grafana instance to visualize and query these metrics.
From here, you can build additional panels and dashboards, and scrape metrics from other containers and systems. To learn more about building dashboards, please see Build dashboards from the Grafana docs.


