Optimize resource usage and efficiency
Kubernetes resources that aren’t optimized can significantly impact both budget and performance:
- An underprovisioned Kubernetes infrastructure leads to lagging, underperforming, unstable, or non-functioning applications.
- An overprovisioned infrastructure becomes costly.
To manage CPU, RAM, and storage, and mitigate the threat of an unstable infrastructure, you must:
- Ensure that there are enough allocated resources. This decreases the risk of Pod or container eviction as well as undesired performance of your microservices and applications.
- Eliminate unused or stranded resources.

Identify and prioritize efficiency issues
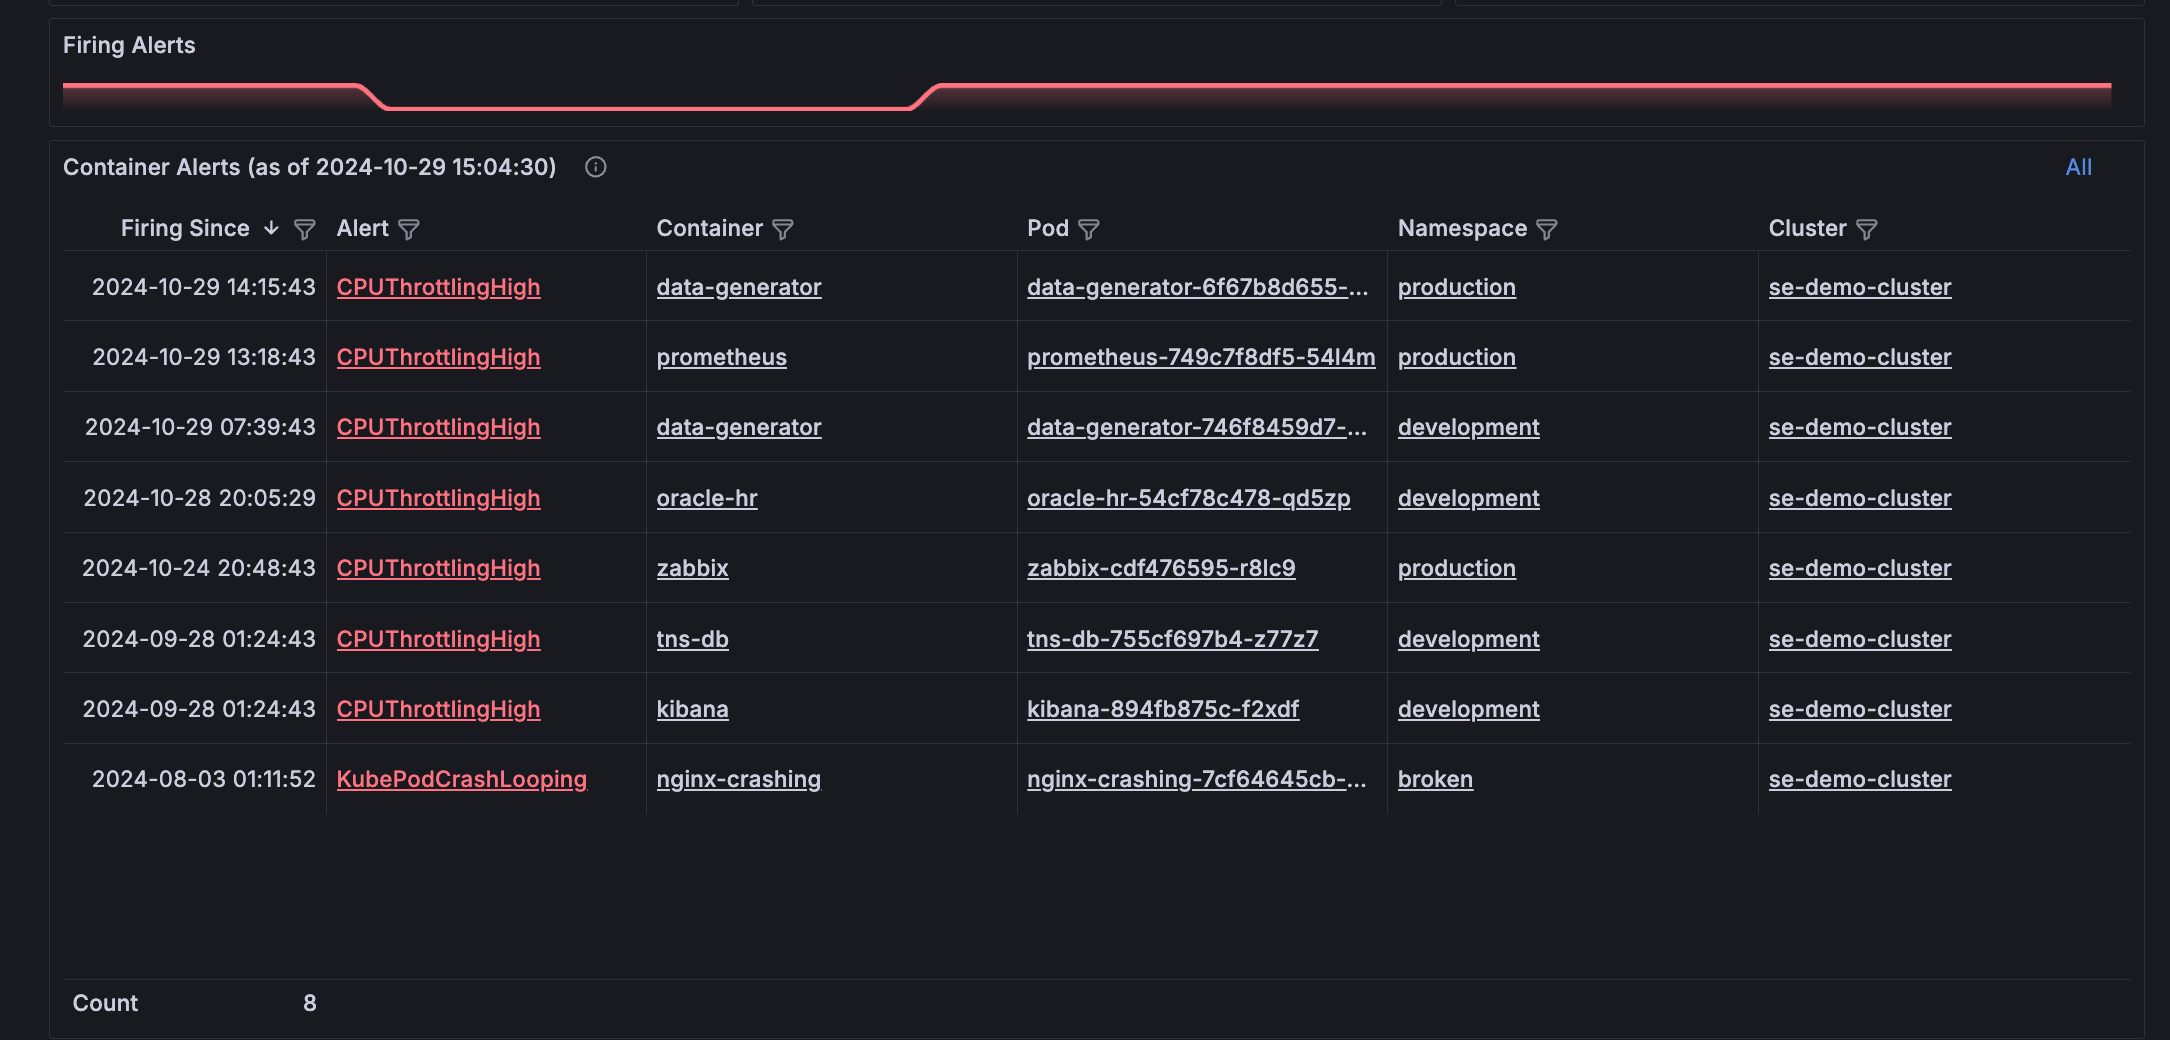
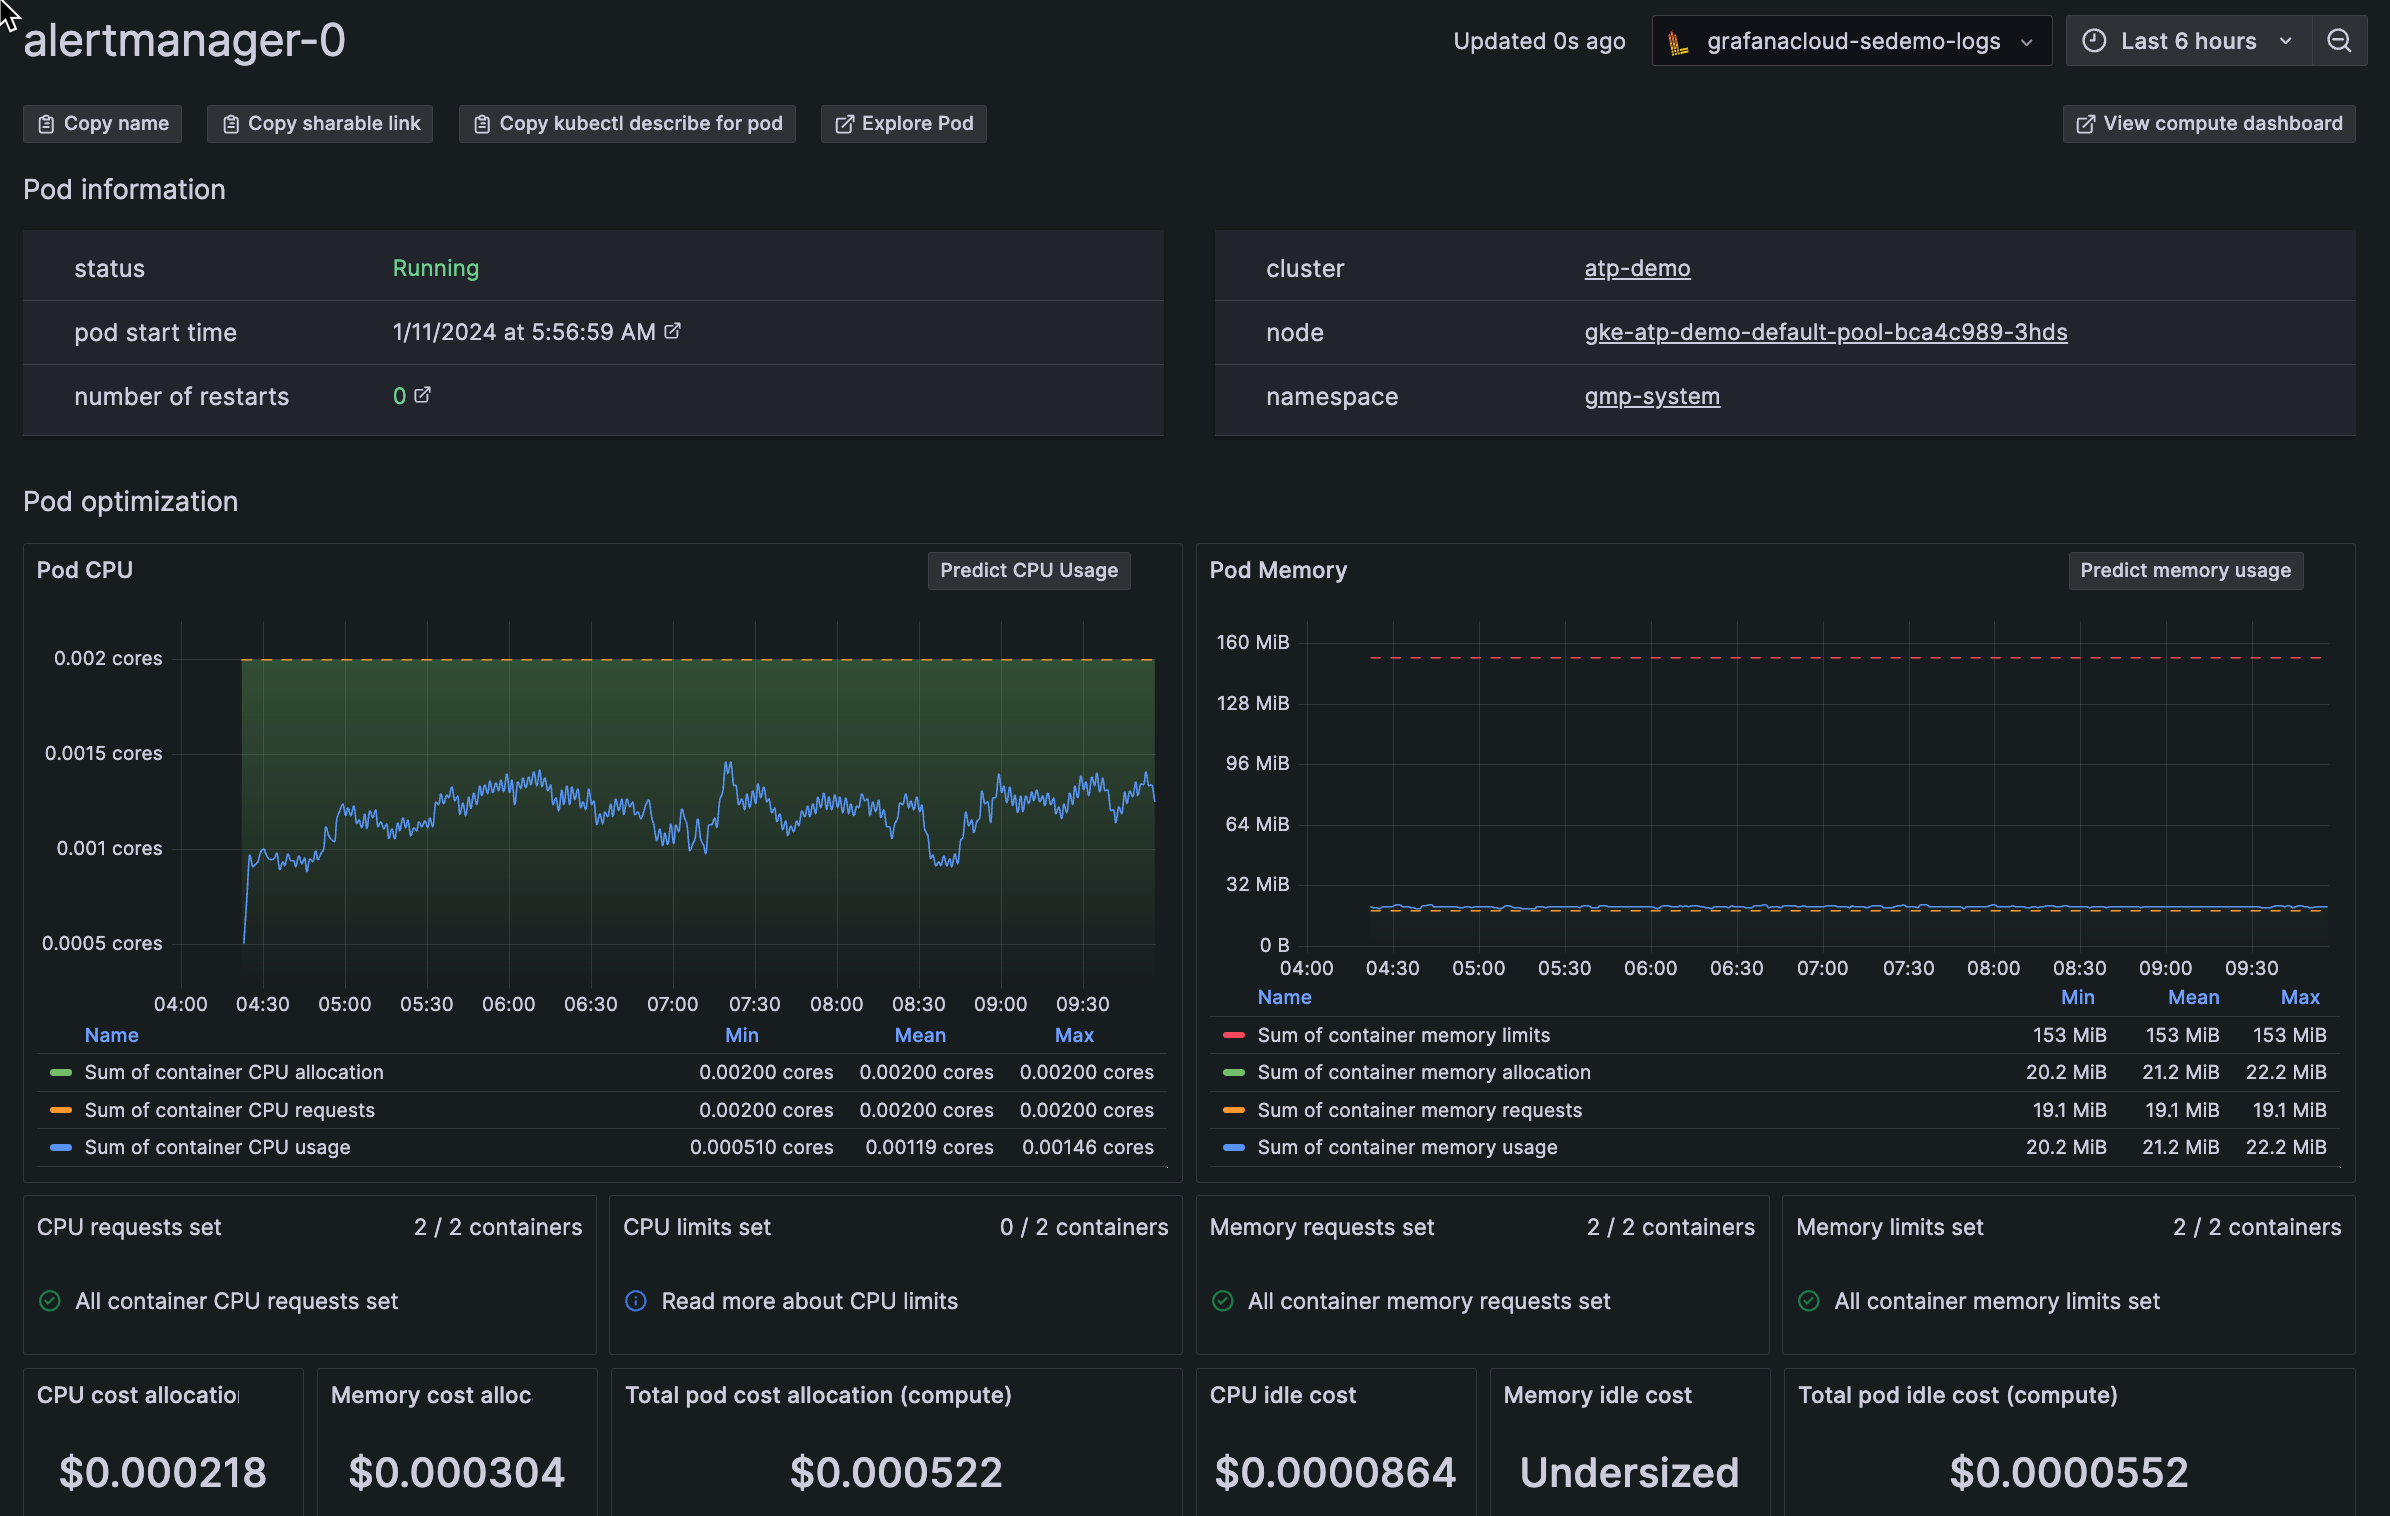
With Kubernetes Monitoring, you can effectively identify, prioritize, and handle efficiency-related issues. For example, start at the Kubernetes Overview page or the Alerts page to find containers that are causing alerts to fire due to exceeded thresholds for CPU requests and limits.
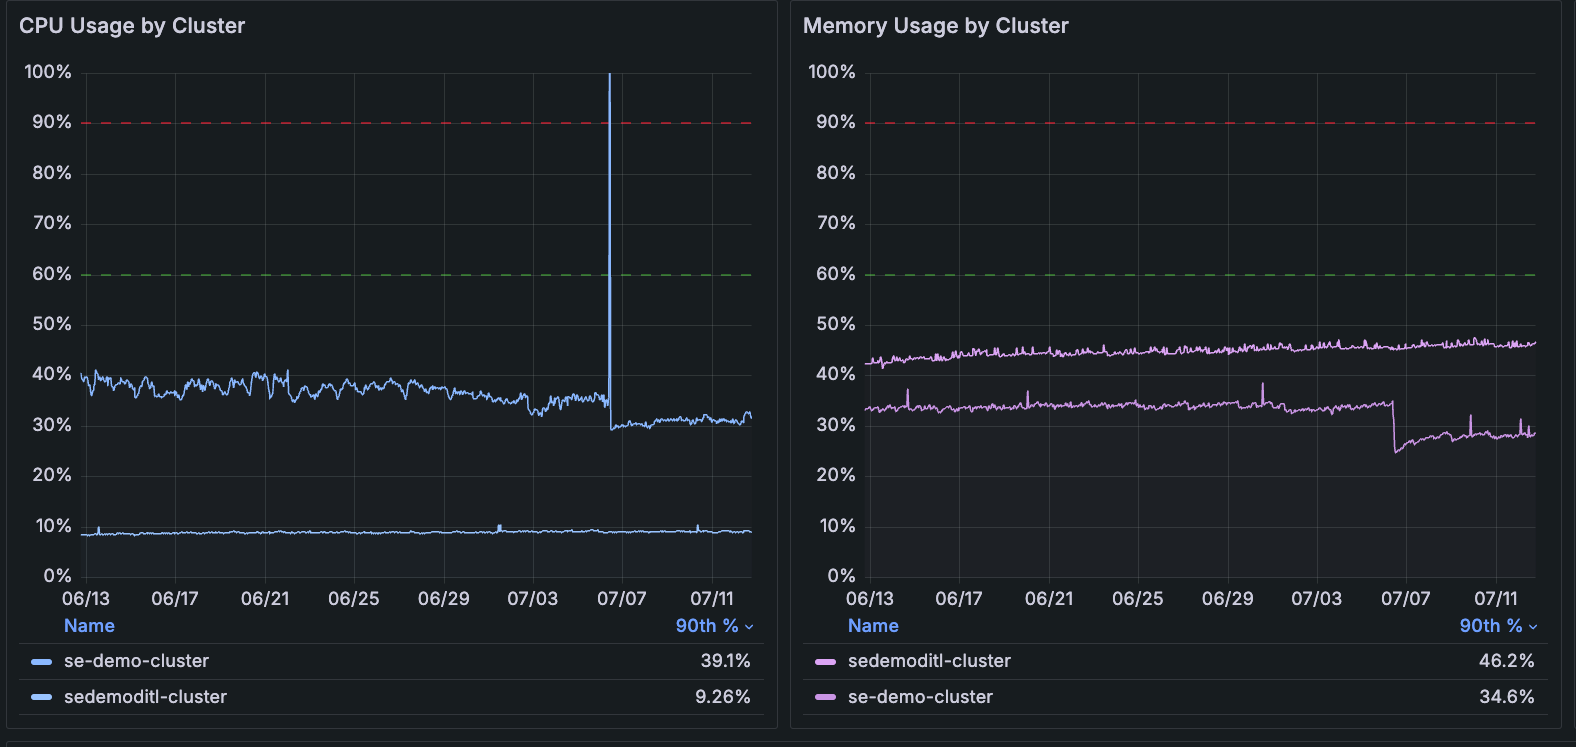
Use the CPU and memory usage graphs on the Kubernetes Overview page to discover usage spikes and jump directly to a Cluster.
Create an efficiency feedback loop
With Kubernetes Monitoring, you can discover:
- Resource-intensive workloads and Pods
- Unused and stranded resources in your fleet
- Stability issues created by incorrect configuration of requests and limits for CPU and memory usage
- How current data compares with historical data using the time range selector
Using this data, you can:
- Iteratively solve problems caused by incorrect configuration.
- Improve Pod and namespace placement to optimize the usage of the resources already available.
- Manage the availability of resources among your Clusters.
- Identify imperfections in resource management policy.
View efficiency data throughout the app
In any list view, you can find, filter, and sort maximum values for CPU and memory usage.
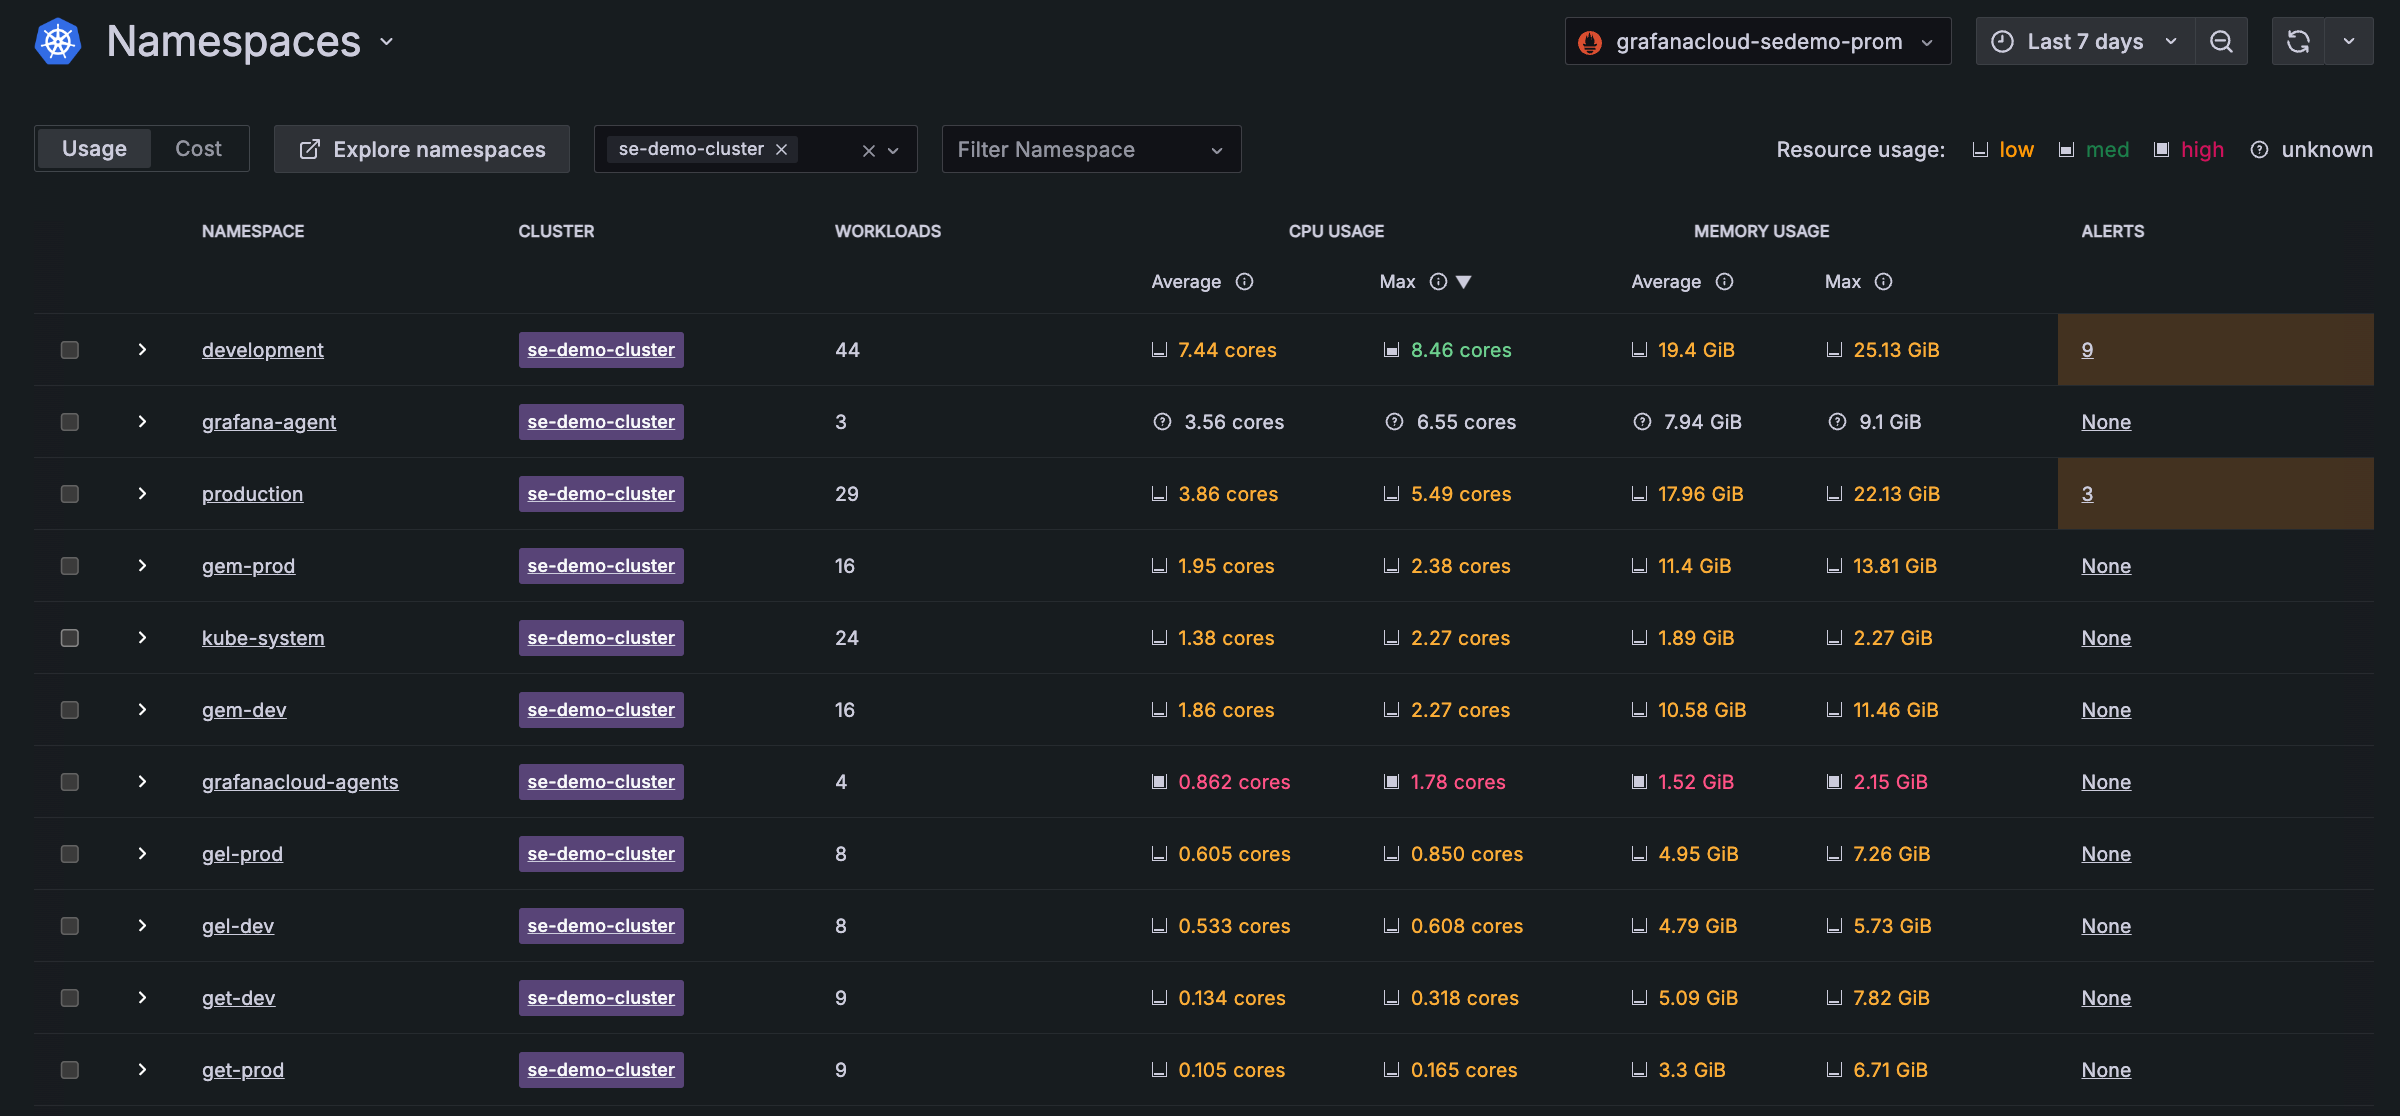
With Grafana Play, you can explore and see how it works, learning from practical examples to accelerate your development. This feature can be seen on this workloads list page.
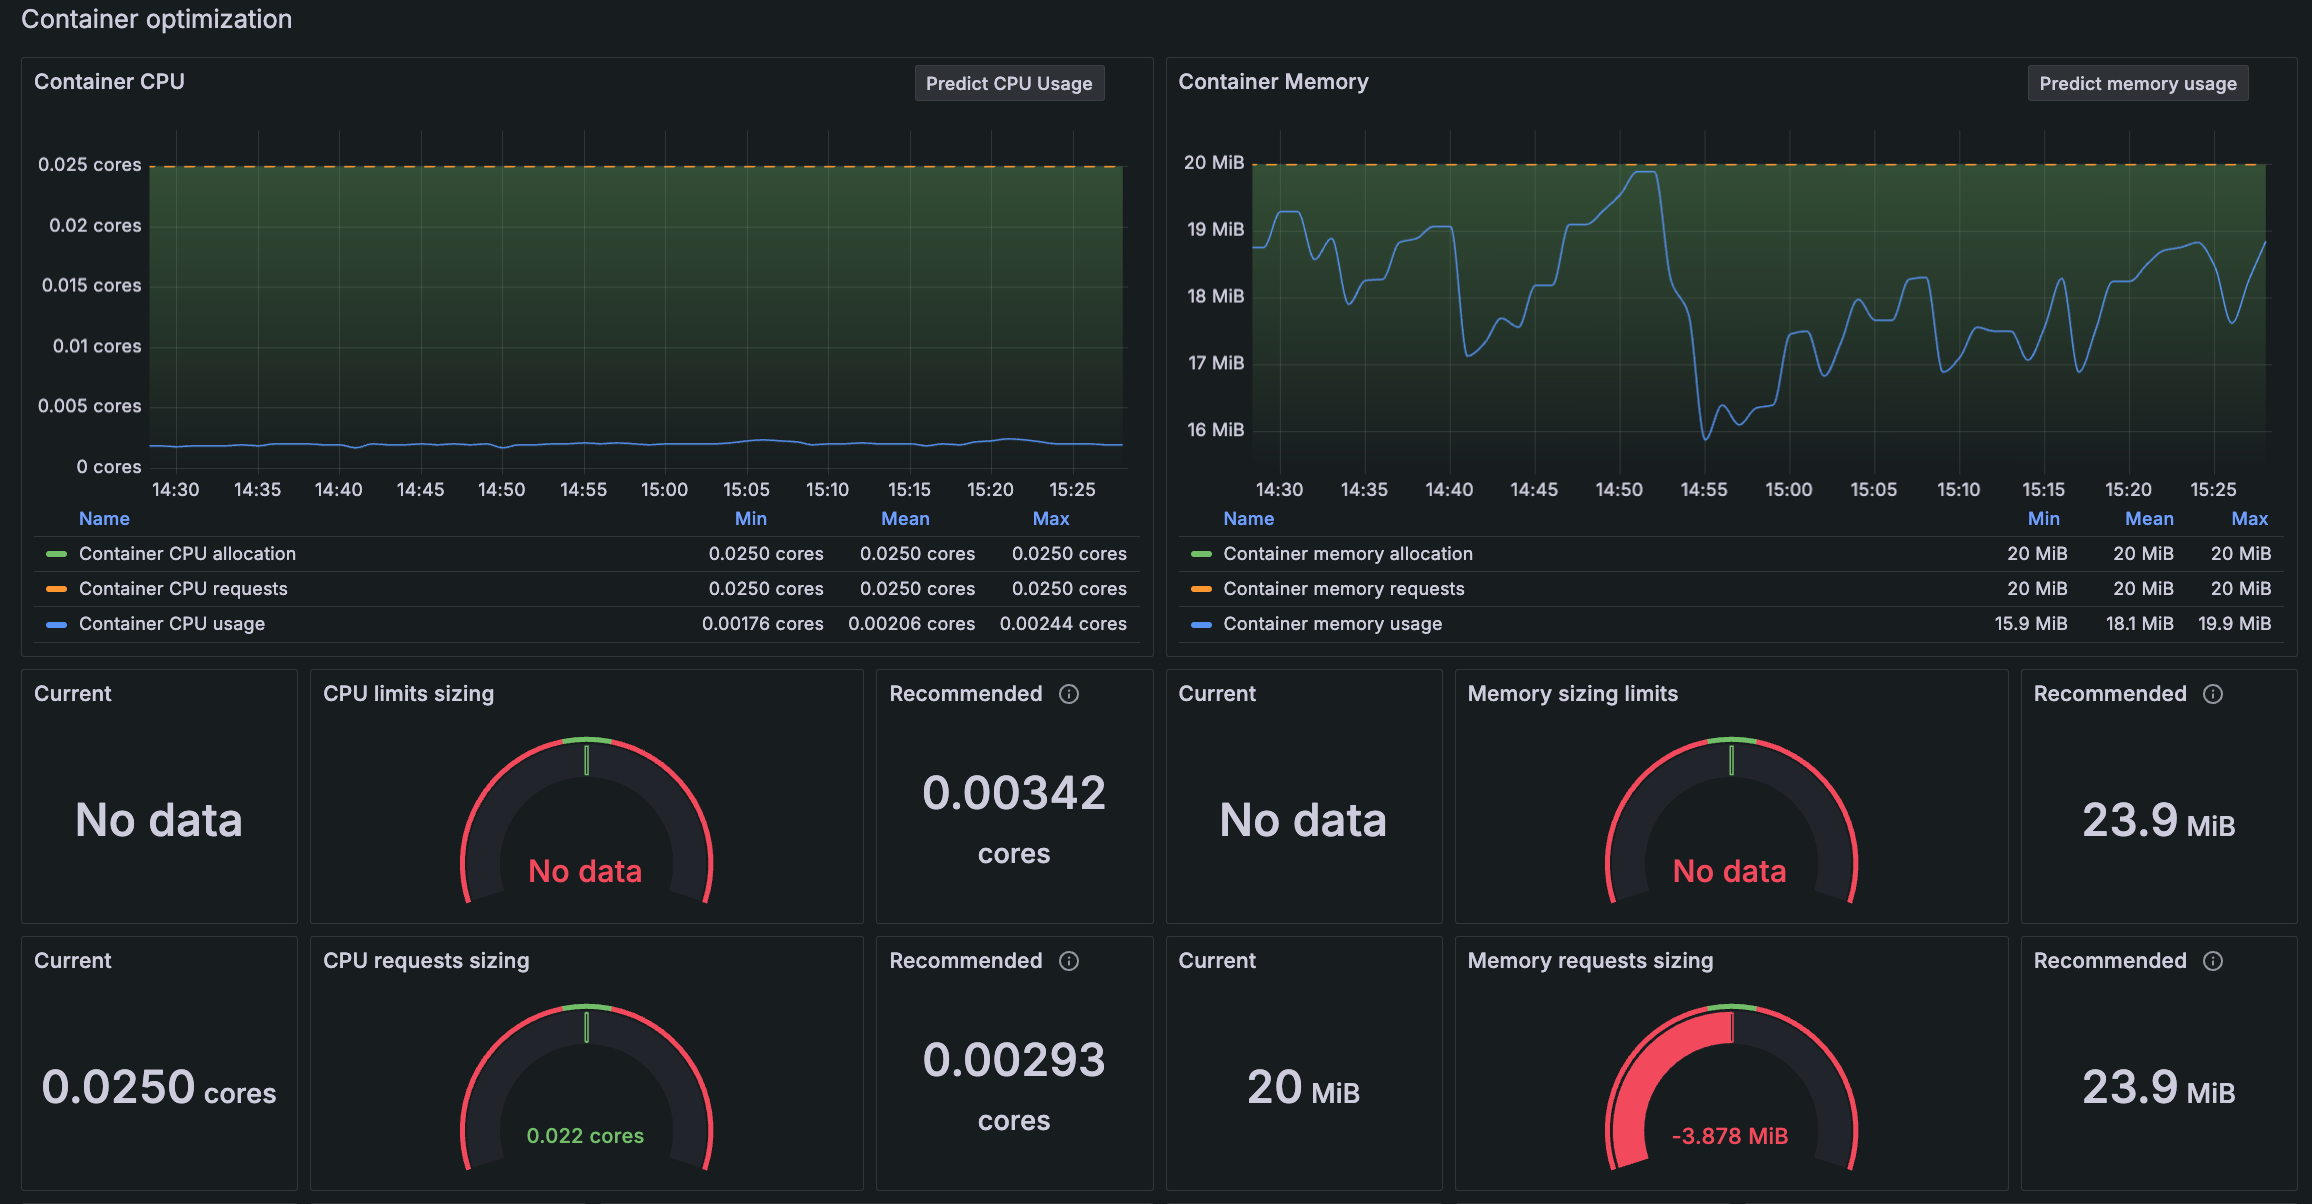
Detail views also reveal efficiency data and recommendations, so you can optimize resource usage.
Discover usage over time
Use the time range selector to identify resource usage peaks and avoid performance degradation.
What is calculated
Kubernetes Monitoring uses the following to determine the calculation of unused resources, stranded resources, and resource limits:
Unused resources: The average percentage of CPU, RAM, and storage that remain untouched for a certain period. When calculating unused resources, any momentary peaks in resource usage are averaged over the time window. These peaks can be above what’s expected at certain times. Calculations use resource requests set in your Kubernetes environment per best practices.
Stranded resources: Resources that become unusable due to bad Pod placement. When too many CPU-intensive Pods exist in one Node, this strands RAM. Even if RAM is available and not used, the scheduler won’t assign these Pods due to insufficient CPU in the Node. For example:
![Example of evicted pod Diagram of two nodes depicting stranded pods]()
Example of evicted pod In this example, the team:
- Paid for 10 GB RAM and 10 CPU (5 per Node per resource type)
- Needed 8 GB RAM and 9 CPU
- Used 5 GB RAM and 8 CPU
- Still had their Pod evicted
Resource limits: The Kubernetes configuration that provides minimum and maximum resource constraints for a Pod or container.


