Integrate Frontend Observability with Application Observability
Connect frontend user experiences with backend performance by integrating Real User Monitoring (RUM) with Application Performance Monitoring (APM). This integration provides end-to-end visibility into request lifecycles, enabling you to trace performance issues from the browser through backend services and quickly identify whether problems originate in the frontend, network, or server-side code.
End-to-end observability is crucial for understanding the performance and health of modern web applications, spanning from a browser through the network and services.
Before you begin
- Enable Application Observability and configure services to report into it.
- Configure the Faro Web SDK to collect Real User Monitoring data and enable the web-tracing package.
- You must have access to the server-side code and a basic understanding of how it works.
To create the relevant shared context, complete the following steps:
Include the OpenTelemetry SDK in the workload
Ensure that you include the OpenTelemetry API package for the specific programming language. For example in a NodeJS app, include the @opentelemetry/api package.
Server-side requirements
Your backend services must send a server-timing header with a traceparent field in their HTTP responses. You can usually complete this step within middleware or request handlers.
The desc field should be the traceparent of the root span that produced the request.
Example:
Server-Timing: traceparent;desc="00-12345-6789123456-01"
Node.js example
The following code displays an example for the express framework to illustrate how you can use a middleware to send the correlation headers:
import { trace } from '@opentelemetry/api';

app.use((req, res, next) => {
  const current = trace.getActiveSpan();

  // set server-timing header with traceparent
  if (current) {
    res.headers.set(
      'server-timing',
      'traceparent;desc="00-${current.spanContext().traceId}-${current.spanContext().spanId}-01"'
    );
  }

  next();
});
Verify
You can verify the configuration by viewing the responses that your service sends back to the client.
If the responses contain a server-timing header with a traceparent field, this indicates a successful configuration.
Strong correlation between server-side and client-side telemetry
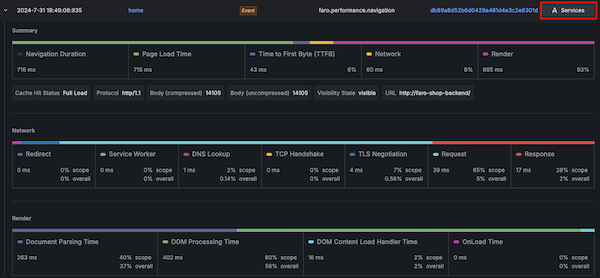
After the server sends a server-timing header, the RUM instrumentation automatically picks it up. From the user session view, you can navigate directly to the trace that generated the response.
In this example, the initial navigation links to the request loading the page. Click the Services action to the right of the row to continue the investigation in the Application Observability space.
Note
If the Services action doesn’t appear and a Logs or Traces action becomes visible for a navigation entry or for HTTP requests, this indicates that you haven’t satisfied one of the aforementioned preconditions or that there’s a gap in the backend instrumentation.
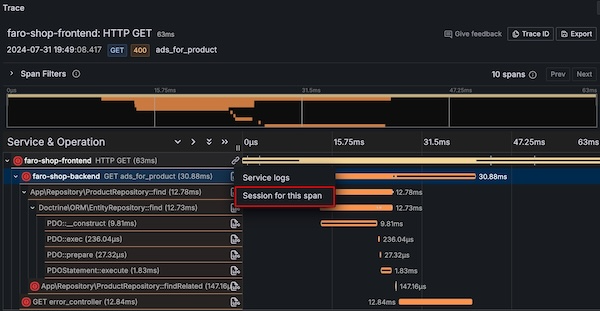
In Application Observability, Grafana Cloud’s managed service for APM, you can select a trace that starts in the frontend and navigate back to the same user-session in Frontend Observability to understand the timeline of events and user-context.
Next steps
- Explore root cause analysis using the knowledge graph to understand system-wide issues
- Create alerts to monitor both frontend and backend performance
- Review user sessions to understand the full user journey context


