Detect outliers in a group
Outlier detection helps you identify when members of a group behave differently from the rest, so you can spot anomalies early and take action.
Outlier detection works best when all members of the group behave similarly.
For example, it can alert when one instance in a cluster uses significantly more CPU than others, enabling proactive troubleshooting and prevention.
The following sections walk you through how to create outlier detectors in Grafana Cloud.
Create an outlier detector
To create an outlier detector, you need an Editor or Admin basic role.
Then, click AI & machine learning -> Outlier detection + Outlier detector.
Define the query
The outlier detector query determines which series are compared and, more importantly, what defines the baseline group.
The query must meet the following requirements:
- Query one of the Grafana Machine Learning supported data sources
- Return at least three series
For the most effective outlier detection, filter the query so that the baseline group has similar behavior.
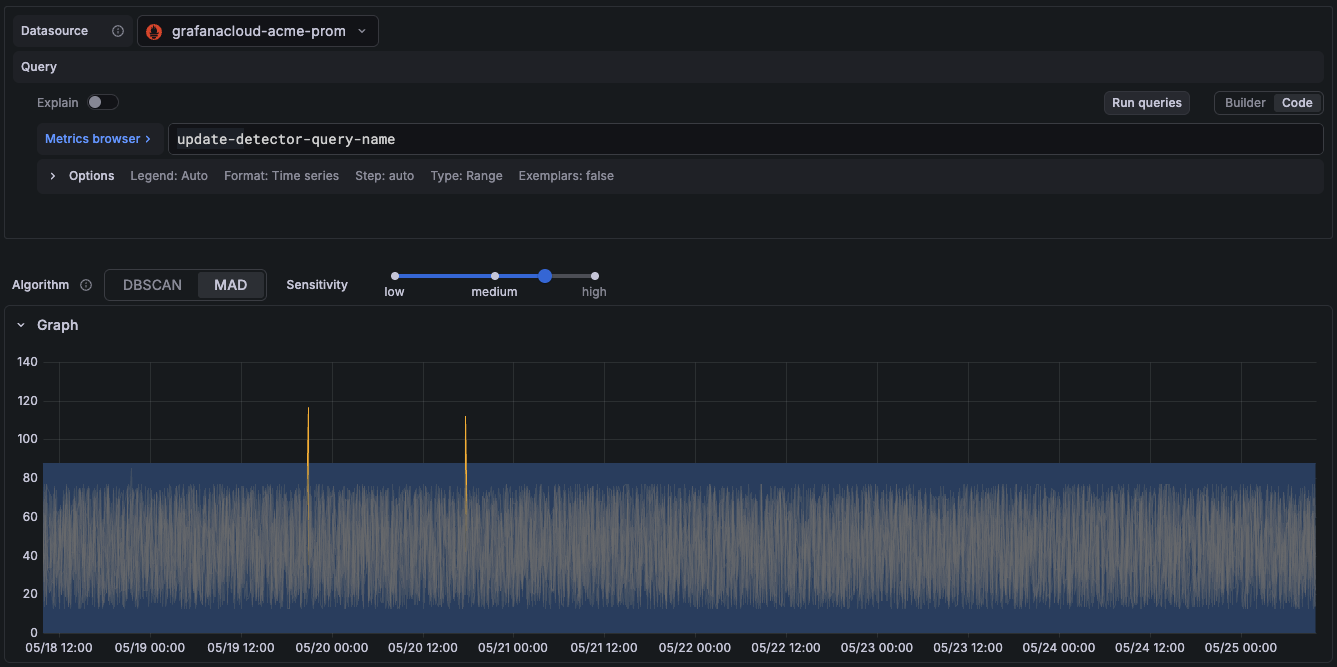
Choose the detection algorithm
The detection algorithm determines how the detector calculates distances between series and what behavior is considered normal within the group.
The supported algorithms are:
DBSCAN (Density-Based Spatial Clustering of Applications with Noise)
Use DBSCAN when you expect series to move together over time or share strong trends.
DBSCAN clusters data points based on their density and relative distance, and flags a series when its data points fall outside the largest cluster. The algorithm works over a rolling window, so the band of normal behavior adapts continuously as the data changes.
MAD (Median Absolute Deviation)
Use MAD when you expect series to remain within a relatively stable band of normal behavior.
MAD evaluates each data point against the rolling 24-hour median and flags a series when the deviation exceeds the configured sensitivity threshold. It’s less affected by temporary out-of-sync events, such as instances restarting at different times.
DBSCAN compares values against an adaptive group, while MAD compares values against a stable statistical baseline derived from the last 24 hours.
From the query builder, choose the detection algorithm that best fits your system and use case.
Tune sensitivity
The sensitivity setting controls how aggressively the detector flags outliers.
- Low: Flags only the most extreme deviations. Use this when the group has natural variation and you want to avoid noise.
- Medium: A balanced threshold suitable for most use cases.
- High: Flags smaller deviations. Use this when the group normally behaves very consistently and any deviation is meaningful.
You can configure the sensitivity using the sensitivity bar. If outliers are going undetected, increase the sensitivity. If too many outliers are being flagged, lower it.
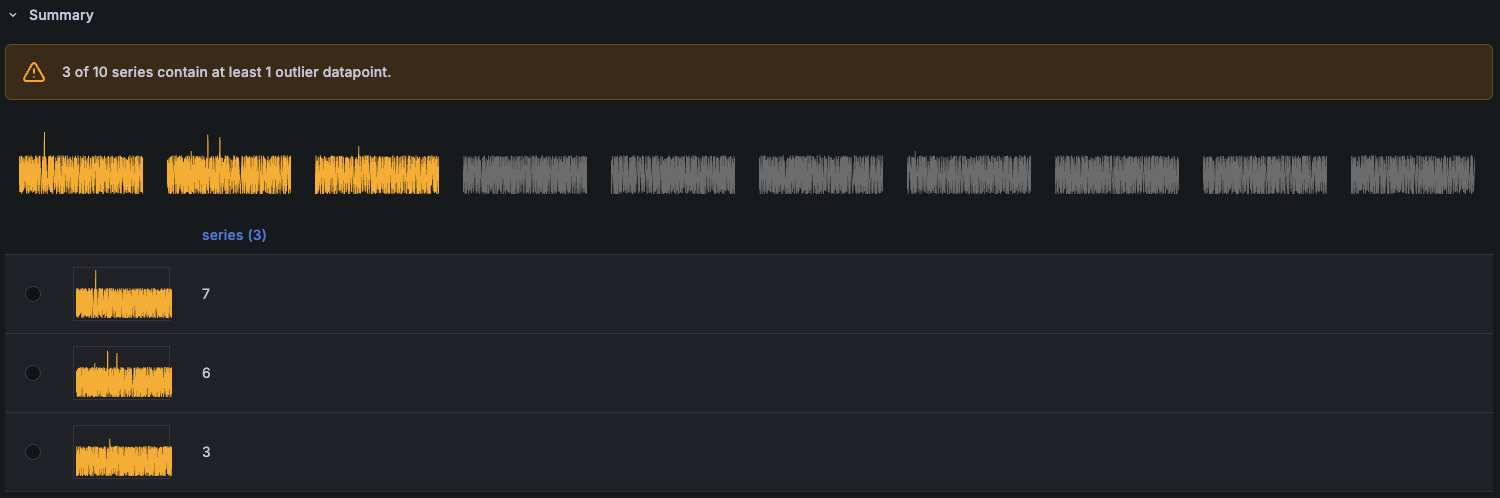
Run detectors
In the Outlier detector view and edit pages, the Summary section displays all returned series and highlights the series containing outliers.
Outlier detectors do not have a training schedule. They are evaluated every time Grafana queries them or when their settings change.
Next steps
Each detector creates a new <outlier_detector>:outliers metric that you can query and use in alert rules to detect outliers.
For more information, refer to View, query, and alert on outlier detectors


