Use label-based access control (LBAC) with access policies
Label-based access control (LBAC) creates access policies that allow you to query only the metrics or logs data that meet specific label requirements. The feature allows you to associate multiple sets of Prometheus label selectors with a policy. As a result, queries only return data that match at least one of the provided selectors. This correlates to the disjunctive normal form, which allows you to express any required policy.
Label selectors for access policies can only be used with read permission for metrics and logs.
Label selectors can be configured using the Grafana Cloud Access Policies API or Grafana Cloud Access Policies page within a stack or on the Cloud Portal.
Set up a label selector policy
Label selectors are set when you create or modify an access policy.
- Click the Create access policy button.
- Fill in the Display name field with the access policy name.
- Select the
logs:readand/ormetrics:readscope. - Click the Add label selector button and add a label selector.
- Click the Create button.
Exclude a label
One common use case for creating a LBAC policy is to exclude logs or metrics that have a specific label.
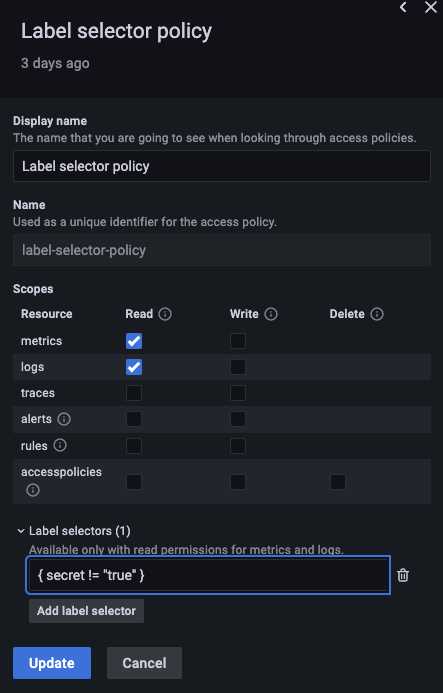
For example, you can create a label policy that excludes all log lines with the label secret=true by adding a selector with secret!="true" when you create an access policy:

Use multiple selectors
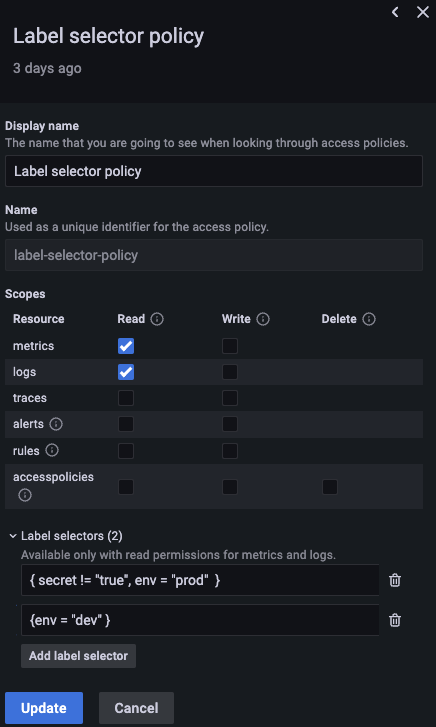
To create a policy that allows someone to access the production and development environments and excludes logs and/or metrics with the label secret=true in the production environment, use multiple selectors.

{secret!="true", env="prod"} and {env="dev"} enforce the policy:- The selector
{secret!="true", env="prod"}matches and returns log and metrics lines from the production environment that do not have thesecret: truelabel. - The selector
{env="dev"}matches and returns log and metrics lines from the development environment, even if they have thesecret: truelabel.


