Kafka integration for Grafana Cloud
Apache Kafka is an open-source distributed event streaming platform used by thousands of companies for high-performance data pipelines, streaming analytics, data integration, and mission-critical applications.
This integration includes 14 useful alerts and 7 pre-built dashboards to help monitor and visualize Kafka metrics and logs.
Before you begin
For the integration to work, you must configure a JMX exporter on each instance composing your Kafka Cluster, including all brokers, zookeepers, ksqlDB, schema registries, and Kafka Connect nodes.
Each of these instances has its own JMX Exporter config file. The following files should be used for each respective Kafka component. For more details on how to configure your Kafka JVM with the JMX exporter, refer to the JMX Exporter documentation.
We strongly recommend that you configure a separate user for Grafana Alloy and give it only the strictly mandatory security privileges necessary for monitoring your node.
Install Kafka integration for Grafana Cloud
- In your Grafana Cloud stack, click Connections in the left-hand menu.
- Find Kafka and click its tile to open the integration.
- Review the prerequisites in the Configuration Details tab and set up Grafana Alloy to send Kafka metrics and logs to your Grafana Cloud instance.
- Click Install to add this integration’s pre-built dashboards and alerts to your Grafana Cloud instance, and you can start monitoring your Kafka setup.
Configuration snippets for Grafana Alloy
Advanced mode
To instruct Grafana Alloy to scrape your Kafka nodes, go though the subsequent instructions.
The snippets provide examples to guide you through the configuration process.
First, manually copy and append the following snippets into your Grafana Alloy configuration file.
Then follow the instructions below to modify the necessary variables.
Advanced metrics snippets
discovery.relabel "metrics_integrations_kafka" {
    targets = [{
        __address__ = "kafka-node:7001",
    }]

    rule {
        target_label = "instance"
        replacement  = "<your-instance-name>"
    }

    rule {
        target_label = "kafka_cluster"
        replacement  = "<your-cluster-name>"
    }
}
discovery.relabel "metrics_integrations_kafka_zookeeper" {
    targets = [{
        __address__ = "zookeeper-node:7001",
    }]

    rule {
        target_label = "instance"
        replacement  = "<your-instance-name>"
    }

    rule {
        target_label = "kafka_cluster"
        replacement  = "<your-cluster-name>"
    }

}
discovery.relabel "metrics_integrations_kafka_connect" {
    targets = [{
        __address__ = "kafka-connect-node:7001",
    }]

    rule {
        target_label = "instance"
        replacement  = "<your-instance-name>"
    }

    rule {
        target_label = "kafka_cluster"
        replacement  = "<your-cluster-name>"
    }

}
discovery.relabel "metrics_integrations_kafka_schemaregistry" {
    targets = [{
        __address__ = "kafka-schemaregistry-node:7001",
    }]

    rule {
        target_label = "instance"
        replacement  = "<your-instance-name>"
    }

    rule {
        target_label = "kafka_cluster"
        replacement  = "<your-cluster-name>"
    }

}
discovery.relabel "metrics_integrations_kafka_ksqldb" {
    targets = [{
        __address__ = "kafka-ksqldb-node:7001",
    }]

    rule {
        target_label = "instance"
        replacement  = "<your-instance-name>"
    }

    rule {
        target_label = "kafka_cluster"
        replacement  = "<your-cluster-name>"
    }
}
prometheus.scrape "metrics_integrations_kafka" {
    targets    = concat(discovery.relabel.metrics_integrations_kafka.output, discovery.relabel.metrics_integrations_kafka_zookeeper.output, discovery.relabel.metrics_integrations_kafka_connect.output, discovery.relabel.metrics_integrations_kafka_schemaregistry.output, discovery.relabel.metrics_integrations_kafka_ksqldb.output)
    forward_to = [prometheus.remote_write.metrics_service.receiver]
    job_name   = "integrations/kafka"
}
After enabling the JMX exporter in each node, instruct Grafana Alloy to scrape them.
One discovery.relabel must be added for each node composing your cluster (Kafka Server, Schema Registry, ksqlDB, Zookeeper, Kafka Connect) to avoid instance label conflicts.
Make sure to match the name instance label name used in the exporter snippet for the Kafka Server nodes.
Configure the following properties within each discovery.relabel component:
__address__: The address to your Kafka node.<your-instance-name>: Theinstancelabel for all metrics scraped from this Kafka node.<your-cluster-name>: Thekafka_clusterlabel to group your Kafka nodes within a cluster. Set the same value for all nodes within your cluster.
Finally, reference each discovery.relabel component within the targets property of the prometheus.scrape component.
Advanced integrations snippets
prometheus.exporter.kafka "integrations_kafka_exporter" {
    kafka_uris = ["kafka-node1:9091"]
}
discovery.relabel "integrations_kafka_exporter" {
    targets = prometheus.exporter.kafka.integrations_kafka_exporter.targets

    rule {
        target_label = "job"
        replacement  = "integrations/kafka"
    }

    rule {
        target_label = "kafka_cluster"
        replacement  = "<your-cluster-name>"
    }

    rule {
        target_label = "instance"
        replacement  = "<your-instance-name>"
    }
}
prometheus.scrape "integrations_kafka_exporter" {
    targets    = discovery.relabel.integrations_kafka_exporter.output
    forward_to = [prometheus.remote_write.metrics_service.receiver]
    job_name   = "integrations/kafka_exporter"
}
To monitor consumption lag, you must add a pair of prometheus.exporter.kafka and discovery.relabel to your Grafana Alloy configuration file for each Kafka Server you monitor, to avoid instance label conflicts.
Configure the following property within the prometheus.exporter.kafka component:
kafka_uris: The URI to connect to your Kafka Server node.
Refer to prometheus.exporter.kafka in Grafana Alloy reference documentation for a complete description of the configuration options.
Configure the following properties within the discovery.relabel component:
<your-instance-name>: this will set theinstancelabel for all metrics from this Kafka Server node.<your-cluster-name>: this will set thekafka_clusterlabel to group your Kafka nodes within a cluster. Set the same value for all nodes within your cluster.
Reference each discovery.relabel component within the targets property of prometheus.scrape component.
Finally, reference each prometheus.exporter.kafka component within the targets property of the prometheus.scrape component.
Advanced logs snippets
darwin
local.file_match "logs_integrations_integrations_kafka" {
	path_targets = [{
		__address__ = "localhost",
		__path__    = "/var/log/kafka-server/server.log",
		instance    = constants.hostname,
		job         = "integrations/kafka",
        kafka_cluster = "<your-cluster-name>",
	}]
}

loki.process "logs_integrations_integrations_kafka" {
	forward_to = [loki.write.grafana_cloud_loki.receiver]

	stage.multiline {
		firstline     = `^\[(\d+-\d{2}-\d{2} \d{2}:\d{2}:\d{2},\d{3})\]`
		max_lines     = 0
		max_wait_time = "3s"
	}
	stage.regex {
		expression = `\[(?P<timestamp>\d+-\d{2}-\d{2} \d{2}:\d{2}:\d{2},\d{3})\] (?P<level>[A-Z]+) \[(?P<context>.+?)\] (?P<msg>(.+)) \((?P<logger>.+)\)(?P<exception>(?s:.*))`
	}
    stage.template {
        source   = "level"
        template = "{{ .level | ToLower }}"
    }
	stage.labels {
		values = {
			level = null,
            logger = null,
		}
	}
}

loki.source.file "logs_integrations_integrations_kafka" {
	targets    = local.file_match.logs_integrations_integrations_kafka.targets
	forward_to = [loki.process.logs_integrations_integrations_kafka.receiver]
}
To monitor your Kafka brokers logs, you will use a combination of the following components:
local.file_match defines where to find the log file to be scraped. Change the following properties according to your environment:
__path__: The path to the log file.instancelabel:constants.hostnamesets theinstancelabel to your Grafana Alloy server hostname. If that is not suitable, change it to a value uniquely identifies this Kafka broker instance. Make sure this label value is the same for all telemetry data collected for this instance.kafka_clusterlabel: Kafka cluster identifier.
loki.process defines how to process logs before sending it to Loki.
loki.source.file sends logs to Loki.
linux
local.file_match "logs_integrations_integrations_kafka" {
	path_targets = [{
		__address__ = "localhost",
		__path__    = "/var/log/kafka-server/server.log",
		instance    = constants.hostname,
		job         = "integrations/kafka",
        kafka_cluster = "<your-cluster-name>",
	}]
}

loki.process "logs_integrations_integrations_kafka" {
	forward_to = [loki.write.grafana_cloud_loki.receiver]

	stage.multiline {
		firstline     = `^\[(\d+-\d{2}-\d{2} \d{2}:\d{2}:\d{2},\d{3})\]`
		max_lines     = 0
		max_wait_time = "3s"
	}
	stage.regex {
		expression = `\[(?P<timestamp>\d+-\d{2}-\d{2} \d{2}:\d{2}:\d{2},\d{3})\] (?P<level>[A-Z]+) \[(?P<context>.+?)\] (?P<msg>(.+)) \((?P<logger>.+)\)(?P<exception>(?s:.*))`
	}
    stage.template {
        source   = "level"
        template = "{{ .level | ToLower }}"
    }
	stage.labels {
		values = {
			level = null,
            logger = null,
		}
	}
}

loki.source.file "logs_integrations_integrations_kafka" {
	targets    = local.file_match.logs_integrations_integrations_kafka.targets
	forward_to = [loki.process.logs_integrations_integrations_kafka.receiver]
}
To monitor your Kafka brokers logs, you will use a combination of the following components:
local.file_match defines where to find the log file to be scraped. Change the following properties according to your environment:
__path__: The path to the log file.instancelabel:constants.hostnamesets theinstancelabel to your Grafana Alloy server hostname. If that is not suitable, change it to a value uniquely identifies this Kafka broker instance. Make sure this label value is the same for all telemetry data collected for this instance.kafka_clusterlabel: Kafka cluster identifier.
loki.process defines how to process logs before sending it to Loki.
loki.source.file sends logs to Loki.
windows
local.file_match "logs_integrations_integrations_kafka" {
	path_targets = [{
		__address__ = "localhost",
		__path__    = "C:/kafka/kafka-logs/server.log",
		instance    = constants.hostname,
		job         = "integrations/kafka",
        kafka_cluster = "<your-cluster-name>",
	}]
}

loki.process "logs_integrations_integrations_kafka" {
	forward_to = [loki.write.grafana_cloud_loki.receiver]

	stage.multiline {
		firstline     = `^\[(\d+-\d{2}-\d{2} \d{2}:\d{2}:\d{2},\d{3})\]`
		max_lines     = 0
		max_wait_time = "3s"
	}
	stage.regex {
		expression = `\[(?P<timestamp>\d+-\d{2}-\d{2} \d{2}:\d{2}:\d{2},\d{3})\] (?P<level>[A-Z]+) \[(?P<context>.+?)\] (?P<msg>(.+)) \((?P<logger>.+)\)(?P<exception>(?s:.*))`
	}
    stage.template {
        source   = "level"
        template = "{{ .level | ToLower }}"
    }
	stage.labels {
		values = {
			level = null,
            logger = null,
		}
	}
}

loki.source.file "logs_integrations_integrations_kafka" {
	targets    = local.file_match.logs_integrations_integrations_kafka.targets
	forward_to = [loki.process.logs_integrations_integrations_kafka.receiver]
}
To monitor your Kafka brokers logs, you will use a combination of the following components:
local.file_match defines where to find the log file to be scraped. Change the following properties according to your environment:
__path__: The path to the log file.instancelabel:constants.hostnamesets theinstancelabel to your Grafana Alloy server hostname. If that is not suitable, change it to a value uniquely identifies this Kafka broker instance. Make sure this label value is the same for all telemetry data collected for this instance.kafka_clusterlabel: Kafka cluster identifier.
loki.process defines how to process logs before sending it to Loki.
loki.source.file sends logs to Loki.
Kubernetes instructions
Before you begin with Kubernetes
These instructions assume the use of the Kubernetes Monitoring Helm chart.
Please see official documentation for the Helm chart deployment guide.
For the integration to work, you must configure a JMX exporter as a sidecar on each component composing your Kafka cluster, including all brokers, zookeepers, ksqlDB, schema registries, and Kafka Connect nodes.
Each of these instances has its own JMX Exporter config file. The following files should be used for each respective Kafka component. For more details on how to configure your Kafka JVM with the JMX exporter, refer to the JMX Exporter documentation.
Configuration snippets for Kubernetes Helm chart
To scrape Kafka metrics, modify your Kubernetes Monitoring Helm chart with these configuration snippets.
Replace any values between the angle brackets <> in the provided snippets with your desired configuration values.
Metrics snippets
alloy-metrics:
    extraConfig: |-

        //KAFKA BROKER
        discovery.kubernetes "kafka_broker" {
            role = "pod"
            selectors {
                role = "pod"
                label = "<kafka_broker_pod_label_name>=<kafka_broker_pod_label_value>"
            }
        }

        discovery.relabel "kafka_broker" {
            targets = discovery.kubernetes.kafka_broker.targets
            rule {
                source_labels = ["__meta_kubernetes_pod_container_port_number"]
                regex = "<kafka_broker_pod_jmx_port>"
                action = "keep"
            }
            rule {
                source_labels = ["__meta_kubernetes_pod_name"]
                target_label = "instance"
            }
            rule {
                replacement = "<your_kafka_cluster_name>"
                target_label = "kafka_cluster"
            }
        }

        prometheus.scrape "kafka_broker" {
            targets      = discovery.relabel.kafka_broker.output
            job_name     = "integrations/kafka"
            honor_labels = true
            forward_to   = [prometheus.remote_write.grafana_cloud_metrics.receiver]
        }

        //KAFKA ZOOKEEPER
        discovery.kubernetes "kafka_zookeeper" {
            role = "pod"
            selectors {
                role = "pod"
                label = "<zookeeper_pod_label>=<zookeeper_pod_label_value>"
            }
        }

        discovery.relabel "kafka_zookeeper" {
            targets = discovery.kubernetes.kafka_zookeeper.targets
            rule {
                source_labels = ["__meta_kubernetes_pod_container_port_number"]
                regex = "<zookeeper_pod_jmx_port>"
                action = "keep"
            }
            rule {
                source_labels = ["__meta_kubernetes_pod_name"]
                target_label = "instance"
            }
            rule {
                replacement = "<your_kafka_cluster_name>"
                target_label = "kafka_cluster"
            }
        }

        prometheus.scrape "kafka_zookeeper" {
            targets      = discovery.relabel.kafka_zookeeper.output
            job_name     = "integrations/kafka"
            honor_labels = true
            forward_to   = [prometheus.remote_write.grafana_cloud_metrics.receiver]
        }

        //KAFKA CONNECT
        discovery.kubernetes "kafka_connect" {
            role = "pod"
            selectors {
                role = "pod"
                label = "<kafka_connect_pod_label>=<kafka_connect_pod_label_value>"
            }
        }

        discovery.relabel "kafka_connect" {
            targets = discovery.kubernetes.kafka_connect.targets
            rule {
                source_labels = ["__meta_kubernetes_pod_container_port_number"]
                regex = "<kafka_connect_pod_jmx_port>"
                action = "keep"
            }
            rule {
                source_labels = ["__meta_kubernetes_pod_name"]
                target_label = "instance"
            }
            rule {
                replacement = "<your_kafka_cluster_name>"
                target_label = "kafka_cluster"
            }
        }

        prometheus.scrape "kafka_connect" {
            targets      = discovery.relabel.kafka_connect.output
            job_name     = "integrations/kafka"
            honor_labels = true
            forward_to   = [prometheus.remote_write.grafana_cloud_metrics.receiver]
        }
        //KAFKA SCHEMA REGISTRY
        discovery.kubernetes "kafka_schemaregistry" {
            role = "pod"
            selectors {
                role = "pod"
                label = "<kafka_schemaregistry_pod_label>=<kafka_schemaregistry_pod_label_value>"
            }
        }

        discovery.relabel "kafka_schemaregistry" {
            targets = discovery.kubernetes.kafka_schemaregistry.targets
            rule {
                source_labels = ["__meta_kubernetes_pod_container_port_number"]
                regex = "<kafka_schemaregistry_pod_jmx_port>"
                action = "keep"
            }
            rule {
                source_labels = ["__meta_kubernetes_pod_name"]
                target_label = "instance"
            }
            rule {
                replacement = "<your_kafka_cluster_name>"
                target_label = "kafka_cluster"
            }
        }

        prometheus.scrape "kafka_schemaregistry" {
            targets      = discovery.relabel.kafka_schemaregistry.output
            job_name     = "integrations/kafka"
            honor_labels = true
            forward_to   = [prometheus.remote_write.grafana_cloud_metrics.receiver]
        }

        //KAFKA KSQLDB
        discovery.kubernetes "kafka_ksqldb" {
            role = "pod"
            selectors {
                role = "pod"
                label = "<kafka_ksqldb_pod_label>=<kafka_ksqldb_pod_label_value>"
            }
        }

        discovery.relabel "kafka_ksqldb" {
            targets = discovery.kubernetes.kafka_ksqldb.targets
            rule {
                source_labels = ["__meta_kubernetes_pod_container_port_number"]
                regex = "<kafka_ksqldb_pod_jmx_port>"
                action = "keep"
            }
            rule {
                source_labels = ["__meta_kubernetes_pod_name"]
                target_label = "instance"
            }
            rule {
                replacement = "<your_kafka_cluster_name>"
                target_label = "kafka_cluster"
            }
        }

        prometheus.scrape "kafka_ksqldb" {
            targets      = discovery.relabel.kafka_ksqldb.output
            job_name     = "integrations/kafka"
            honor_labels = true
            forward_to   = [prometheus.remote_write.grafana_cloud_metrics.receiver]
        }

        // KAFKA EXPORTER FOR LAG MONITORING
        // Instantiate one exporter per kafka broker.
        // For detailed configuration options, please check https://grafana.com/docs/agent/latest/flow/reference/components/prometheus.exporter.kafka/
        prometheus.exporter.kafka "kafka_exporter" {
            kafka_uris = "<your_kafka_broker_uri>"
            instance   = "<your_kafka_broker_instance_name>"
        }

        prometheus.scrape "kafka_exporter" {
            targets      = prometheus.exporter.kafka.kafka_exporter.targets
            job_name     = "integrations/kafka"
            forward_to   = [prometheus.relabel.kafka_exporter.receiver]
        }

        prometheus.relabel "kafka_exporter" {
            rule {
                replacement = "<your_kafka_cluster_name>"
                target_label = "kafka_cluster"
            }
            forward_to   = [prometheus.remote_write.grafana_cloud_metrics.receiver]
        }
Dashboards
The Kafka integration installs the following dashboards in your Grafana Cloud instance to help monitor your system.
- Kafka Connect Overview
- Kafka logs
- Kafka overview
- Kafka topic overview
- Schema Registry Overview
- ZooKeeper overview
- ksqldb Overview
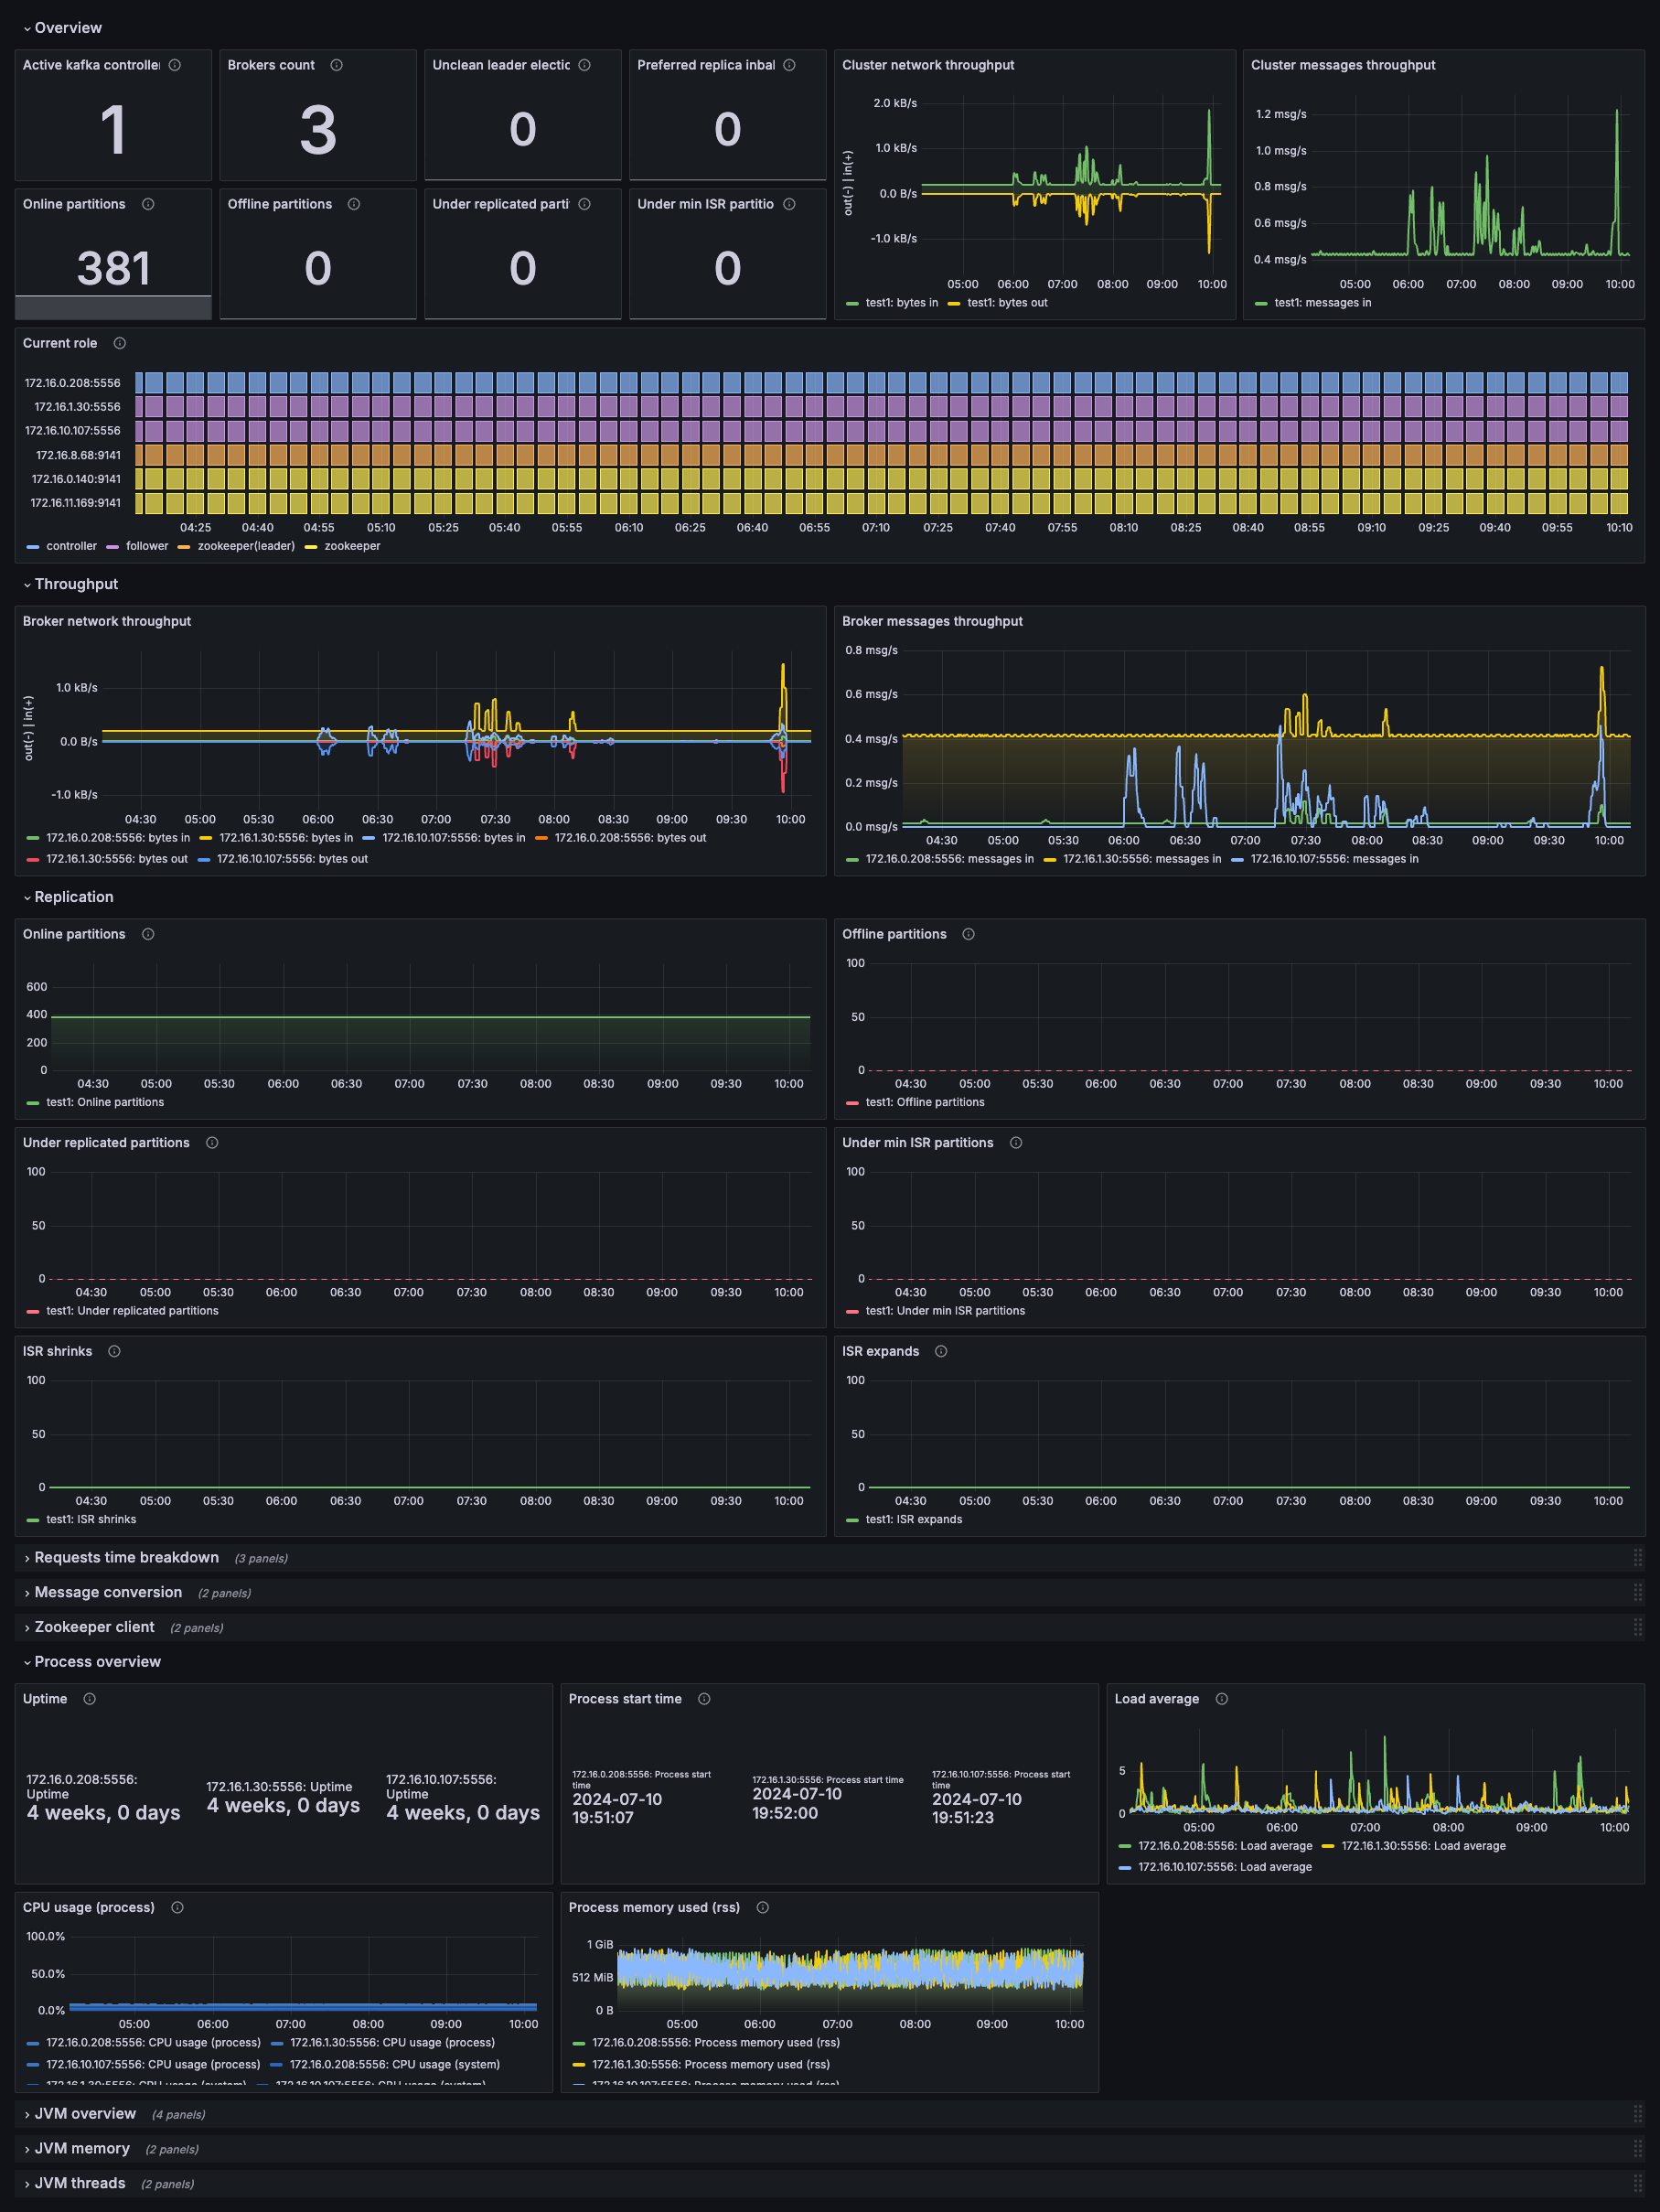
Kafka overview dashboard
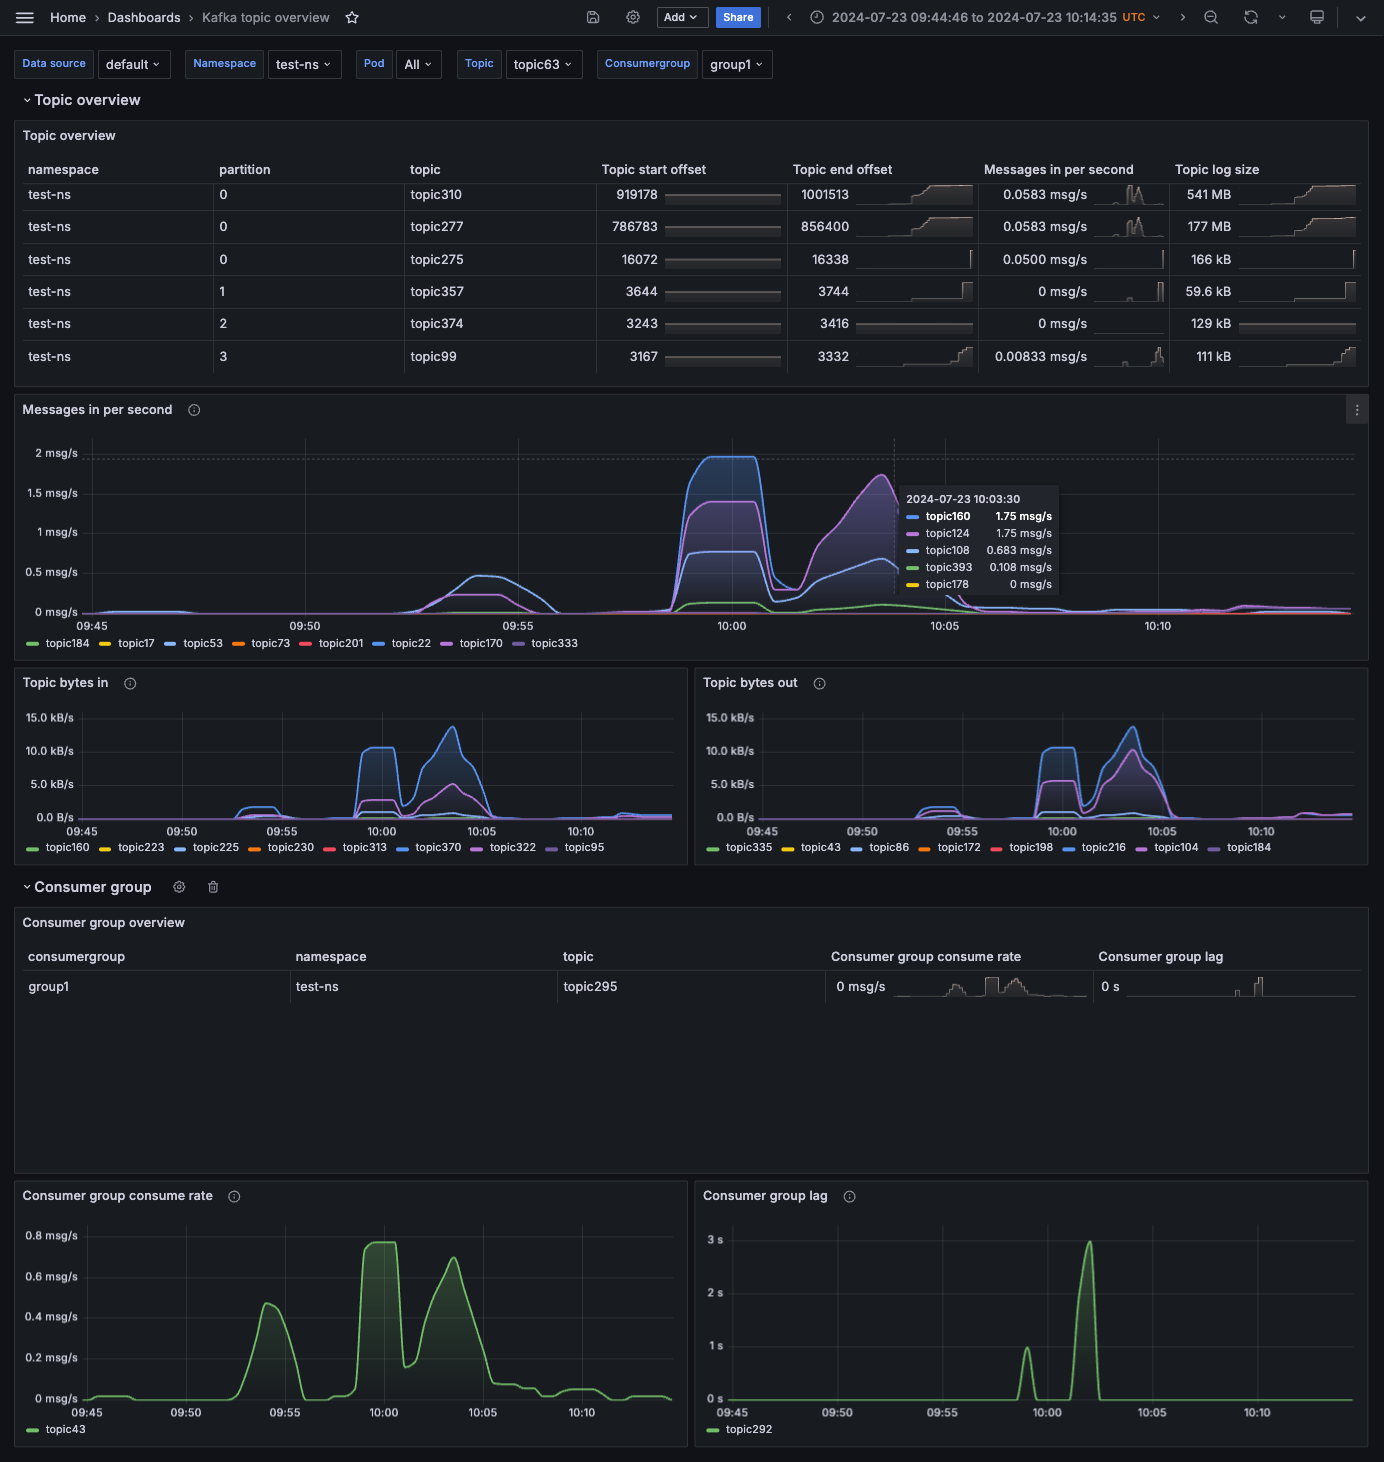
Kafka topics dashboard
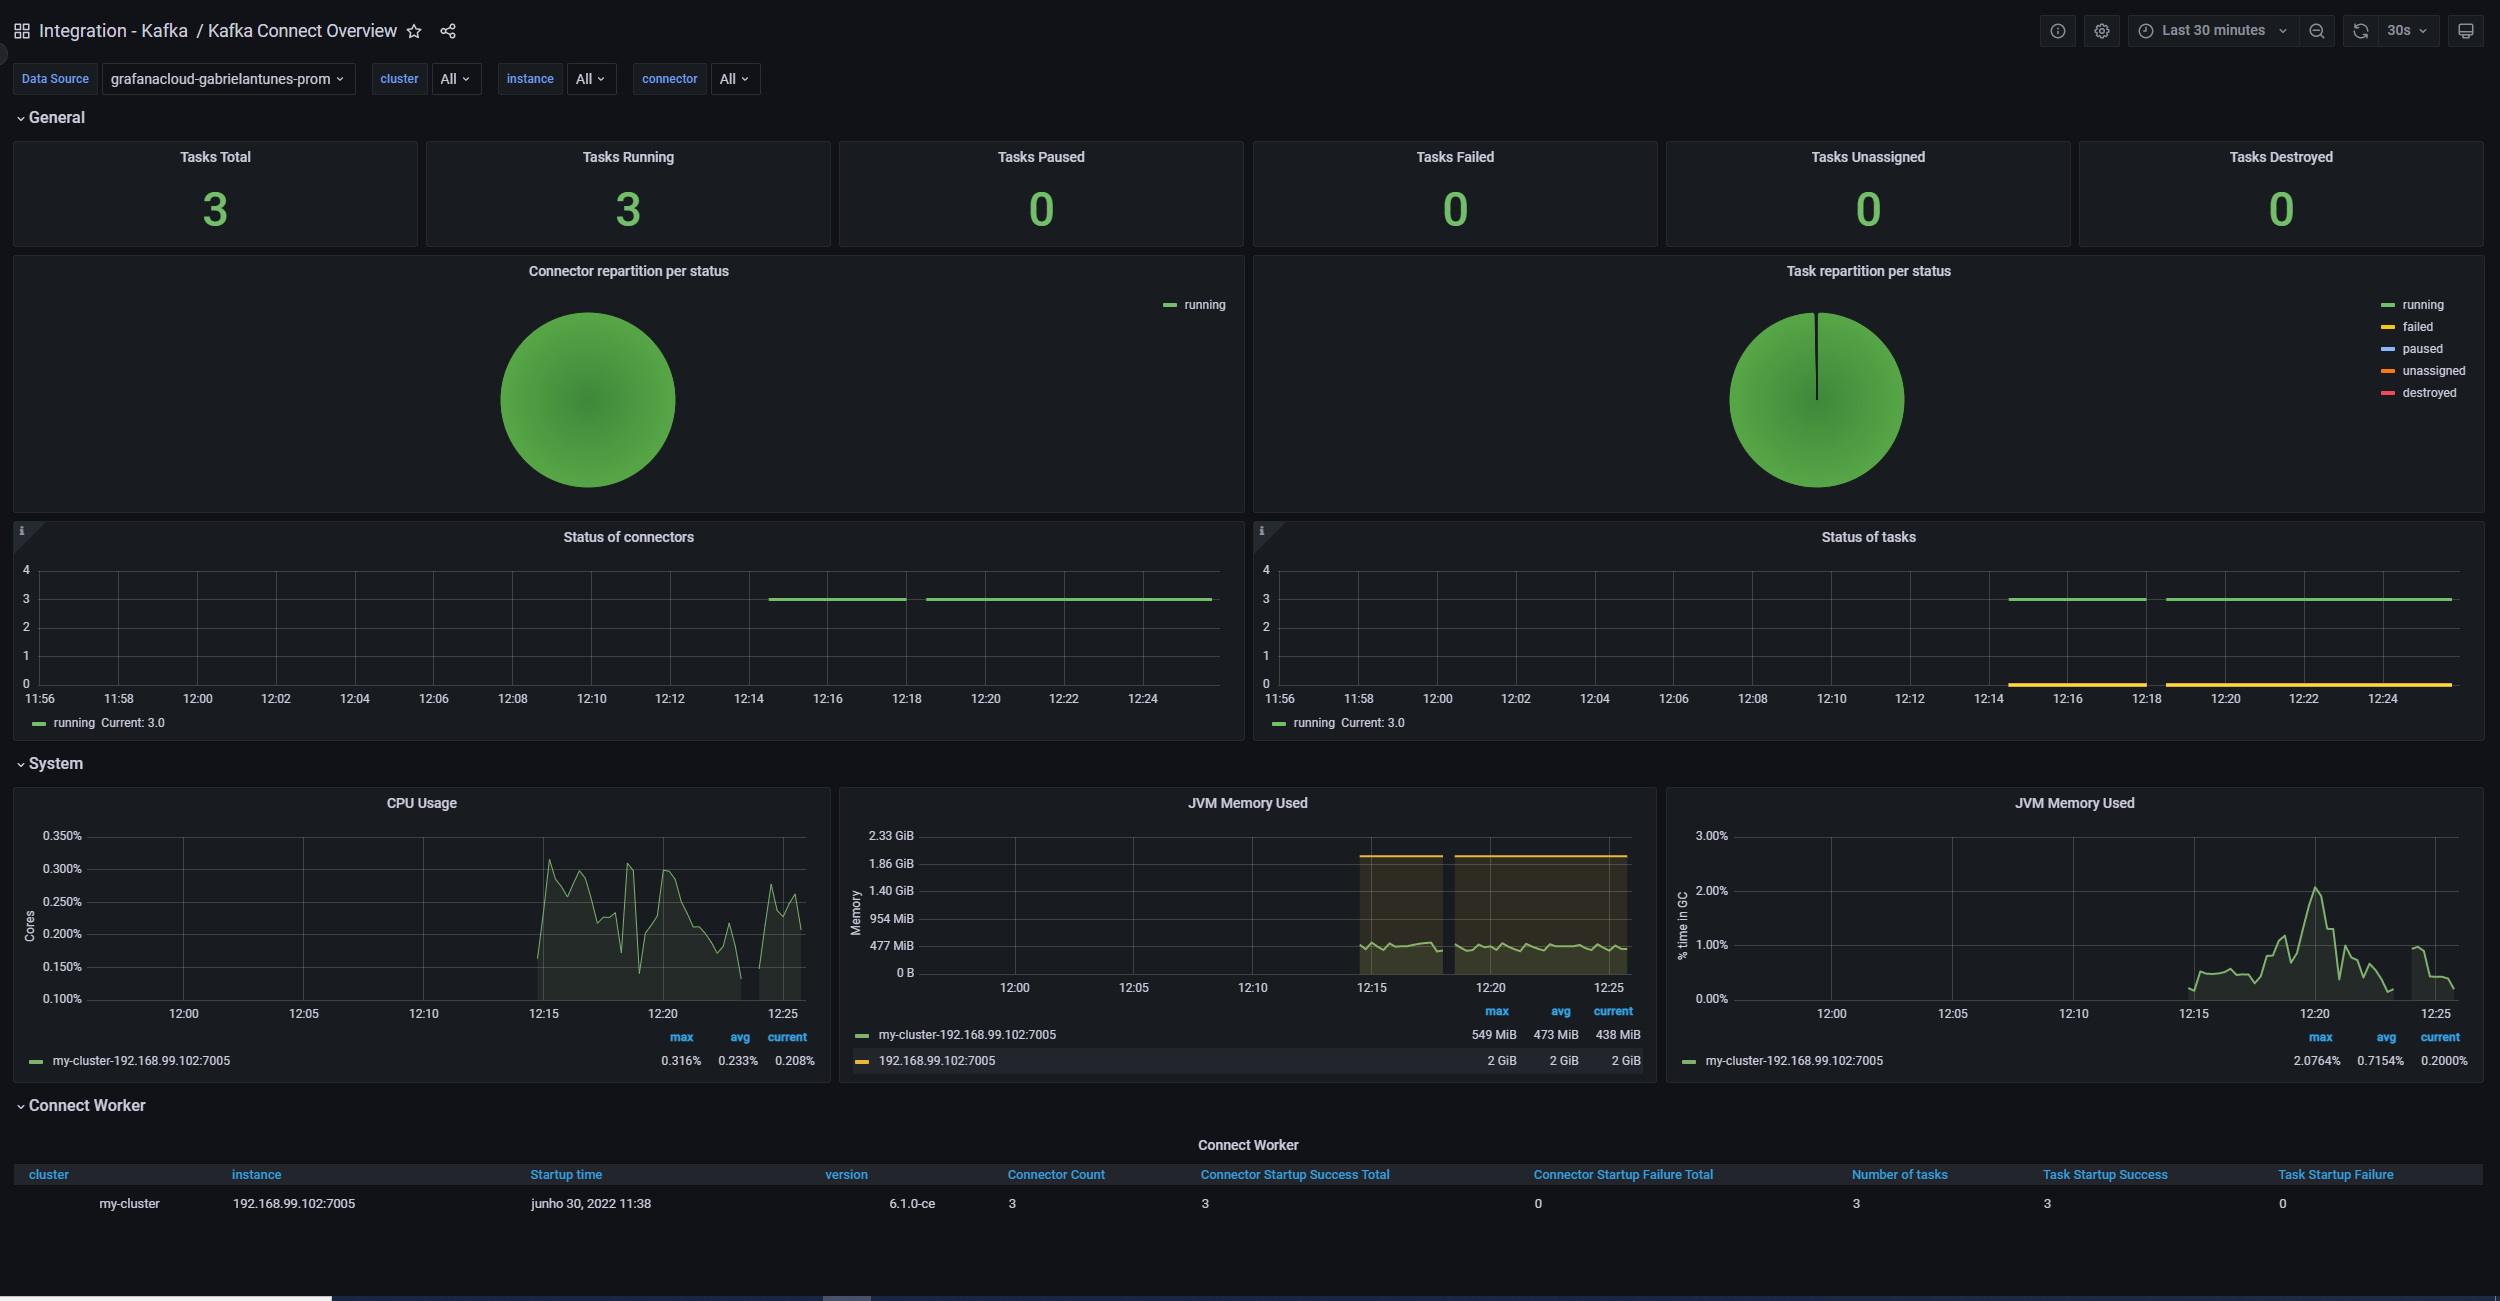
Kafka Connect Overview dashboard
Alerts
The Kafka integration includes the following useful alerts:
kafka-kafka-alerts
kafka-jvm-alerts
kafka-zookeeper-jvm-alerts
Metrics
The most important metrics provided by the Kafka integration, which are used on the pre-built dashboards and Prometheus alerts, are as follows:
- avg_latency
- java_lang_classloading_loadedclasscount
- java_lang_memory_heapmemoryusage_committed
- java_lang_memory_heapmemoryusage_max
- java_lang_memory_heapmemoryusage_used
- java_lang_memory_nonheapmemoryusage_committed
- java_lang_memory_nonheapmemoryusage_max
- java_lang_memory_nonheapmemoryusage_used
- java_lang_operatingsystem_cpuload
- java_lang_operatingsystem_processcputime
- java_lang_operatingsystem_systemloadaverage
- java_lang_runtime_starttime
- java_lang_runtime_uptime
- java_lang_threading_daemonthreadcount
- java_lang_threading_peakthreadcount
- java_lang_threading_threadcount
- jvm_buffer_pool_capacity_bytes
- jvm_buffer_pool_used_bytes
- jvm_classes_loaded
- jvm_gc_collection_seconds_count
- jvm_gc_collection_seconds_sum
- jvm_memory_bytes_committed
- jvm_memory_bytes_max
- jvm_memory_bytes_used
- jvm_memory_committed_bytes
- jvm_memory_max_bytes
- jvm_memory_pool_allocated_bytes_total
- jvm_memory_pool_bytes_committed
- jvm_memory_pool_bytes_max
- jvm_memory_pool_bytes_used
- jvm_memory_used_bytes
- jvm_threads_current
- jvm_threads_daemon
- jvm_threads_deadlocked
- jvm_threads_peak
- jvm_threads_state
- kafka_cluster_partition_underminisr
- kafka_cluster_partition_underreplicated
- kafka_connect_app_info
- kafka_connect_connect_metrics_connection_count
- kafka_connect_connect_metrics_failed_authentication_total
- kafka_connect_connect_metrics_incoming_byte_rate
- kafka_connect_connect_metrics_io_ratio
- kafka_connect_connect_metrics_network_io_rate
- kafka_connect_connect_metrics_outgoing_byte_rate
- kafka_connect_connect_metrics_request_rate
- kafka_connect_connect_metrics_response_rate
- kafka_connect_connect_metrics_successful_authentication_rate
- kafka_connect_connect_worker_metrics_connector_count
- kafka_connect_connect_worker_metrics_connector_destroyed_task_count
- kafka_connect_connect_worker_metrics_connector_failed_task_count
- kafka_connect_connect_worker_metrics_connector_paused_task_count
- kafka_connect_connect_worker_metrics_connector_running_task_count
- kafka_connect_connect_worker_metrics_connector_startup_failure_total
- kafka_connect_connect_worker_metrics_connector_startup_success_total
- kafka_connect_connect_worker_metrics_connector_total_task_count
- kafka_connect_connect_worker_metrics_connector_unassigned_task_count
- kafka_connect_connect_worker_metrics_task_count
- kafka_connect_connect_worker_metrics_task_startup_failure_total
- kafka_connect_connect_worker_metrics_task_startup_success_total
- kafka_connect_connect_worker_rebalance_metrics_rebalance_avg_time_ms
- kafka_connect_connect_worker_rebalance_metrics_time_since_last_rebalance_ms
- kafka_connect_connector_info
- kafka_connect_connector_metrics
- kafka_connect_connector_task_metrics_batch_size_avg
- kafka_connect_connector_task_metrics_batch_size_max
- kafka_connect_connector_task_metrics_offset_commit_avg_time_ms
- kafka_connect_connector_task_metrics_offset_commit_success_percentage
- kafka_connect_connector_task_metrics_pause_ratio
- kafka_connect_connector_task_metrics_running_ratio
- kafka_connect_sink_task_metrics_partition_count
- kafka_connect_sink_task_metrics_put_batch_avg_time_ms
- kafka_connect_sink_task_metrics_put_batch_max_time_ms
- kafka_connect_source_task_metrics_poll_batch_avg_time_ms
- kafka_connect_source_task_metrics_poll_batch_max_time_ms
- kafka_connect_source_task_metrics_source_record_active_count_avg
- kafka_connect_source_task_metrics_source_record_active_count_max
- kafka_connect_source_task_metrics_source_record_poll_rate
- kafka_connect_source_task_metrics_source_record_write_rate
- kafka_connect_task_error_metrics_deadletterqueue_produce_requests
- kafka_connect_task_error_metrics_total_errors_logged
- kafka_connect_task_error_metrics_total_record_errors
- kafka_connect_task_error_metrics_total_record_failures
- kafka_connect_task_error_metrics_total_records_skipped
- kafka_connect_task_error_metrics_total_retries
- kafka_consumer_lag_millis
- kafka_consumergroup_current_offset
- kafka_consumergroup_lag
- kafka_consumergroup_uncommitted_offsets
- kafka_controller_controllerstats_uncleanleaderelections_total
- kafka_controller_controllerstats_uncleanleaderelectionspersec
- kafka_controller_kafkacontroller_activecontrollercount
- kafka_controller_kafkacontroller_activecontrollercount_value
- kafka_controller_kafkacontroller_offlinepartitionscount
- kafka_controller_kafkacontroller_offlinepartitionscount_value
- kafka_controller_kafkacontroller_preferredreplicaimbalancecount
- kafka_controller_kafkacontroller_preferredreplicaimbalancecount_value
- kafka_log_log_logendoffset
- kafka_log_log_logstartoffset
- kafka_log_log_size
- kafka_network_requestmetrics_localtimems
- kafka_network_requestmetrics_localtimems_count
- kafka_network_requestmetrics_remotetimems
- kafka_network_requestmetrics_remotetimems_count
- kafka_network_requestmetrics_requestqueuetimems
- kafka_network_requestmetrics_requestqueuetimems_count
- kafka_network_requestmetrics_responsequeuetimems
- kafka_network_requestmetrics_responsequeuetimems_count
- kafka_network_requestmetrics_responsesendtimems
- kafka_network_requestmetrics_responsesendtimems_count
- kafka_schema_registry_jersey_metrics_request_latency_99
- kafka_schema_registry_jersey_metrics_request_rate
- kafka_schema_registry_jetty_metrics_connections_active
- kafka_schema_registry_registered_count
- kafka_schema_registry_schemas_created
- kafka_schema_registry_schemas_deleted
- kafka_server_brokertopicmetrics_bytesin_total
- kafka_server_brokertopicmetrics_bytesinpersec
- kafka_server_brokertopicmetrics_bytesinpersec_count
- kafka_server_brokertopicmetrics_bytesout_total
- kafka_server_brokertopicmetrics_bytesoutpersec
- kafka_server_brokertopicmetrics_bytesoutpersec_count
- kafka_server_brokertopicmetrics_fetchmessageconversions_total
- kafka_server_brokertopicmetrics_fetchmessageconversionspersec
- kafka_server_brokertopicmetrics_fetchmessageconversionspersec_count
- kafka_server_brokertopicmetrics_messagesin_total
- kafka_server_brokertopicmetrics_messagesinpersec
- kafka_server_brokertopicmetrics_messagesinpersec_count
- kafka_server_brokertopicmetrics_producemessageconversions_total
- kafka_server_brokertopicmetrics_producemessageconversionspersec
- kafka_server_brokertopicmetrics_producemessageconversionspersec_count
- kafka_server_kafkaserver_brokerstate
- kafka_server_kafkaserver_total_brokerstate_value
- kafka_server_replicamanager_isrexpands_total
- kafka_server_replicamanager_isrexpandspersec
- kafka_server_replicamanager_isrshrinks_total
- kafka_server_replicamanager_isrshrinkspersec
- kafka_server_replicamanager_partitioncount
- kafka_server_replicamanager_total_isrexpandspersec_count
- kafka_server_replicamanager_total_isrshrinkspersec_count
- kafka_server_replicamanager_total_partitioncount_value
- kafka_server_sessionexpirelistener_zookeeperauthfailures_total
- kafka_server_sessionexpirelistener_zookeeperauthfailurespersec
- kafka_server_sessionexpirelistener_zookeeperdisconnects_total
- kafka_server_sessionexpirelistener_zookeeperdisconnectspersec
- kafka_server_sessionexpirelistener_zookeeperexpires_total
- kafka_server_sessionexpirelistener_zookeeperexpirespersec
- kafka_server_sessionexpirelistener_zookeepersyncconnects_total
- kafka_server_sessionexpirelistener_zookeepersyncconnectspersec
- kafka_server_zookeeperclientmetrics_zookeeperrequestlatencyms
- kafka_server_zookeeperclientmetrics_zookeeperrequestlatencyms_count
- kafka_streams_stream_state_metrics_delete_latency_avg
- kafka_streams_stream_state_metrics_delete_latency_max
- kafka_streams_stream_state_metrics_delete_rate
- kafka_streams_stream_state_metrics_fetch_latency_avg
- kafka_streams_stream_state_metrics_fetch_rate
- kafka_streams_stream_state_metrics_put_if_absent_latency_avg
- kafka_streams_stream_state_metrics_put_if_absent_latency_max
- kafka_streams_stream_state_metrics_put_if_absent_rate_rate
- kafka_streams_stream_state_metrics_put_latency_avg
- kafka_streams_stream_state_metrics_put_latency_max
- kafka_streams_stream_state_metrics_put_rate
- kafka_streams_stream_state_metrics_restore_latency_avg
- kafka_streams_stream_state_metrics_restore_latency_max
- kafka_streams_stream_state_metrics_restore_rate
- kafka_streams_stream_thread_metrics_commit_latency_avg
- kafka_streams_stream_thread_metrics_commit_latency_max
- kafka_streams_stream_thread_metrics_poll_latency_avg
- kafka_streams_stream_thread_metrics_poll_latency_max
- kafka_streams_stream_thread_metrics_process_latency_avg
- kafka_streams_stream_thread_metrics_process_latency_max
- kafka_streams_stream_thread_metrics_punctuate_latency_avg
- kafka_streams_stream_thread_metrics_punctuate_latency_max
- kafka_topic_partition_current_offset
- ksql_ksql_engine_query_stats_error_queries
- ksql_ksql_engine_query_stats_liveness_indicator
- ksql_ksql_engine_query_stats_messages_consumed_per_sec
- ksql_ksql_engine_query_stats_messages_produced_per_sec
- ksql_ksql_engine_query_stats_not_running_queries
- ksql_ksql_engine_query_stats_num_active_queries
- ksql_ksql_engine_query_stats_num_idle_queries
- ksql_ksql_engine_query_stats_num_persistent_queries
- ksql_ksql_engine_query_stats_pending_shutdown_queries
- ksql_ksql_engine_query_stats_rebalancing_queries
- ksql_ksql_engine_query_stats_running_queries
- ksql_ksql_metrics_ksql_queries_query_status
- leader_uptime
- max_latency
- min_latency
- num_alive_connections
- outstanding_requests
- process_cpu_seconds_total
- process_max_fds
- process_open_fds
- process_resident_memory_bytes
- process_start_time_seconds
- quorum_size
- up
- watch_count
- znode_count
- zookeeper_avgrequestlatency
- zookeeper_inmemorydatatree_nodecount
- zookeeper_inmemorydatatree_watchcount
- zookeeper_leaderuptime
- zookeeper_maxrequestlatency
- zookeeper_minrequestlatency
- zookeeper_numaliveconnections
- zookeeper_outstandingrequests
- zookeeper_status_quorumsize
- zookeeper_ticktime
Changelog
# 2.2.2 - July 2025

* Update Kubernetes snippets to work with v2.x version of Grafana Monitoring Helm chart.

# 2.2.1 - November 2024

* Update status panel check queries

# 2.2.0 - September 2024

  * Add logs dashboard and snippets

# 2.1.1 - September 2024

  * Add pending period(5m) for KafkaOfflinePartitonCount alert
  * Fix ZooKeeper nodes were not showing up on Kafka overview dashboard

# 2.1.0 - September 2024

* Add Asserts support
* Improve alerts expressions

# 2.0.0 - September 2024

* Enable support for Kafka metrics on dashboards and in alerts from different sources at the same time:
  - JMX configs from [prometheus/jmx_exporter](https://github.com/prometheus/jmx_exporter/blob/main/examples/kafka-2_0_0.yml) and [kafka_exporter](https://github.com/danielqsj/kafka_exporter)
  - JMX configs [referenced](https://grafana.com/docs/grafana-cloud/monitor-infrastructure/integrations/integration-reference/integration-kafka/#before-you-begin) in this integration and [kafka_exporter Grafana's fork](https://github.com/grafana/kafka_exporter) (used in Grafana Agent/Grafana Alloy).
  - JMX configs from [bitnami](https://github.com/bitnami/charts/blob/main/bitnami/kafka/templates/metrics/jmx-configmap.yaml) helm chart
* Enable support for JVM metrics from different sources:
  - `jmx_exporter` if you use jmx_exporter in http mode or javaagent mode with the additional config snippet (see README)
  - `prometheus_old` if you use jmx_exporter in javaagent mode and version prior to 1.0.1
  - `prometheus` if you use jmx_exporter in javaagent mode and version 1.0.1 or newer
* Enable support for ZooKeeper metrics from different sources:
  - Prometheus metrics available natively in ZooKeeper [since 3.6.0](https://zookeeper.apache.org/doc/r3.7.0/zookeeperMonitor.html):
  - JMX exporter and JMX config referenced in this integration
* Note that KSQLDB, Kafka Connect, and Schema Registry dashboards only support JMX configs from this repository as in prior versions
* Kafka overview dashboard update:
  - Replication row metrics are shown separately for each broker

# 1.1.0 - August 2024

* Refactor dashboards with kafka observability library
 - Merge Kafka topics and Kafka lag dashboards
 - Update Kafka overview dashboard
 - Update Kafka zookeeper dashboard
* Add KafkaLagIsTooHigh, KafkaLagKeepsIncreasing alerts
* Add JvmMemoryFillingUp, JvmThreadsDeadlocked alerts from JVM observability lib to Kafka and Zookeeper

# 1.0.2 - June 2024

* Fix missing template variable queries
* Update mixin to latest version

# 1.0.1 - January 2024

* Update mixin to latest version:
 - Update all Angular based panels to React panels

# 1.0.0 - September 2023

* Update mixin to latest version:
  - Added new kafka_cluster label to differentiate from kubernetes reserved cluster label
  - Set all job names to integrations/kafka
  - Added links between all dashboards
  - Added telemetry status panels
  - Improved alerts
* Enable Kubernetes support

# 0.0.6 - September 2023

* New Filter Metrics option for configuring the Grafana Agent, which saves on metrics cost by dropping any metric not used by this integration. Beware that anything custom built using metrics that are not on the snippet will stop working.
* New hostname relabel option, which applies the instance name you write on the text box to the Grafana Agent configuration snippets, making it easier and less error prone to configure this mandatory label.

# 0.0.5 - May 2023

* Update mixin to latest version:
  - Kafka overview: Show only 0.99 percentile by default
  - Kafka lag: Change table panel to bar chart for partitions per topic panel
  - Kafka lag: Stretch kafka lag dashboard to full screen width
  - Kafka lag panels: Convert old graph to timeseries (message per sec/per minute)
  - Kafka lag: Change delta() to increase() for per minute metrics
  - Add multichoice and 'All' options supportable in 'job'
  - Zookeeper dashboard: Use sentence case
  - Zookeeper dashboard: Get templated variables by non quorum metric. Otherwise, standalone zookeeper couldn't be discovered
  - Zookeeper dashboard: Add support in queries to jmx_config metrics notations used in Strimzi operator
  - Zookeeper dashboard: Convert graphs to timeseries panel
  - Zookeeper dashboard: Temp fix for latency graphs ignoring (minrequestlatency, ticktime)

# 0.0.4 - December 2022

* Update mixin to latest version:
  - Fix missing job and instance label on all the dashboards
  - Fix alert names to have a Kafka prefix

# 0.0.3 - February 2022

* Added the following alerts:
  - OfflinePartitonCount
  - UnderReplicatedPartitionCount
  - ActiveController
  - UncleanLeaderElection
  - ISRExpandRate
  - ISRShrinkRate
  - BrokerCount
  - ZookeeperSyncConnect

# 0.0.2 - October 2021

* Update mixin to latest version:
  - Update all rate queries to use `$__rate_interval` so they respect the default resolution

# 0.0.1 - June 2021

* Initial release
Cost
By connecting your Kafka instance to Grafana Cloud, you might incur charges. To view information on the number of active series that your Grafana Cloud account uses for metrics included in each Cloud tier, see Active series and dpm usage and Cloud tier pricing.


