Docker Desktop integration for Grafana Cloud
Docker Desktop is an easy-to-install application for your Mac, Windows or Linux environment that enables you to build and share containerized applications and microservices. This integration allows you to monitor your local Docker Desktop instance using the Grafana Cloud extension in Docker Desktop.The integration includes dashboard to monitor Docker metrics and logs as well as the Linux host metrics and logs.
This integration includes 26 useful alerts and 9 pre-built dashboards to help monitor and visualize Docker Desktop metrics and logs.
Before you begin
Please note that in order to install the Grafana Cloud extension, Docker Desktop version 4.8 or higher needs to be installed and the extensions feature has to be enabled in the settings. See the Docker Desktop extensions documentation for more information.
Install Docker Desktop integration for Grafana Cloud
- In your Grafana Cloud stack, click Connections in the left-hand menu.
- Find Docker Desktop and click its tile to open the integration.
- Review the prerequisites in the Configuration Details tab and set up Grafana Alloy to send Docker Desktop metrics and logs to your Grafana Cloud instance.
- Click Install to add this integration’s pre-built dashboards and alerts to your Grafana Cloud instance, and you can start monitoring your Docker Desktop setup.
Install the Docker desktop extension
Go to Docker Desktop extensions marketplace, search for Grafana cloud and install the Grafana cloud extension. Once it is installed, open the extension from the side bar and connect your Grafana cloud account.
Get the connection variables and connect to Grafana cloud
Install the integration to get the values of connection variables required to connect your account.
After installing the integration, an api key is required to generate the connection variables. Either create a new api key or use an existing api key and get the value for connection variables.
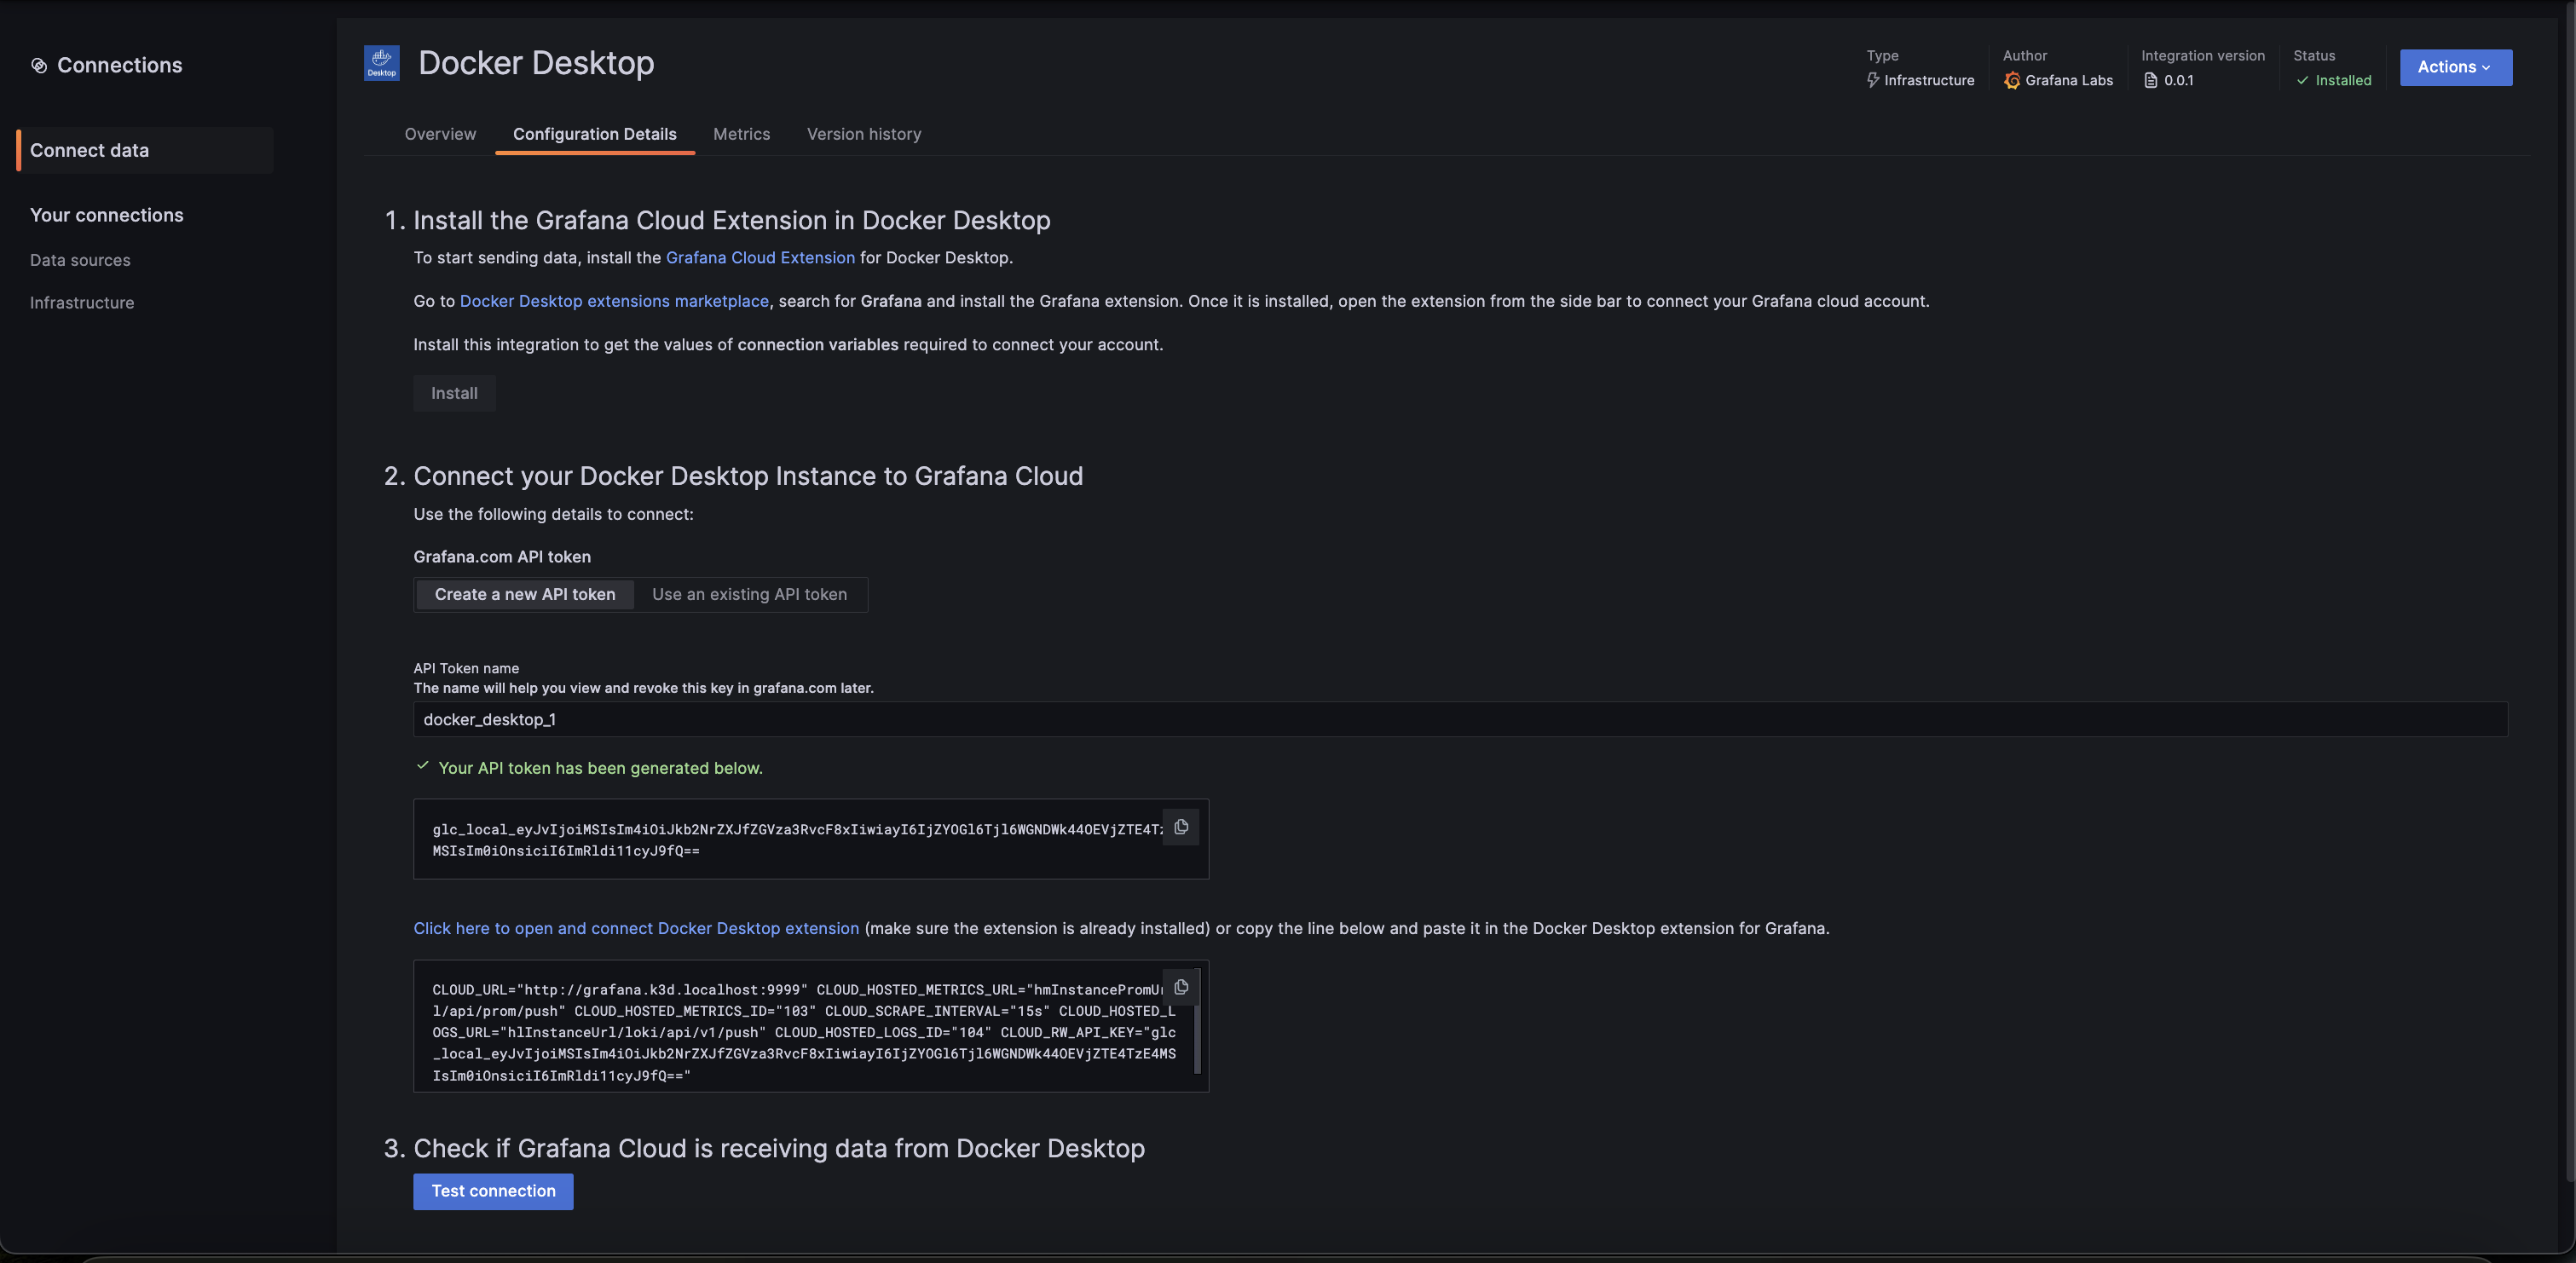
Copy the value of connection variables into the connect account page of the Grafana cloud extension.
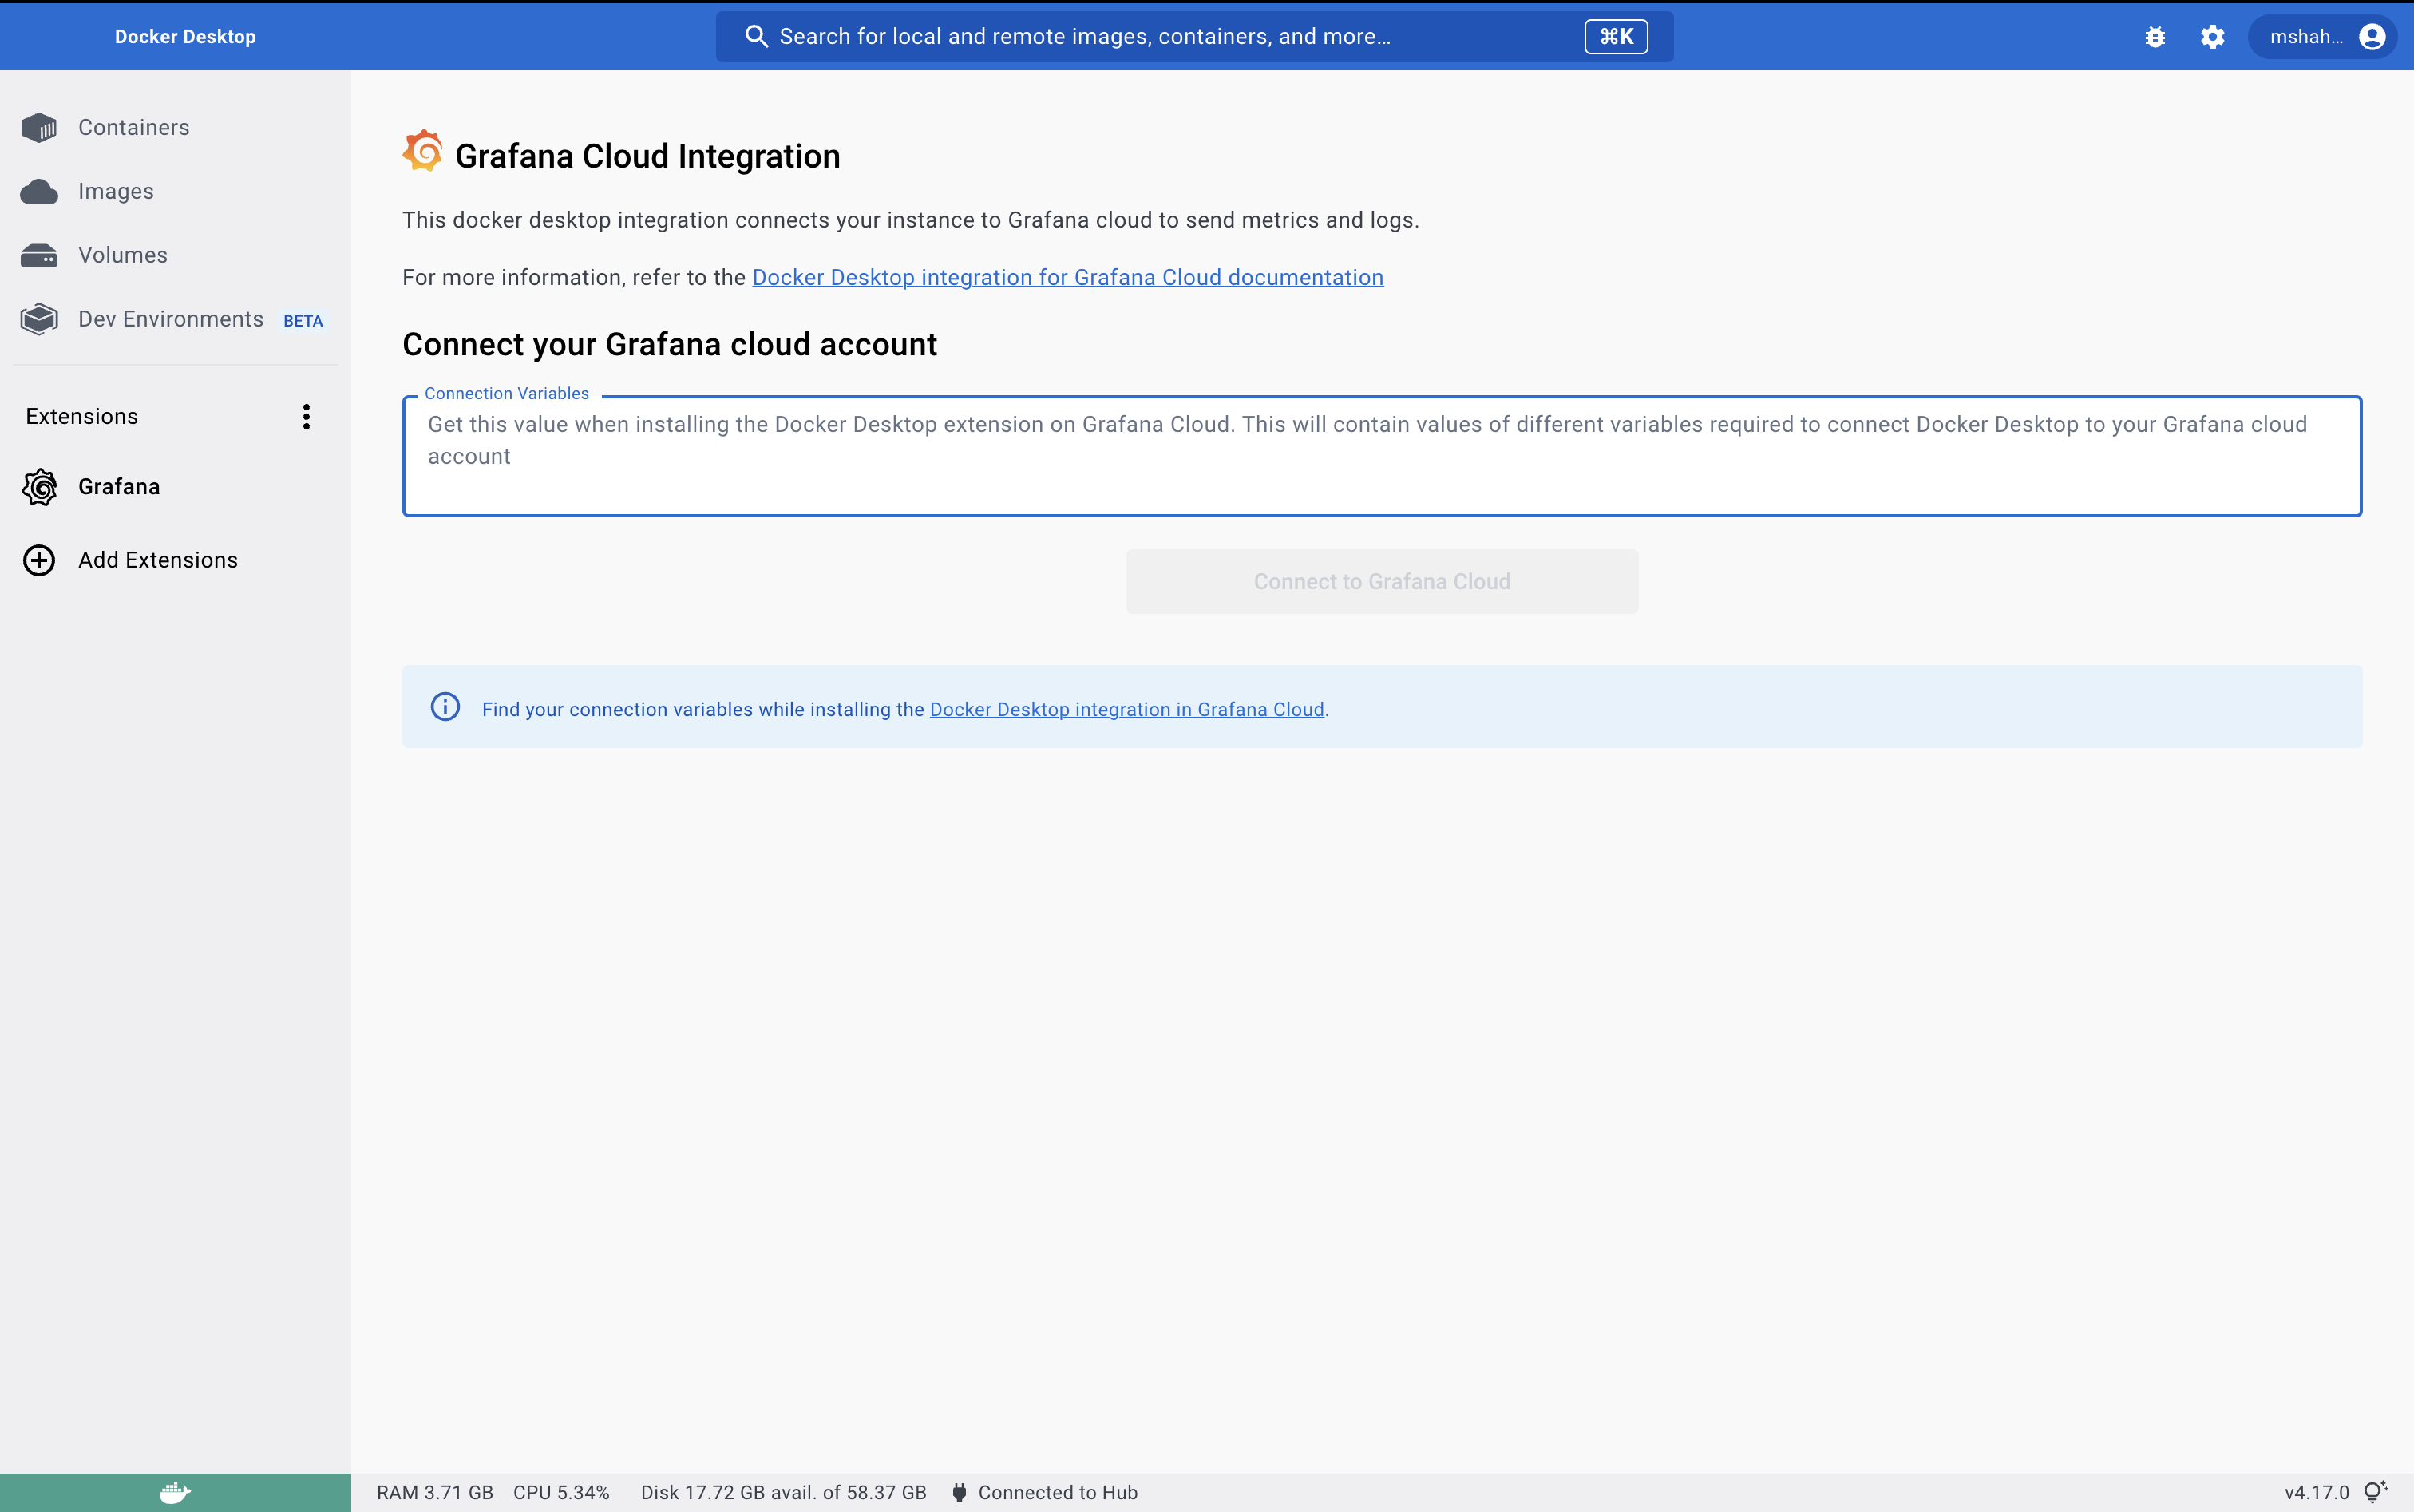
Click on Connect to Grafana Cloud to connect your docker desktop instance to your Grafana cloud stack and start sending logs and metrics. After connecting successfully, you would see the Alloy control panel screen.
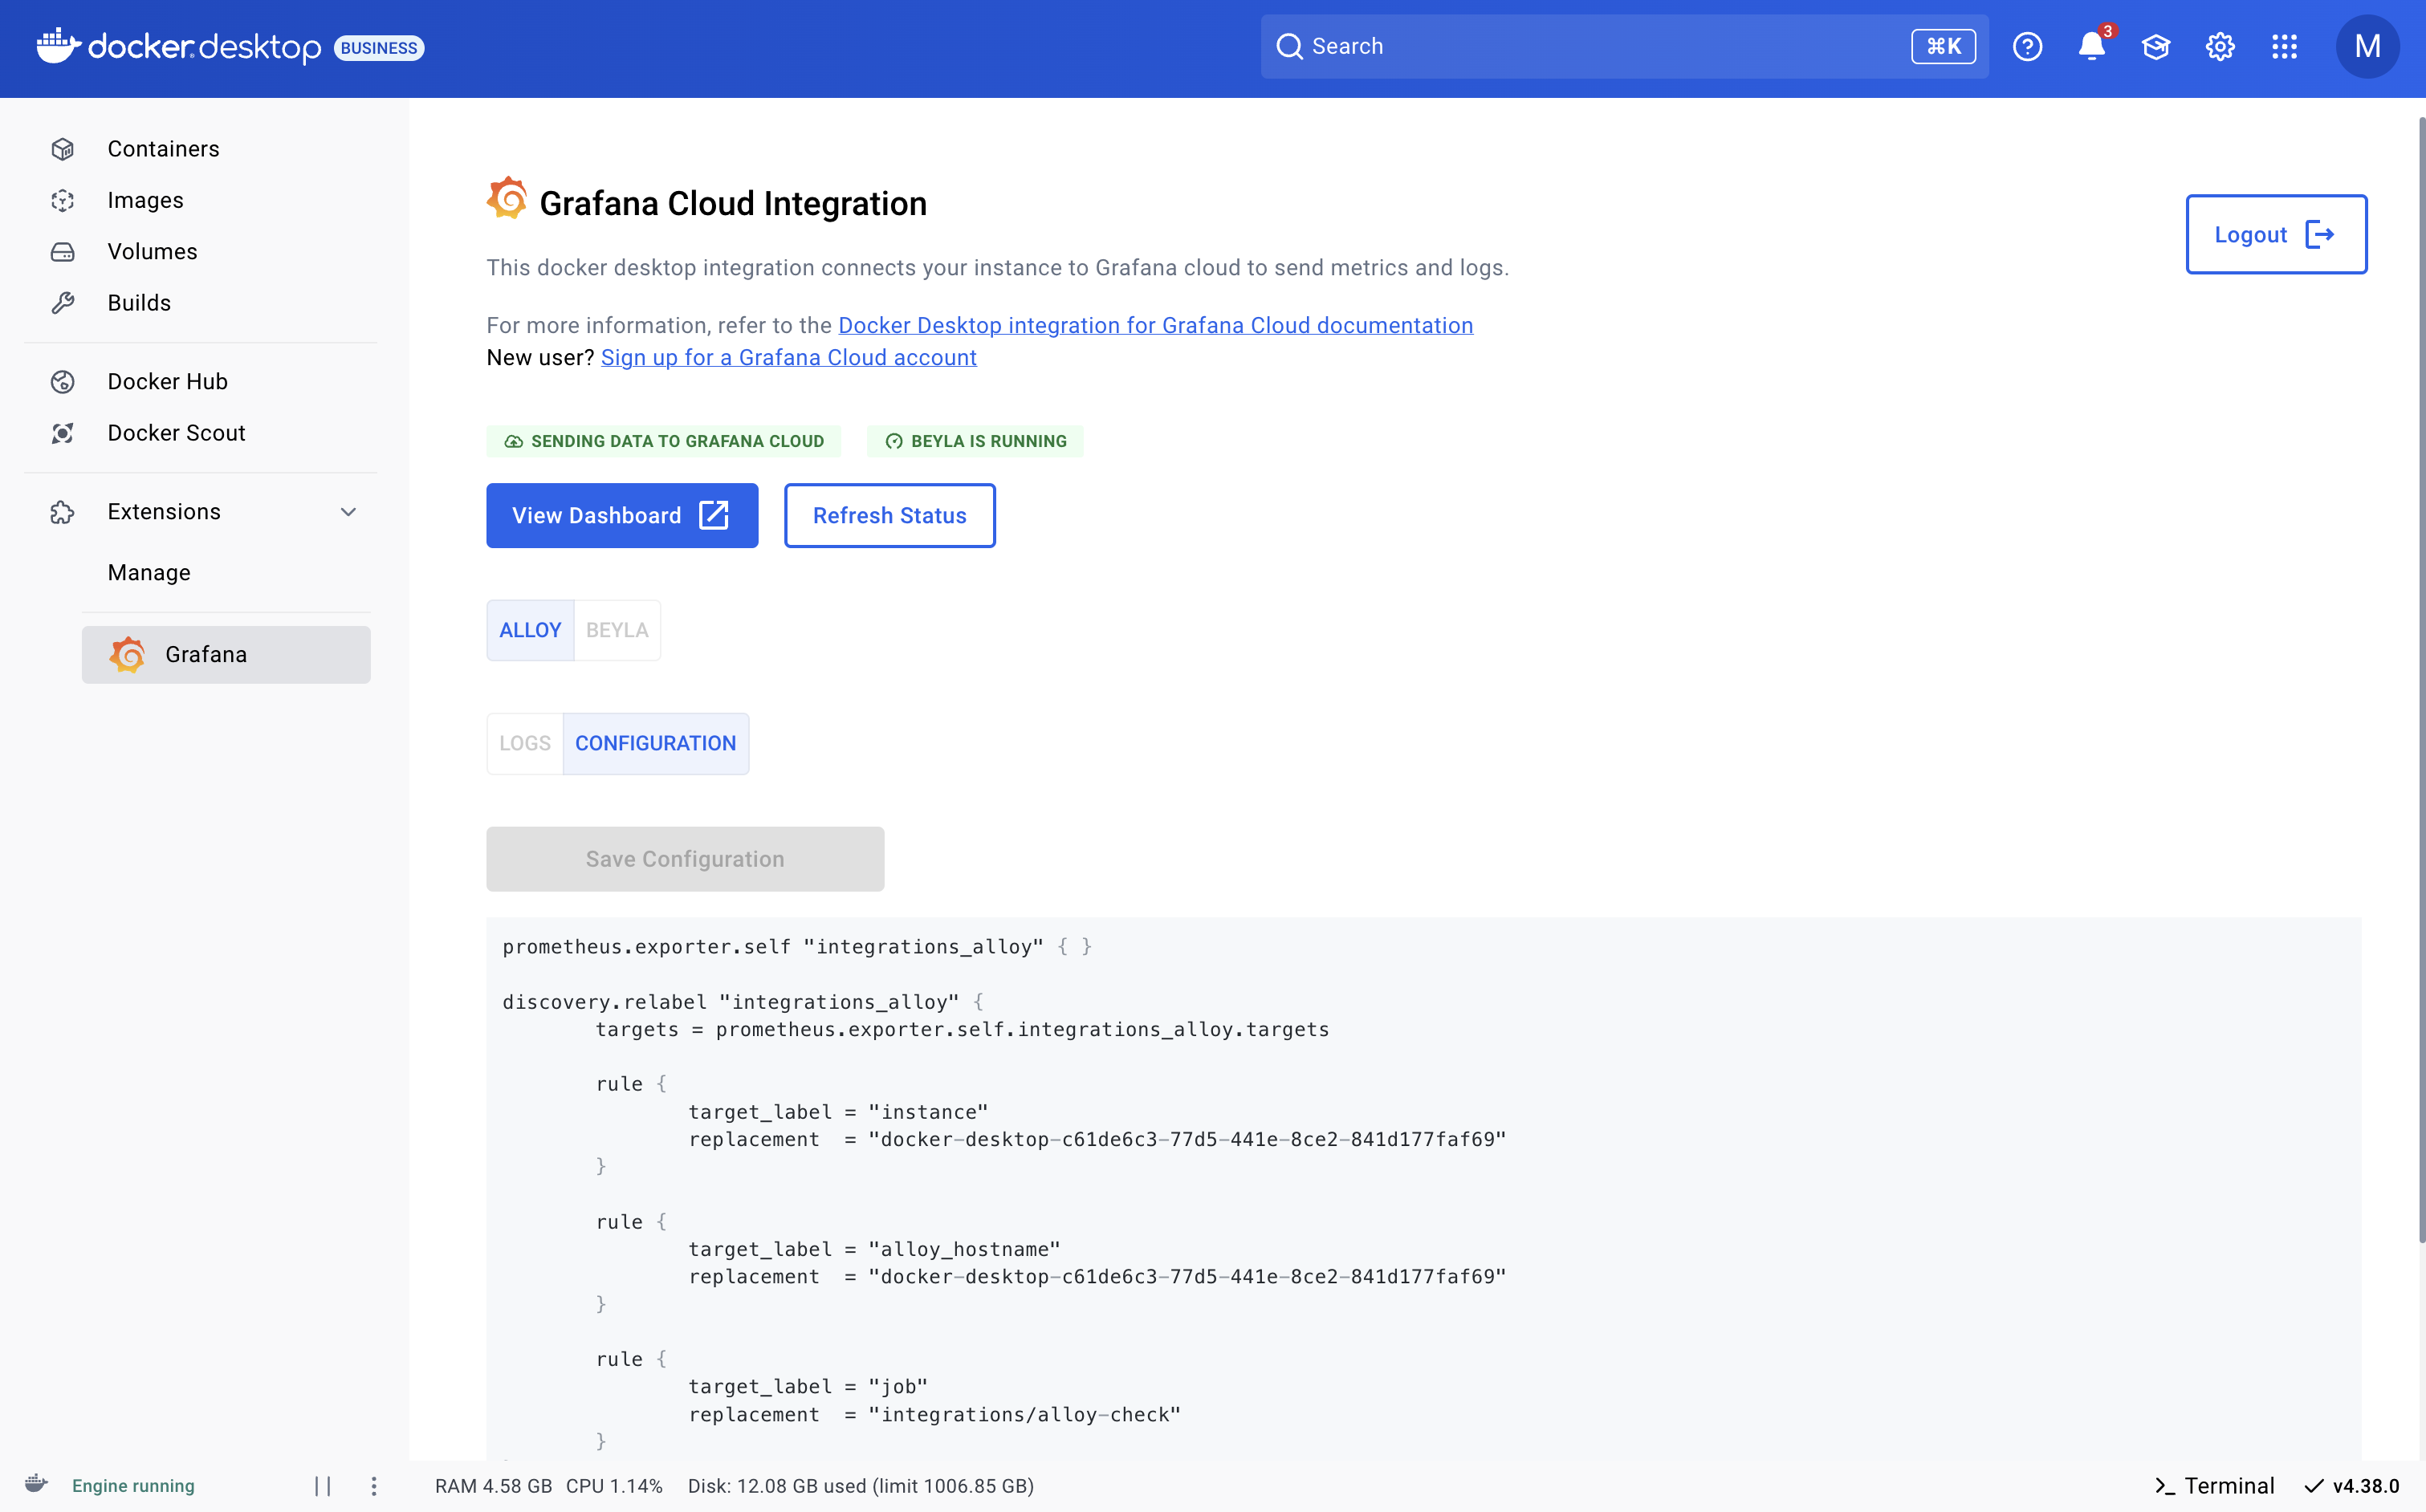
Alloy control panel
The alloy control panel shows the status of the Grafana alloy running inside the docker desktop extension. It also allows you to view the logs of the alloy container and edit the alloy configuration file if required.
Enabling other integrations
The alloy configuration file can be edited from the Alloy control panel UI to enable other integrations from the alloy or add further metrics or logs targets. In order for the grafana alloy container inside the extension to access the docker host, connect it to the default network using:
docker network connect bridge grafana-docker-desktop-extension-alloy
Then the alloy service can access the docker desktop host using host.docker.internal hostname.
Dashboards
The Docker Desktop integration installs the following dashboards in your Grafana Cloud instance to help monitor your system.
- Docker Desktop - CPU and system
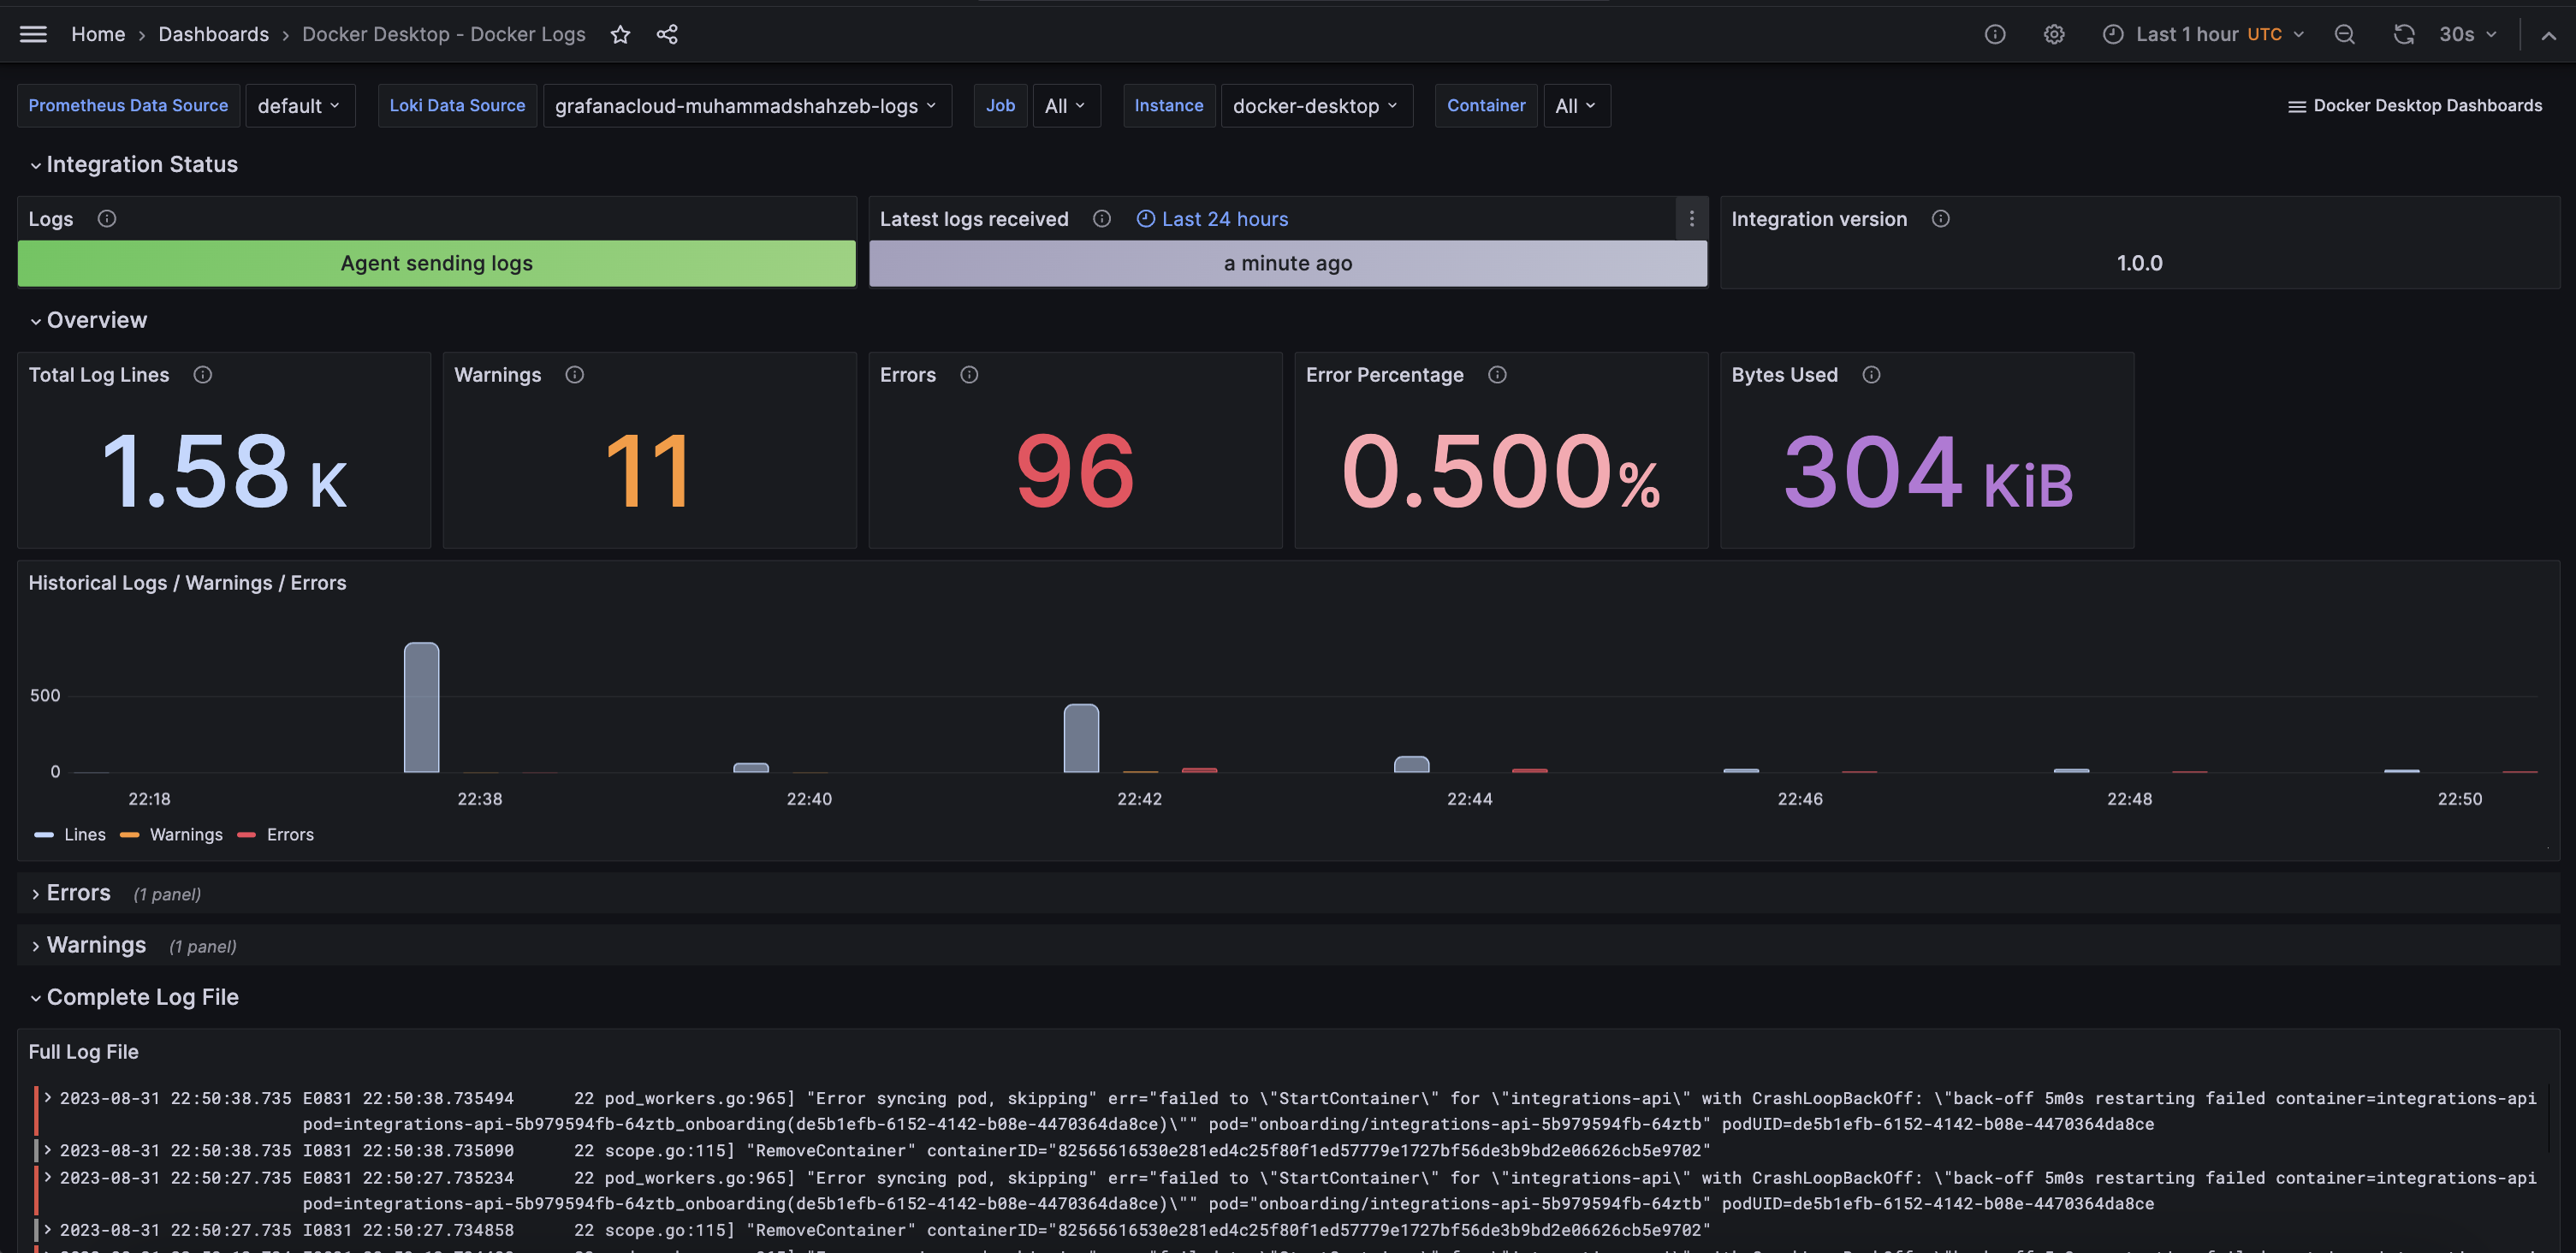
- Docker Desktop - Docker logs
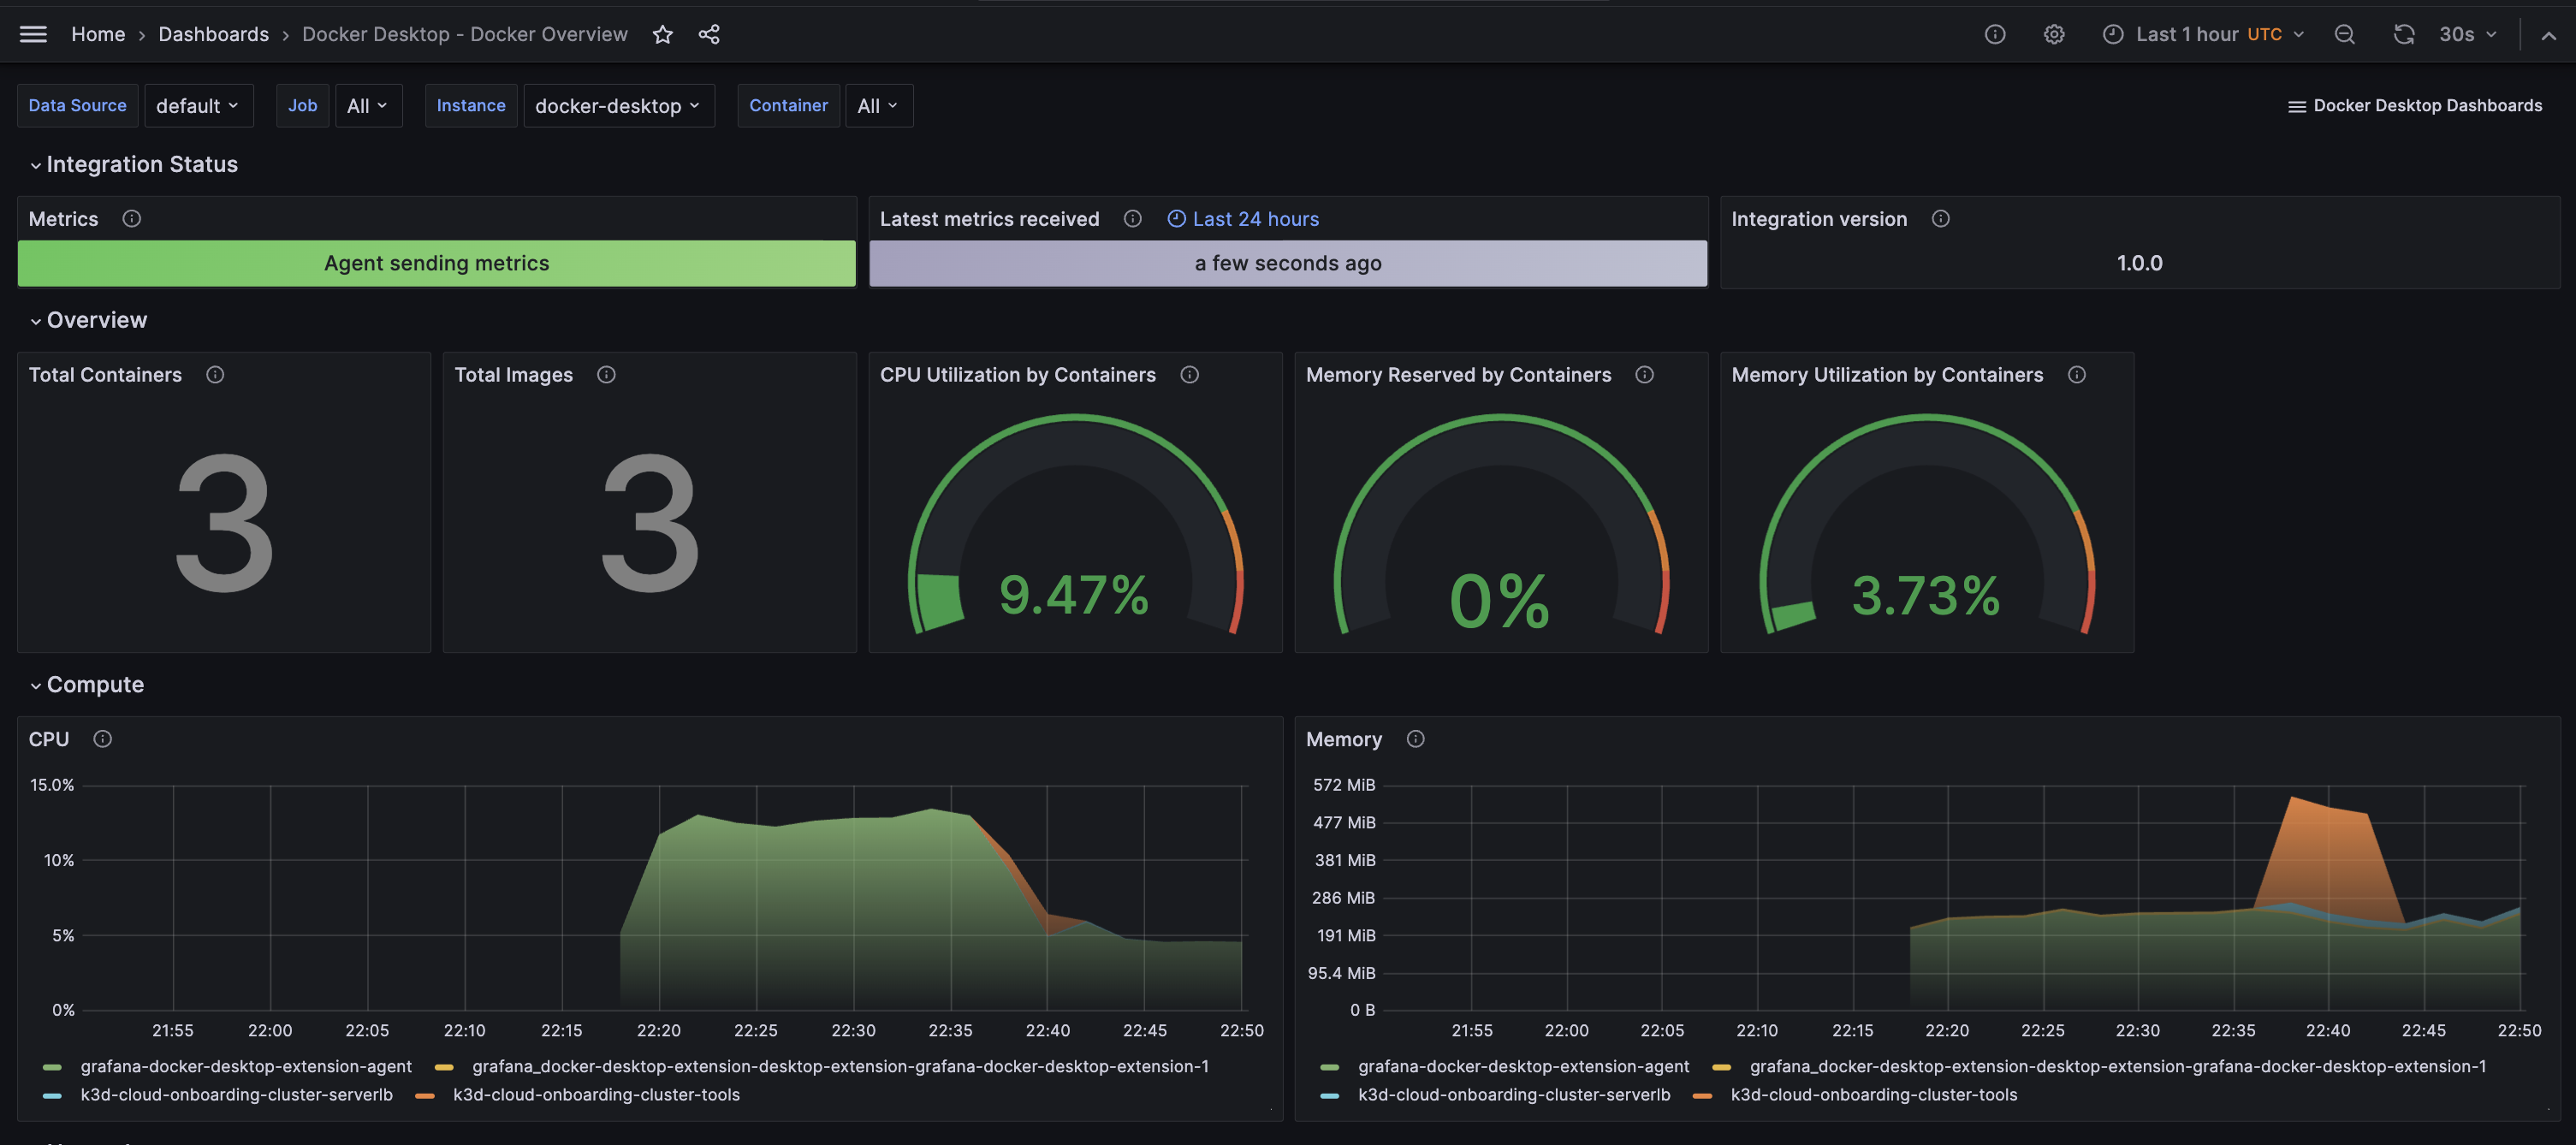
- Docker Desktop - Docker overview
- Docker Desktop - filesystem and disks
- Docker Desktop - fleet overview
- Docker Desktop - logs
- Docker Desktop - memory
- Docker Desktop - network
- Docker Desktop - overview
Docker Overview & Compute
Docker Logs
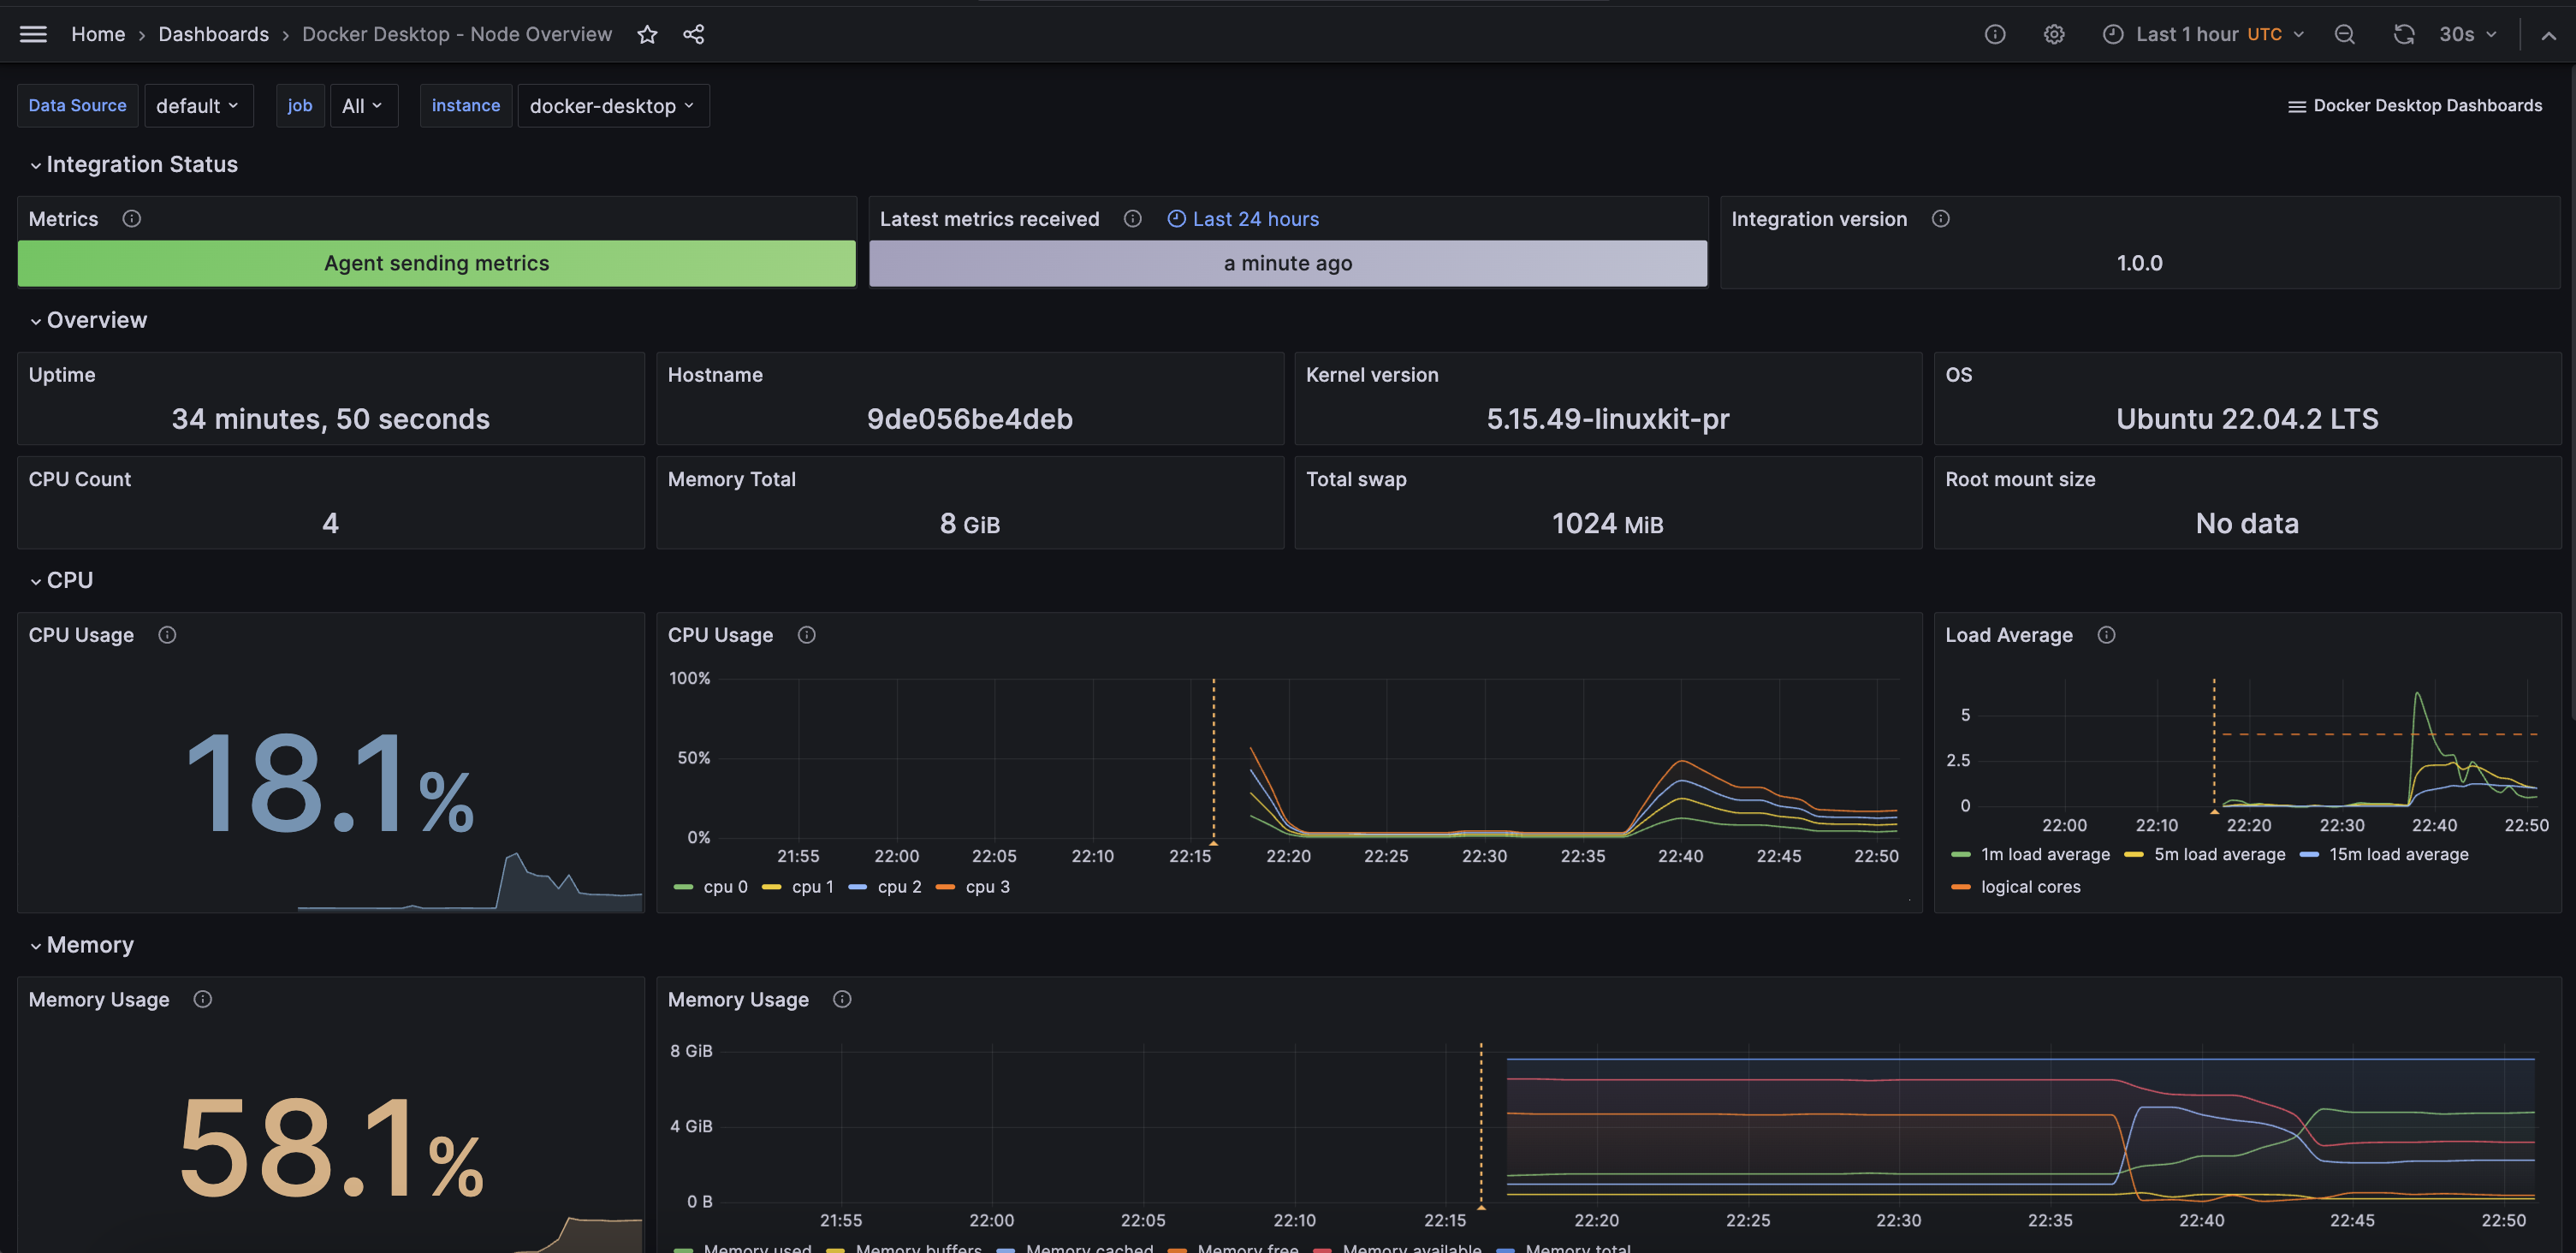
Docker Linux Virtual Machine Overview and Logs
Alerts
The Docker Desktop integration includes the following useful alerts:
integration-docker-desktop-filesystem-alerts
integration-docker-desktop-alerts
Metrics
The most important metrics provided by the Docker Desktop integration, which are used on the pre-built dashboards and Prometheus alerts, are as follows:
- container_cpu_usage_seconds_total
- container_fs_reads_total
- container_fs_usage_bytes
- container_fs_writes_total
- container_last_seen
- container_memory_usage_bytes
- container_network_receive_bytes_total
- container_network_receive_errors_total
- container_network_receive_packets_dropped_total
- container_network_transmit_bytes_total
- container_network_transmit_errors_total
- container_network_transmit_packets_dropped_total
- container_spec_memory_reservation_limit_bytes
- instance:node_num_cpu:sum
- machine_memory_bytes
- node_arp_entries
- node_boot_time_seconds
- node_context_switches_total
- node_cpu_seconds_total
- node_disk_io_time_seconds_total
- node_disk_io_time_weighted_seconds_total
- node_disk_read_bytes_total
- node_disk_read_time_seconds_total
- node_disk_reads_completed_total
- node_disk_write_time_seconds_total
- node_disk_writes_completed_total
- node_disk_written_bytes_total
- node_filefd_allocated
- node_filefd_maximum
- node_filesystem_avail_bytes
- node_filesystem_device_error
- node_filesystem_files
- node_filesystem_files_free
- node_filesystem_readonly
- node_filesystem_size_bytes
- node_intr_total
- node_load1
- node_load15
- node_load5
- node_md_disks
- node_md_disks_required
- node_memory_Active_anon_bytes
- node_memory_Active_bytes
- node_memory_Active_file_bytes
- node_memory_AnonHugePages_bytes
- node_memory_AnonPages_bytes
- node_memory_Bounce_bytes
- node_memory_Buffers_bytes
- node_memory_Cached_bytes
- node_memory_CommitLimit_bytes
- node_memory_Committed_AS_bytes
- node_memory_DirectMap1G_bytes
- node_memory_DirectMap2M_bytes
- node_memory_DirectMap4k_bytes
- node_memory_Dirty_bytes
- node_memory_HugePages_Free
- node_memory_HugePages_Rsvd
- node_memory_HugePages_Surp
- node_memory_HugePages_Total
- node_memory_Hugepagesize_bytes
- node_memory_Inactive_anon_bytes
- node_memory_Inactive_bytes
- node_memory_Inactive_file_bytes
- node_memory_Mapped_bytes
- node_memory_MemAvailable_bytes
- node_memory_MemFree_bytes
- node_memory_MemTotal_bytes
- node_memory_SReclaimable_bytes
- node_memory_SUnreclaim_bytes
- node_memory_ShmemHugePages_bytes
- node_memory_ShmemPmdMapped_bytes
- node_memory_Shmem_bytes
- node_memory_Slab_bytes
- node_memory_SwapTotal_bytes
- node_memory_VmallocChunk_bytes
- node_memory_VmallocTotal_bytes
- node_memory_VmallocUsed_bytes
- node_memory_WritebackTmp_bytes
- node_memory_Writeback_bytes
- node_netstat_Icmp6_InErrors
- node_netstat_Icmp6_InMsgs
- node_netstat_Icmp6_OutMsgs
- node_netstat_Icmp_InErrors
- node_netstat_Icmp_InMsgs
- node_netstat_Icmp_OutMsgs
- node_netstat_IpExt_InOctets
- node_netstat_IpExt_OutOctets
- node_netstat_TcpExt_ListenDrops
- node_netstat_TcpExt_ListenOverflows
- node_netstat_TcpExt_TCPSynRetrans
- node_netstat_Tcp_InErrs
- node_netstat_Tcp_InSegs
- node_netstat_Tcp_OutRsts
- node_netstat_Tcp_OutSegs
- node_netstat_Tcp_RetransSegs
- node_netstat_Udp6_InDatagrams
- node_netstat_Udp6_InErrors
- node_netstat_Udp6_NoPorts
- node_netstat_Udp6_OutDatagrams
- node_netstat_Udp6_RcvbufErrors
- node_netstat_Udp6_SndbufErrors
- node_netstat_UdpLite_InErrors
- node_netstat_Udp_InDatagrams
- node_netstat_Udp_InErrors
- node_netstat_Udp_NoPorts
- node_netstat_Udp_OutDatagrams
- node_netstat_Udp_RcvbufErrors
- node_netstat_Udp_SndbufErrors
- node_network_carrier
- node_network_info
- node_network_mtu_bytes
- node_network_receive_bytes_total
- node_network_receive_compressed_total
- node_network_receive_drop_total
- node_network_receive_errs_total
- node_network_receive_fifo_total
- node_network_receive_multicast_total
- node_network_receive_packets_total
- node_network_speed_bytes
- node_network_transmit_bytes_total
- node_network_transmit_compressed_total
- node_network_transmit_drop_total
- node_network_transmit_errs_total
- node_network_transmit_fifo_total
- node_network_transmit_multicast_total
- node_network_transmit_packets_total
- node_network_transmit_queue_length
- node_network_up
- node_nf_conntrack_entries
- node_nf_conntrack_entries_limit
- node_os_info
- node_procs_running
- node_sockstat_FRAG6_inuse
- node_sockstat_FRAG_inuse
- node_sockstat_RAW6_inuse
- node_sockstat_RAW_inuse
- node_sockstat_TCP6_inuse
- node_sockstat_TCP_alloc
- node_sockstat_TCP_inuse
- node_sockstat_TCP_mem
- node_sockstat_TCP_mem_bytes
- node_sockstat_TCP_orphan
- node_sockstat_TCP_tw
- node_sockstat_UDP6_inuse
- node_sockstat_UDPLITE6_inuse
- node_sockstat_UDPLITE_inuse
- node_sockstat_UDP_inuse
- node_sockstat_UDP_mem
- node_sockstat_UDP_mem_bytes
- node_sockstat_sockets_used
- node_softnet_dropped_total
- node_softnet_processed_total
- node_softnet_times_squeezed_total
- node_systemd_service_restart_total
- node_systemd_unit_state
- node_textfile_scrape_error
- node_time_zone_offset_seconds
- node_timex_estimated_error_seconds
- node_timex_maxerror_seconds
- node_timex_offset_seconds
- node_timex_sync_status
- node_uname_info
- node_vmstat_oom_kill
- node_vmstat_pgfault
- node_vmstat_pgmajfault
- node_vmstat_pgpgin
- node_vmstat_pgpgout
- node_vmstat_pswpin
- node_vmstat_pswpout
- process_max_fds
- process_open_fds
- up
Changelog
# 2.0.0 - January 2025

- Only return latest metric in status panel check query
- Updates embedded mixins of both node exporter and docker

# 1.0.3 - November 2024

- Update status panel check queries

# 1.0.2 - January 2024

* Update regex to match labels sent by updated docker desktop extension

# 1.0.1 - January 2024

* Update mixin to remove deprecated angular panels

# 1.0.0 - September 2023

* Add updated status panels
* Update linux mixin
    * This update introduces 3-tier view of linux nodes:
    * TOP: Fleet view: see group of your linux instances at once
    * Overview of the specific node: see specific node at a glance
    * Drill down: Set of dashboards for deep analysis using advanced metrics (Memory, CPU and System, Filesystem and Disk, Networking)
    * Links and data links are provided for better navigation between views

# 0.0.2 - August 2023

* Add regex filter for logs datasource

# 0.0.1 - April 2023

* Initial release
Cost
By connecting your Docker Desktop instance to Grafana Cloud, you might incur charges. To view information on the number of active series that your Grafana Cloud account uses for metrics included in each Cloud tier, see Active series and dpm usage and Cloud tier pricing.


