Manage projects
Use Projects to organize k6 tests in collections and grant access to these collections. Some ways to stay organized with Projects include the following:
- Per team. Each team is given their own project for them to do their work and collaborate.
- Per component. A project is created for each component or service you’re testing.
- Per brand. E-commerce customers may want to use projects per brand to stay organized.
- Per customer. When dealing with custom software, you can to organize by customer to ensure each unique system is tested.
- Per major release. After your systems go through a major change, you can to create a new project to organize the most recent data.
Note
To invite users to a project, refer to Manage user or team project access.
Project activity
The Project activity helps you get a brief overview of what’s happening in your projects.
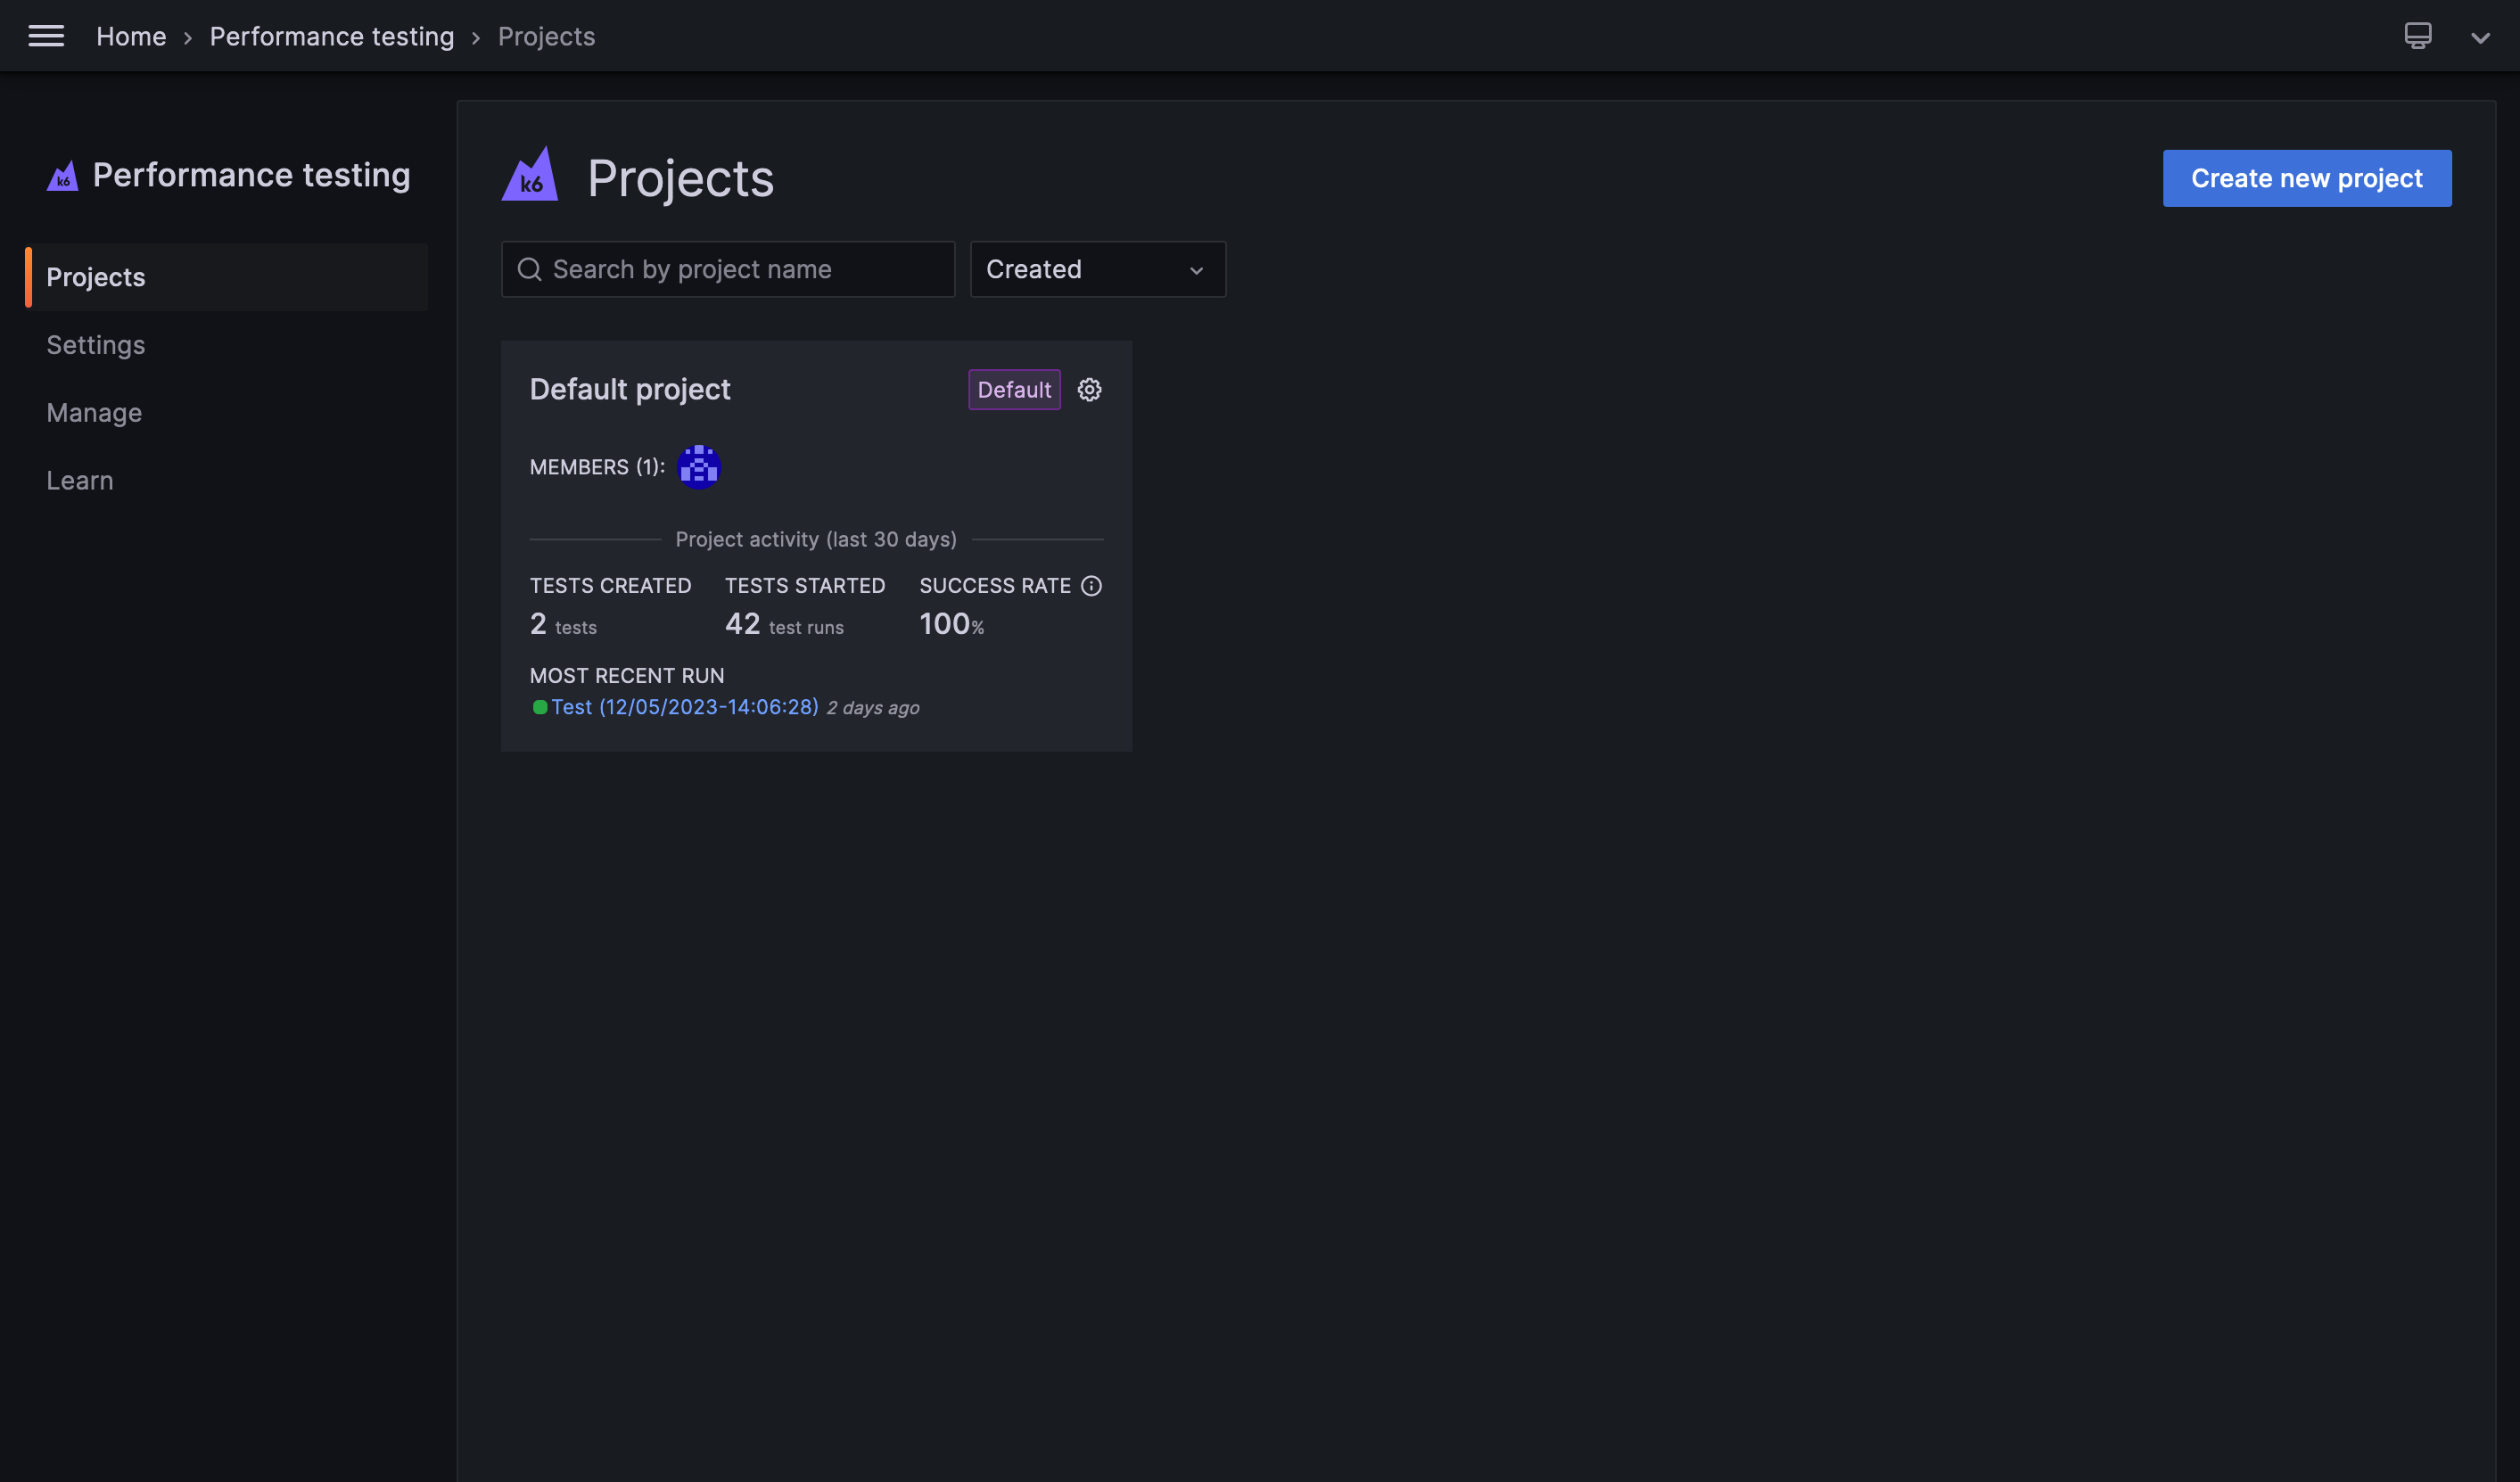
To view the Project activity, go to Performance testing > Projects. Each project card will display the following stats for the past 30 days:
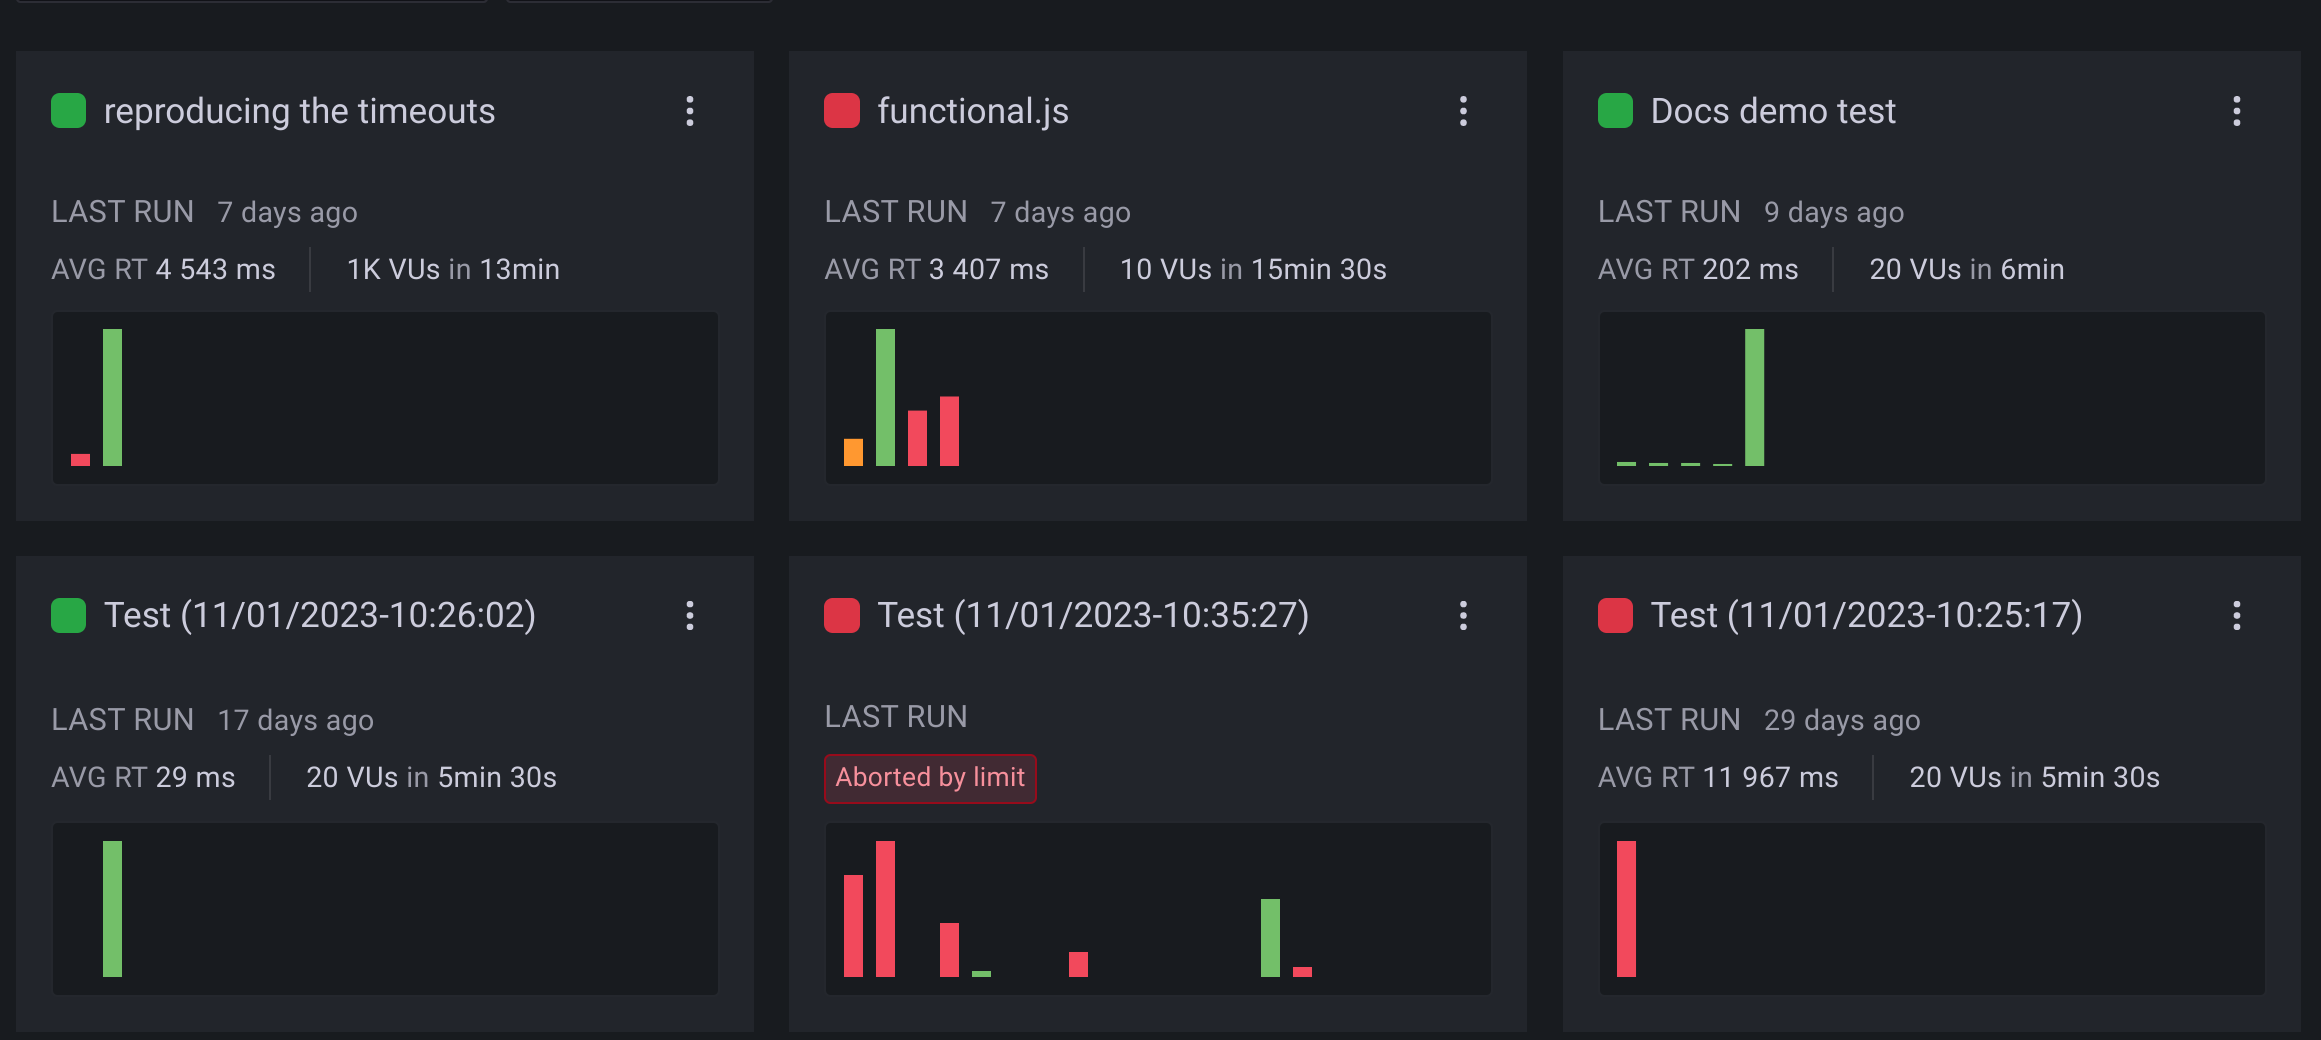
Project overview
When you select a project from the Projects page, you can see an overview of all the tests in that project. Each test is comprised of individual test runs represented by bars in a chart. The bar length represents the values reported by the trending metric, and the color represents the test status.
Project ID
Each project has a unique identifier. You can view the project ID in the project overview page, under the project name.
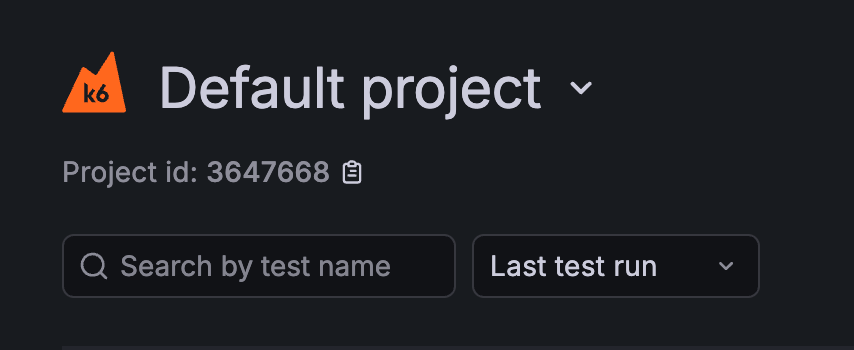
The project ID can be used to:
- Run tests from the CLI in a specific project.
- Interact with projects using the Grafana Cloud k6 API. For example, moving a test to a different project.
Group tests together
k6 groups test runs according to the test name. The name of the test is determined by one of the following:
- The test name in the Test Builder
- The test script filename
- The value of the
options.cloud.nameproperty in the test script (this overrides the filename).
Test run status
The color of the bar for a test run indicates its status:
- Green indicates the test finished with no failed thresholds.
- Yellow indicates that the test was interrupted.
- Red indicates that the test failed one or more thresholds.
For details of all test statuses, refer to Cloud test status codes.


