Catchpoint integration for Grafana Cloud
Catchpoint is a digital experience monitoring platform that provides real-time insights into the performance and availability of websites, applications, and infrastructure. It offers synthetic monitoring, real user monitoring (RUM), and network insights to help organizations proactively detect and resolve issues affecting user experience. Catchpoint enables businesses to ensure optimal performance, minimize downtime, and deliver exceptional digital experiences to their customers.
This integration includes 5 useful alerts and 3 pre-built dashboards to help monitor and visualize Catchpoint metrics.
Before you begin
Catchpoint
To receive data from Catchpoint, you need to set up a webhook that points to the URL where this exporter is running. Follow these steps to configure the webhook in Catchpoint:
- Log in to your Catchpoint account.
- Navigate to Settings > API > Test Data Webhooks.
- Click Add URL.
- Set the “URL” to
http://<your_exporter_address>:<port>/catchpoint-webhook, where<your_exporter_address>is the IP address or domain of your server where the exporter is running, and<port>is configured as per theCATCHPOINT_EXPORTER_PORT. - Add the template JSON file to set up a test data webhook for the selected metrics.
- Save the webhook configuration.
Next you need to set up the webhook for tests:
- Navigate to Control Center > Tests > Select the Product Properties (or multiple) within the nav section.
- Under the Product Properties section, enable the Test Data Webhook and select the Template you just created.
- Next, under Navigate to Control Center > Tests you will see a list of test names.
- Click on each test name you wish to monitor which brings a window up.
- Under More Settings, enable the Test Data Webhook.
- Under Targeting & Scheduling, set the desired Frequency.
Exporter
To run the Catchpoint Prometheus exporter, run the following commands at the root of the exporter.
go build -o catchpoint-exporter ./cmd/catchpoint-exporter/main.go
./catchpoint-exporter  --port="9090" --webhook-path="/catchpoint-webhook --verbosity"
The exporter allows for the configuration of three parameters: port, webhook-path, and verbose.
port sets the port on which the exporter will run, defaults to 9090.
webhook-path defines the path where the exporter will receive webhook data from Catchpoint, defaults to /catchpoint-webhook.
verbose enables verbose logging to provide more detailed output for debugging purposes, defaults to false.
More information about the exporter can be found here.
Install Catchpoint integration for Grafana Cloud
- In your Grafana Cloud stack, click Connections in the left-hand menu.
- Find Catchpoint and click its tile to open the integration.
- Review the prerequisites in the Configuration Details tab and set up Grafana Alloy to send Catchpoint metrics to your Grafana Cloud instance.
- Click Install to add this integration’s pre-built dashboards and alerts to your Grafana Cloud instance, and you can start monitoring your Catchpoint setup.
Configuration snippets for Grafana Alloy
Advanced mode
The following snippets provide examples to guide you through the configuration process.
To instruct Grafana Alloy to scrape your Catchpoint instances, manually copy and append the snippets to your alloy configuration file, then follow subsequent instructions.
Advanced metrics snippets
prometheus.scrape "metrics_integrations_integrations_catchpoint" {
	targets = [{
		__address__       = "<catchpoint-hostname>:<catchpoint-exporter-port>",
	}]
	forward_to = [prometheus.remote_write.metrics_service.receiver]
	job_name   = "integrations/catchpoint"
}
To monitor your Catchpoint instance, you must use a discovery.relabel component to discover your Catchpoint Prometheus endpoint and apply appropriate labels, followed by a prometheus.scrape component to scrape it.
Configure the following properties within each discovery.relabel component:
__address__: The address to your Catchpoint Prometheus metrics endpoint.instancelabel:constants.hostnamesets theinstancelabel to your Grafana Alloy server hostname. If that is not suitable, change it to a value uniquely identifies this Catchpoint instance. Make sure this label value is the same for all telemetry data collected for this instance.
If you have multiple Catchpoint instances to scrape, configure one discovery.relabel for each and scrape them by including each under targets within the prometheus.scrape component.
Dashboards
The Catchpoint integration installs the following dashboards in your Grafana Cloud instance to help monitor your system.
- Catchpoint overview
- Catchpoint web performance by node
- Catchpoint web performance by test
Catchpoint overview

Catchpoint overview (connectivity)

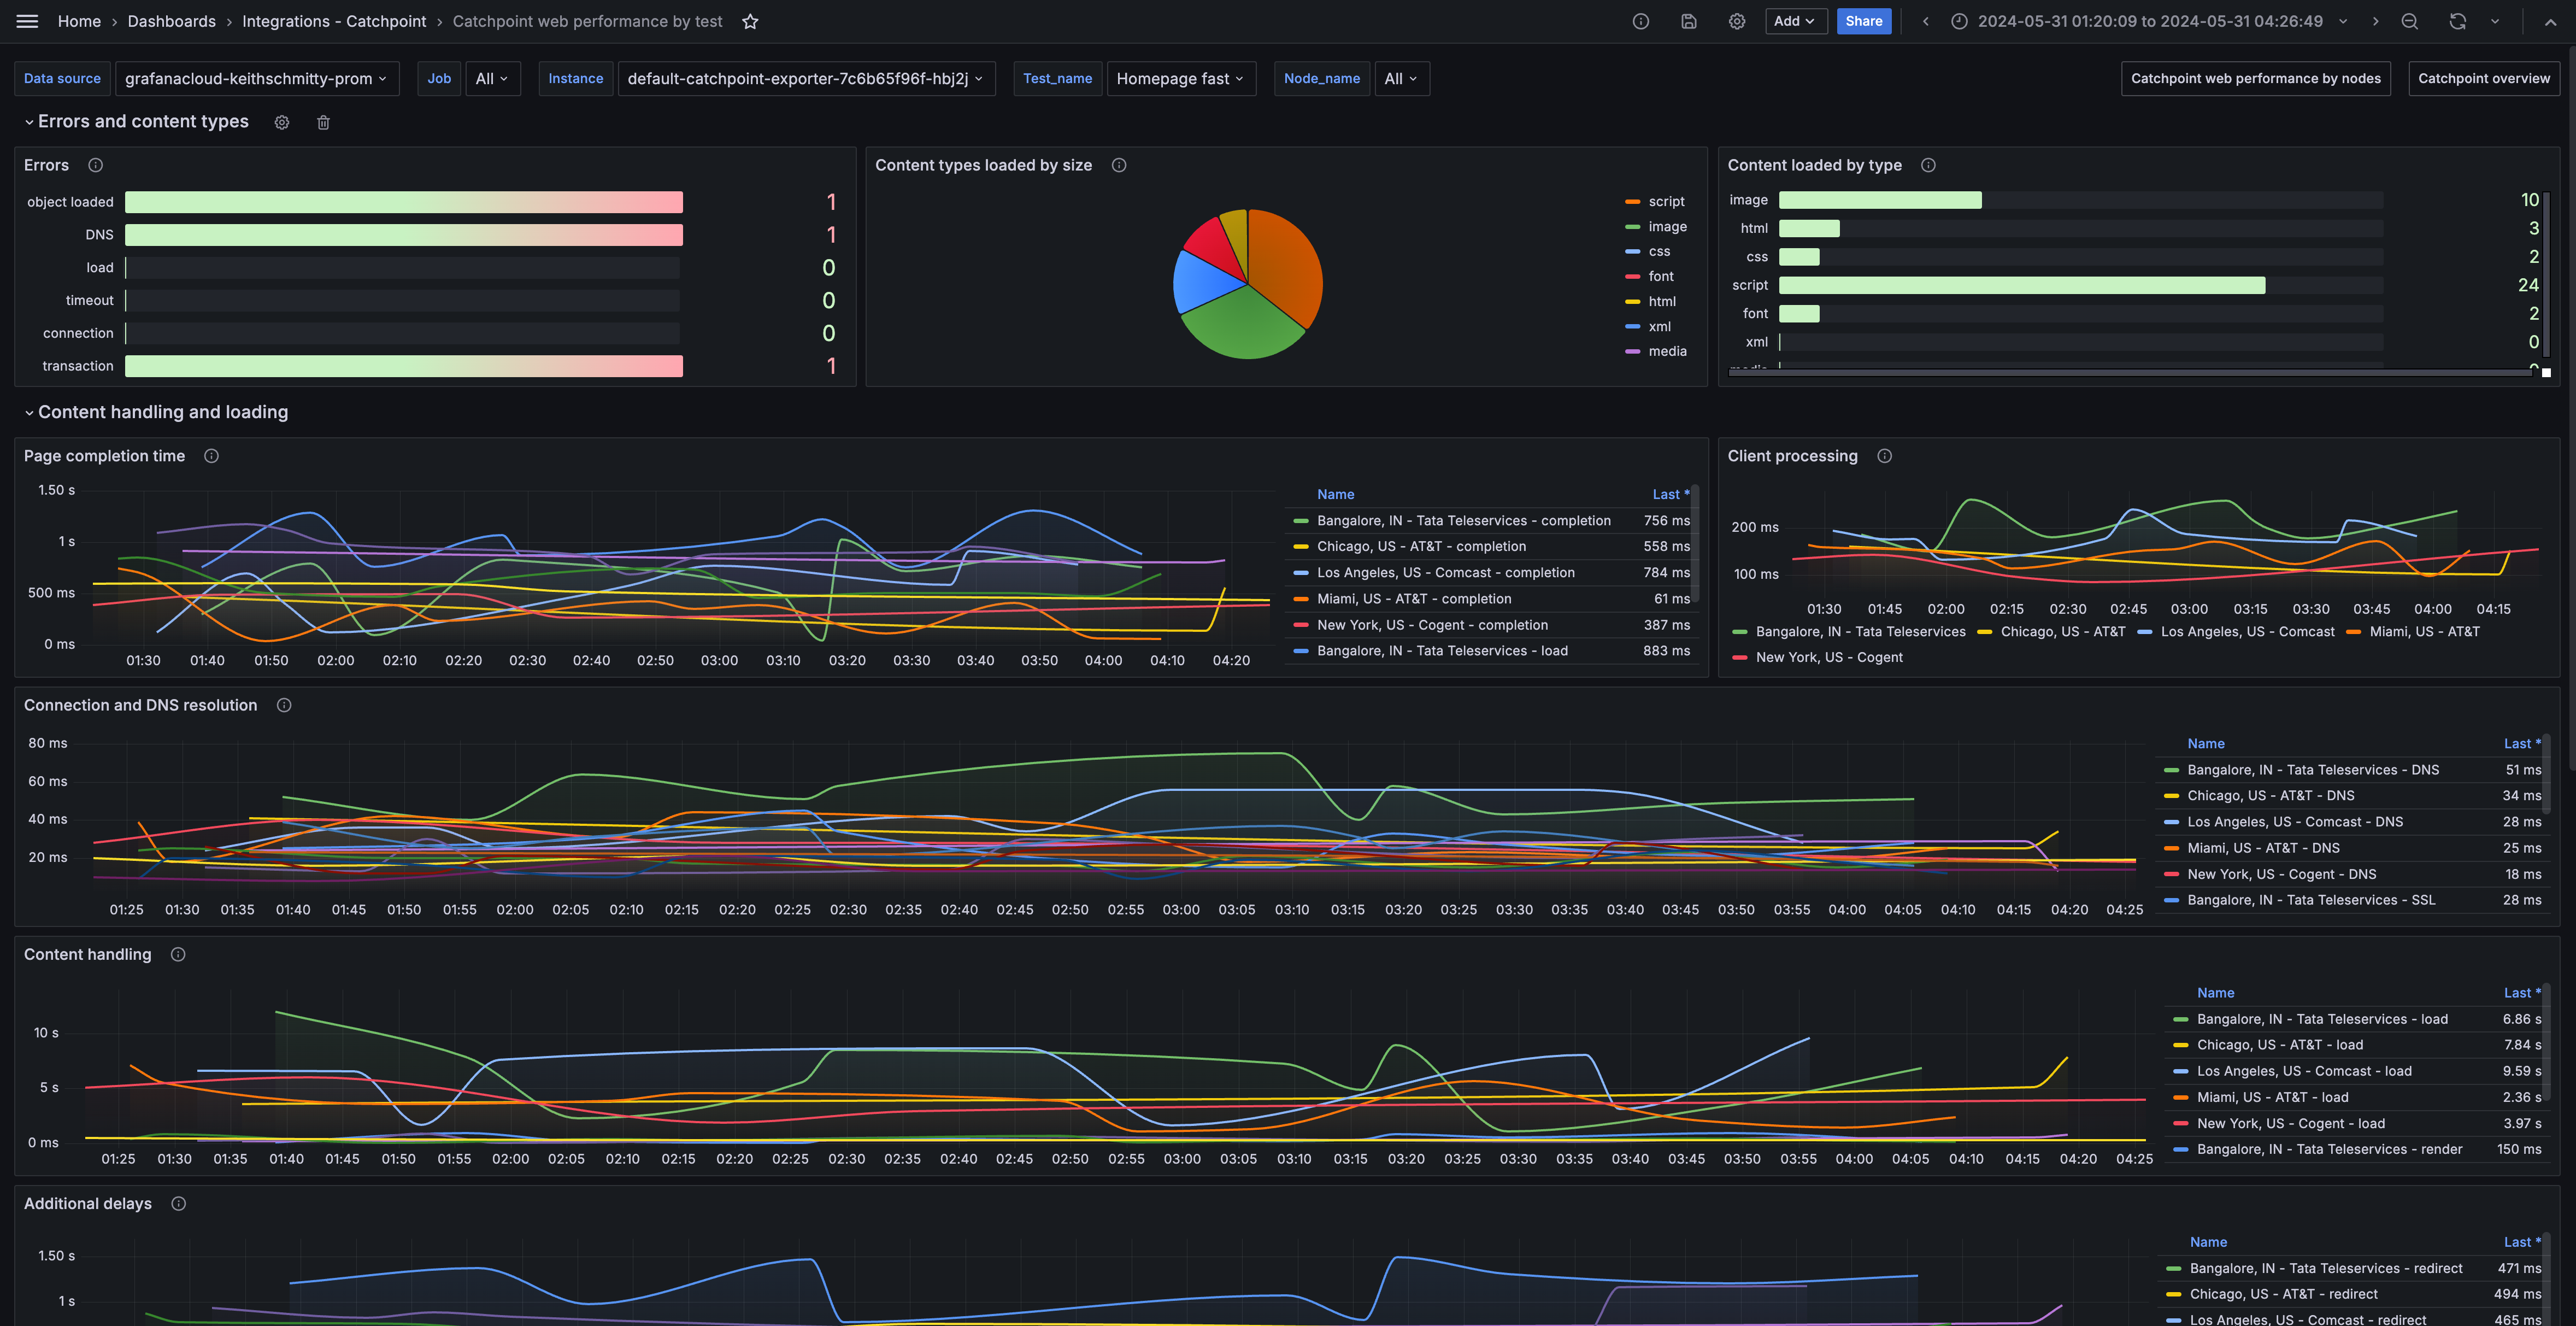
Catchpoint web performance by test
Alerts
The Catchpoint integration includes the following useful alerts:
Metrics
The most important metrics provided by the Catchpoint integration, which are used on the pre-built dashboards and Prometheus alerts, are as follows:
- catchpoint_any_error
- catchpoint_cached_count
- catchpoint_client_time
- catchpoint_connect_time
- catchpoint_connection_error
- catchpoint_connections_count
- catchpoint_content_load_time
- catchpoint_css_content_type
- catchpoint_css_count
- catchpoint_dns_error
- catchpoint_dns_time
- catchpoint_document_complete_time
- catchpoint_error_objects_loaded
- catchpoint_failed_requests_count
- catchpoint_font_content_type
- catchpoint_font_count
- catchpoint_hosts_count
- catchpoint_html_content_type
- catchpoint_html_count
- catchpoint_image_content_type
- catchpoint_image_count
- catchpoint_load_error
- catchpoint_load_time
- catchpoint_media_content_type
- catchpoint_media_count
- catchpoint_redirect_time
- catchpoint_redirections_count
- catchpoint_render_start_time
- catchpoint_requests_count
- catchpoint_response_content_size
- catchpoint_response_header_size
- catchpoint_script_content_type
- catchpoint_script_count
- catchpoint_ssl_time
- catchpoint_timeout_error
- catchpoint_total_content_size
- catchpoint_total_header_size
- catchpoint_total_time
- catchpoint_transaction_error
- catchpoint_wait_time
- catchpoint_xml_content_type
- catchpoint_xml_count
- up
Changelog
# 1.0.1 - November 2024

- Update status panel check queries

# 1.0.0 - June 2024

- Initial release
Cost
By connecting your Catchpoint instance to Grafana Cloud, you might incur charges. To view information on the number of active series that your Grafana Cloud account uses for metrics included in each Cloud tier, see Active series and dpm usage and Cloud tier pricing.


