
Beyla integration for Grafana Cloud
Grafana Beyla is an eBPF-based application auto-instrumentation tool to easily get started with Application Observability. Beyla uses eBPF to automatically inspect application executables and the OS networking layer, and capture trace spans related to web transactions and Rate Errors Duration (RED) metrics for Linux HTTP/S and gRPC services. All data capture occurs without any modifications to application code or configuration.
This integration includes 2 pre-built dashboards to help monitor and visualize Beyla metrics.
Before you begin
Install Beyla integration for Grafana Cloud
- In your Grafana Cloud stack, click Connections in the left-hand menu.
- Find Beyla and click its tile to open the integration.
- Review the prerequisites in the Configuration Details tab and get the Helm chart chart config to send Beyla metrics to your Grafana Cloud instance.
- Click Install to add this integration’s pre-built dashboards to your Grafana Cloud instance, and you can start monitoring your Beyla setup.
Dashboards
The Beyla integration installs the following dashboards in your Grafana Cloud instance to help monitor your system.
- Beyla RED Metrics
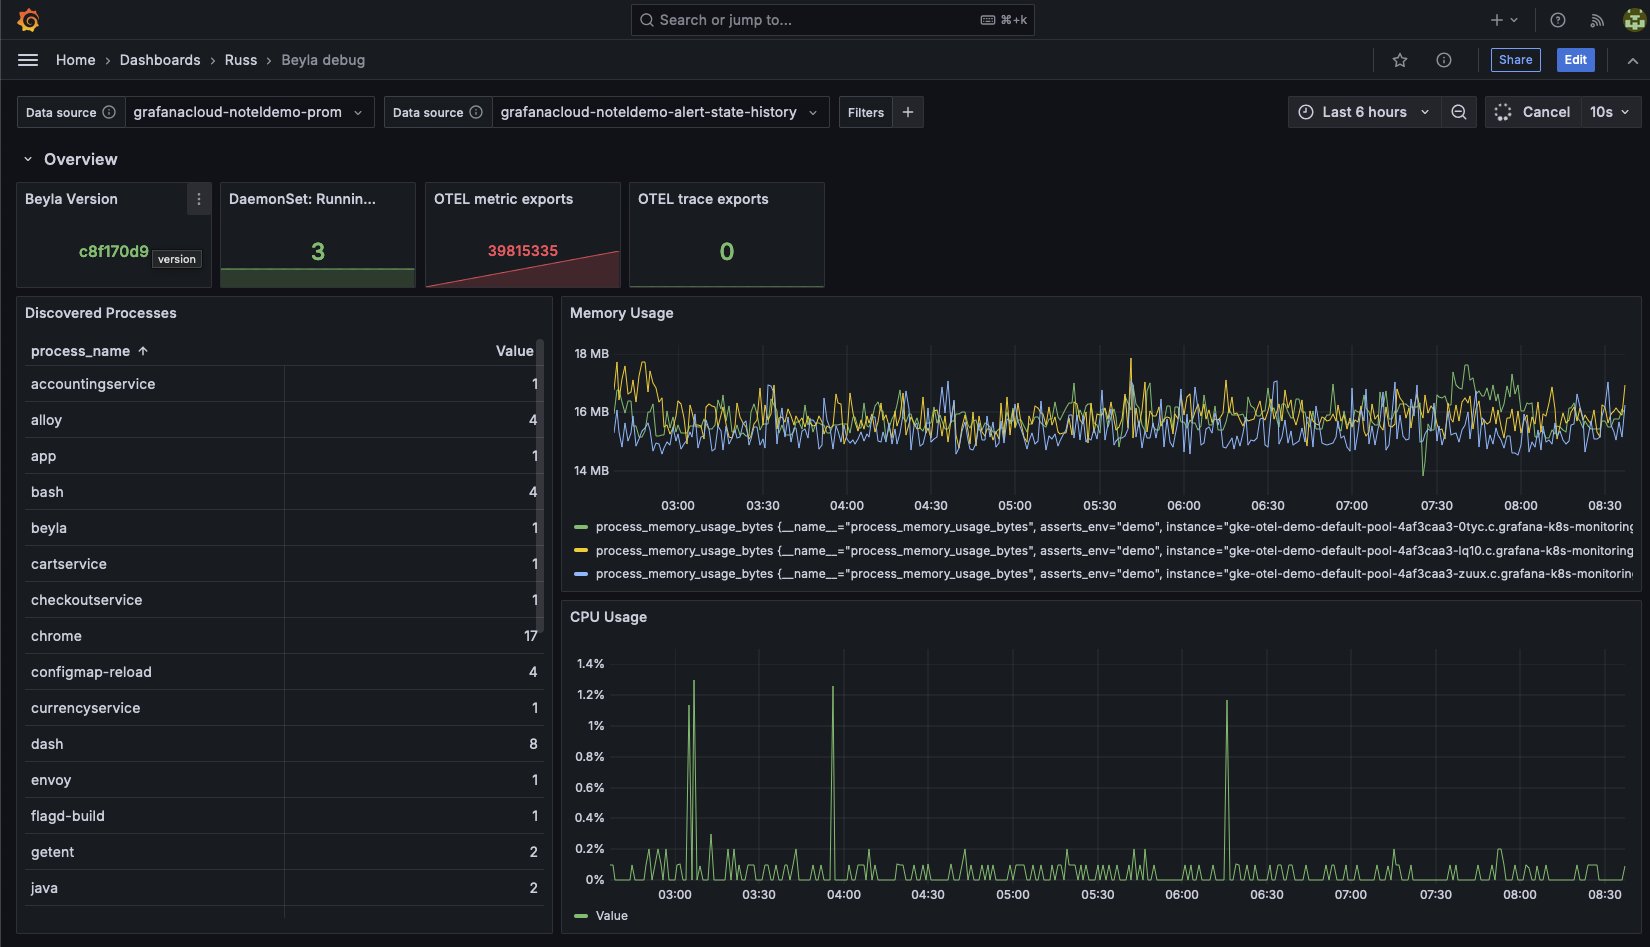
- Beyla debug
Beyla RED Metrics

Beyla debug
Metrics
The most important metrics provided by the Beyla integration, which are used on the pre-built dashboards, are as follows:
- beyla_build_info
- beyla_instrumented_processes
- beyla_otel_metric_exports_total
- beyla_otel_trace_exports_total
- kube_daemonset_status_number_ready
- process_cpu_utilization_ratio
- process_memory_usage_bytes
- rpc_server_duration_seconds_sum
- up
Changelog
# 1.0.0 - August 2024

- Initial release
Cost
By connecting your Beyla instance to Grafana Cloud, you might incur charges. To view information on the number of active series that your Grafana Cloud account uses for metrics included in each Cloud tier, see Active series and dpm usage and Cloud tier pricing.


