Configure Loopback to generate Prometheus metrics
To configure Loopback to generate Prometheus metrics, complete the following steps:
Run the following commands:
Install
--------
npm install --save @loopback/metrics

Import
--------
import {MetricsComponent} from '@loopback/metrics';
In the constructor, add the following component to your application:
this.component(MetricsComponent);For more information about additional configuration changes, refer to loopback-metrics.
Verify the presence of the following metrics in Prometheus:
- loopback_invocation_total
- loopback_invocation_duration_seconds
Metrics
Alerts
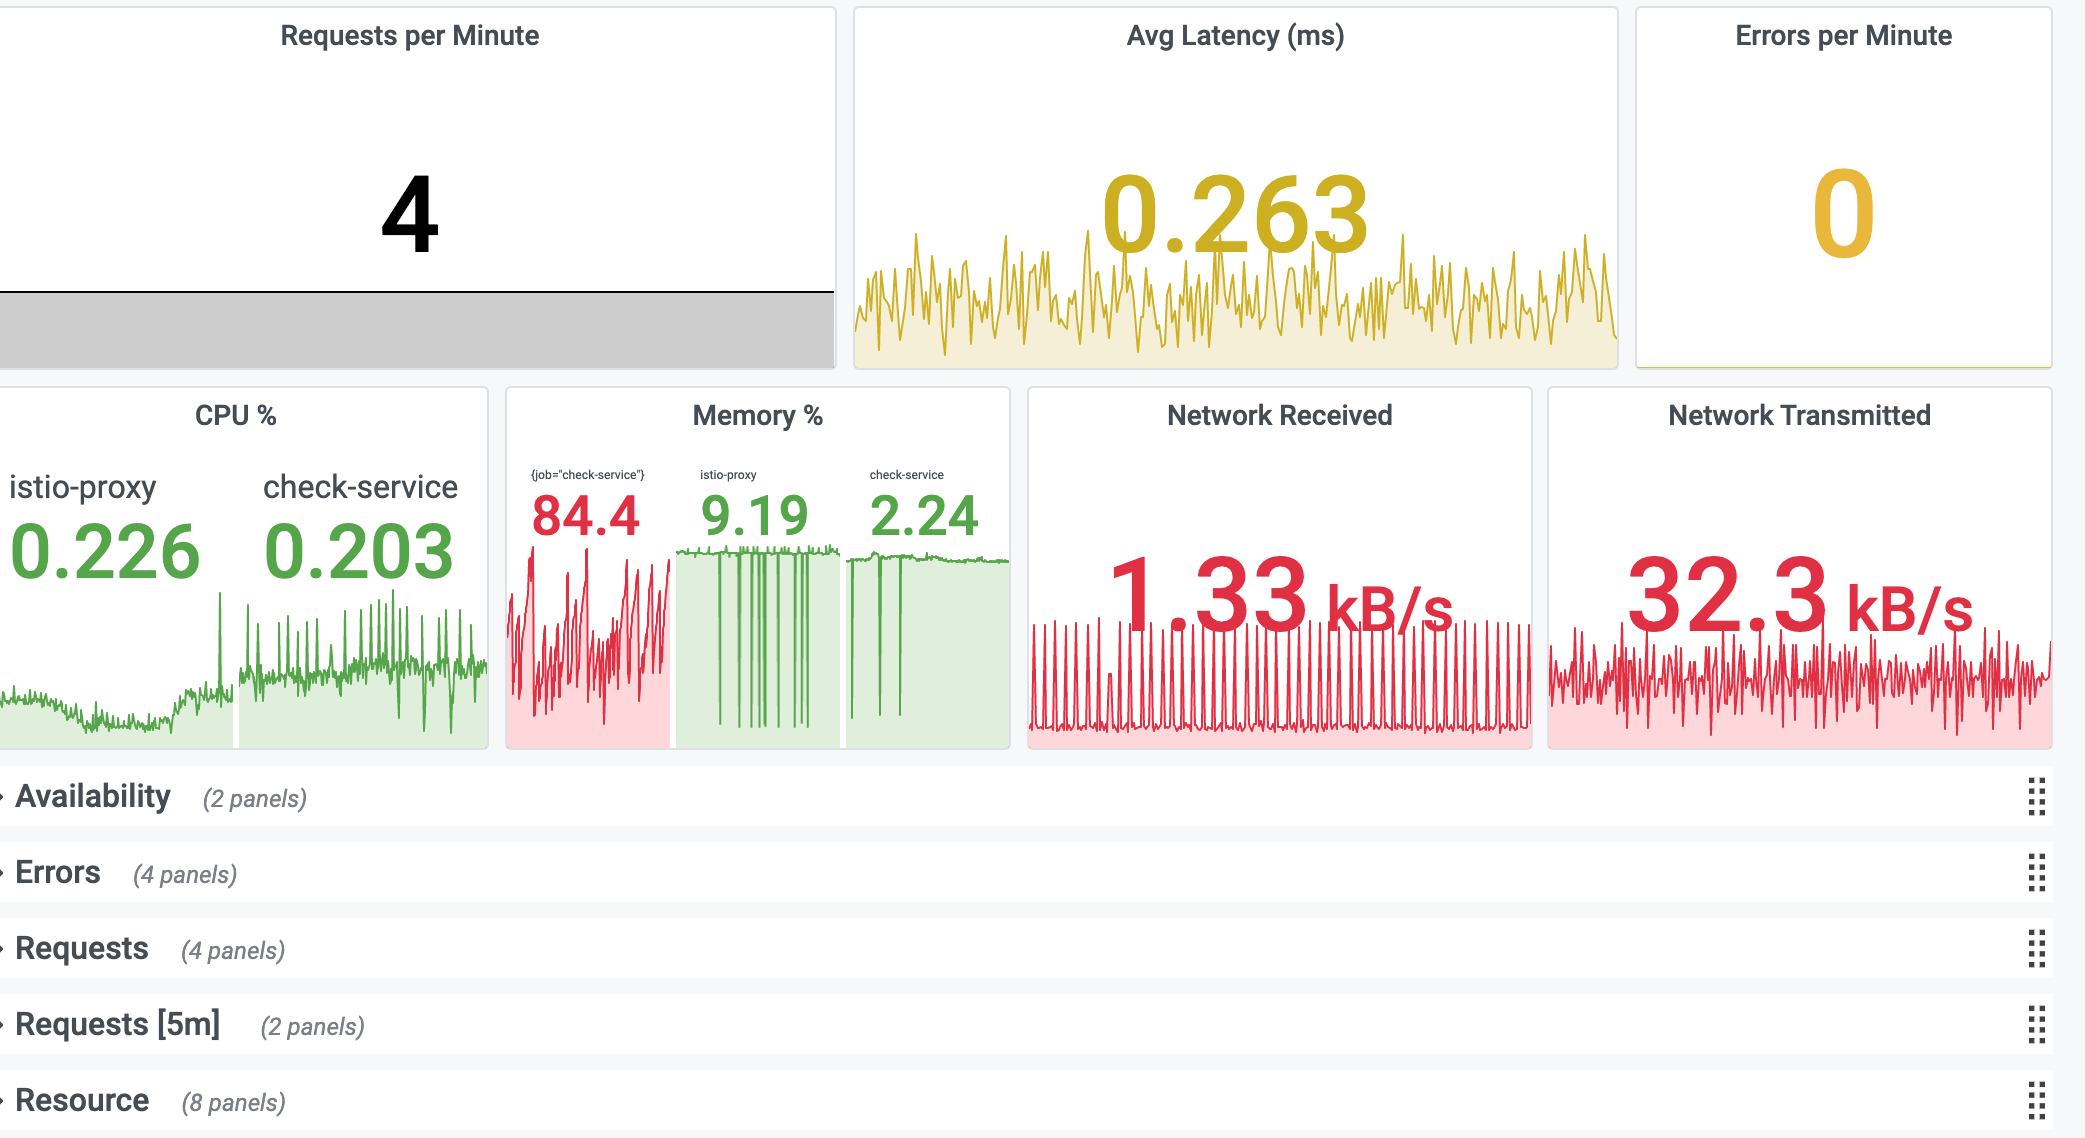
Service KPI dashboard
This dashboard has the following KPIs from resources and requests:
- Request Rate
- Latency Average
- Latency P99
- Error Rate
- CPU %
- CPU Cores Used
- CPU Throttle
- Memory %
- Memory Bytes
- Disk Usage
- Network Usage


