
Send data to the Grafana Cloud OTLP endpoint
The Grafana Cloud OTLP endpoint is OpenTelemetry Protocol (OTLP) compliant, and the recommended endpoint to send OpenTelemetry metrics, logs, and traces to Grafana Cloud.
Recommended production architecture
The recommended architecture for production observability uses Grafana Alloy, the Grafana Labs supported distribution of the OpenTelemetry Collector.
 The recommended OpenTelemetry architecture uses Grafana Alloy.
Grafana Alloy offers the following advantages over non-Collector setups:
- A robust, reliable, and scalable pipeline to handle transport issues.
- Support to enrich telemetry metadata data, for example to add
k8s.*attributes. - Support to sample and redact data, and route data to multiple observability backends.
Note
You can use other OpenTelemetry Collector distributions but need to perform additional set up and maintenance.
Quickstart architecture
For non-production observability, such as development or testing, or when it isn’t possible to deploy an OpenTelemetry Collector distribution, use OpenTelemetry instrumentation SDKs to send OTLP data directly to the OTLP endpoint.
You can use a language specific instrumentation agent or SDK for automatic or manual instrumentation with full support to send OTLP metrics, logs, and traces.
 A quickstart architecture that uses language specific agents or SDKs.
Alternatively you can use Grafana Beyla an eBPF instrumentation solution that is easy to set up and automatically instruments network-level telemetry for all languages and frameworks. Beyla supports Response, Error, and Duration metrics (RED metrics) and distributed traces.
 A quickstart architecture that uses Grafana Beyla eBPF auto-instrumentation SDK.
A quickstart architecture is easy to set up, however be aware of the following disadvantages compared to Collector-based architectures:
- Limited reliability to handle transport issues.
- No support to enrich telemetry metadata data.
- No support to sample and redact data, and route data to multiple observability backends.
Recommended OpenTelemetry setup via Grafana Cloud integrations
For most production and quickstart use cases, we recommend to use the Grafana Cloud connection tiles to set up and send OpenTelemetry data to Grafana Cloud. This opinionated approach includes all the binaries, connection parameters, and configuration snippets you need to set up OpenTelemetry.
Connection tiles are available to set up a production architecture with:
- Grafana auto-instrumentation agent for Java (JVM) and Grafana Alloy
- Grafana instrumentation SDK for .NET and Grafana Alloy
- Grafana Beyla eBPF auto-instrumentation and Grafana Alloy
- OpenTelemetry (OTLP) with Grafana Alloy, for an application already instrumented with OpenTelemetry
- The upstream OpenTelemetry Collector published by the OpenTelemetry Community, for an application already instrumented with OpenTelemetry
Note
For application-level instrumentation for programming languages other than Java (JVM) and .NET, follow the Application Observability instrumentation documentation or upstream OpenTelemetry instrumentation documentation and use the Grafana Alloy or upstream OpenTelemetry Collector connection tile to set up a Collector.
To use a Grafana Cloud connection tile to set up OpenTelemetry, follow these steps:
- Sign In to the Grafana Cloud Portal.
- From your organization Overview, select or click Launch to open a Grafana Cloud stack.
- With a stack selected, click Launch from the Grafana tile to launch Grafana Cloud.
- With Grafana Cloud launched, click Connections, or expand, then click Add new connection.
- Search for “OpenTelemetry” and press enter to filter the connection options.
- Select the desired OpenTelemetry connection tile and follow the instructions.
 Grafana Cloud connection tiles for OpenTelemetry
Manual OpenTelemetry setup for advanced users
Advanced users can manually set up OpenTelemetry components to send OpenTelemetry data to Grafana Cloud.
To send OTLP data to the Grafana Cloud OTLP endpoint you need to get your connection details from the Grafana Cloud administration console:
- Sign In to the Grafana Cloud Portal.
- From your organization Overview, select or click Launch to open a Grafana Cloud stack.
- With a stack selected, click Configure from the OpenTelemetry tile.
- Follow the instructions to generate an authentication token and OpenTelemetry environment variables for
OTEL_EXPORTER_OTLP_PROTOCOL,OTEL_EXPORTER_OTLP_ENDPOINT, andOTEL_EXPORTER_OTLP_HEADERS.
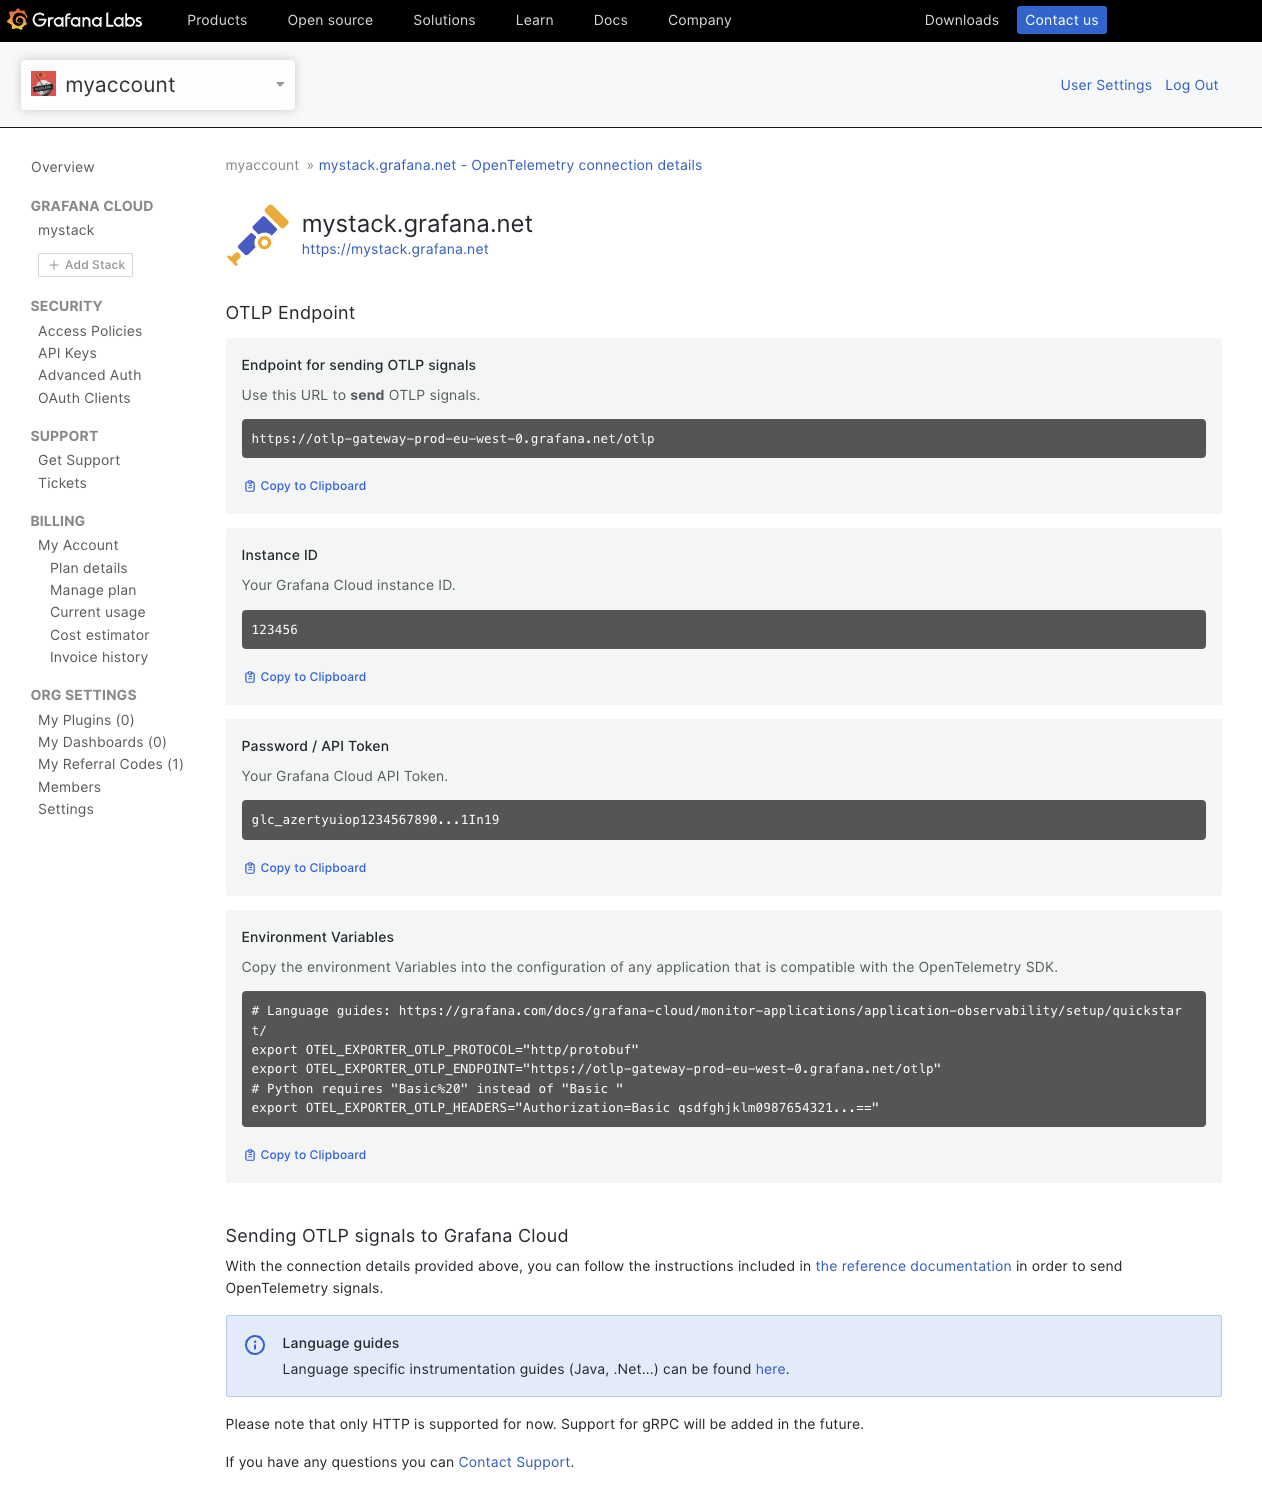 Configure the OTLP endpoint for a Grafana Cloud stack.
Note
If you use Python, replace “Basic " in your connection variables shell script with “Basic%20”.
Set up instructions are available for:
- Grafana Beyla an eBPF instrumentation solution that is easy to set up and automatically instruments network-level telemetry for all languages and frameworks.
- Language specific OpenTelemetry agents and SDKs for JVM-based languages, .NET, Node.js, Python, PHP, and Go
- Grafana Alloy distribution of the OpenTelemetry Collector
- Grafana Kubernetes monitoring Helm chart based on Grafana Alloy
- The upstream OpenTelemetry Collector and the OpenTelemetry Operator for Kubernetes, published by the OpenTelemetry community
OpenTelemetry environment variables
The OpenTelemetry instrumentation SDKs and agents use specific environment variables to send application data to Grafana Cloud.
Customize the following shell script template to set environment variables:
export OTEL_SERVICE_NAME=<< SERVICE >>
export OTEL_RESOURCE_ATTRIBUTES=deployment.environment=<< ENVIRONMENT >>,service.namespace=<< NAMESPACE >>,service.version=<< VERSION >>,service.instance.id=<< ID >>
Add each value after the equals replacing the placeholder << ... >> and remove any optional fields you don’t use.
The OTEL_RESOURCE_ATTRIBUTES contains a comma separated list of field value pairs.
The OTEL_SERVICE_NAME is a required unique service identifier.
A default value is often auto-discovered by the instrumentation.
For example, ads or cart.
You can optionally set the service name as a resource attribute, see below.
Visualize and use OpenTelemetry data
Grafana Cloud provides a turnkey experience for application performance monitoring (APM) through Grafana Application Observability. It can detect anomalies, identify root causes, and fix problems in applications.
Alternatively, you can consume your OpenTelemetry traces, metrics, and logs through Tempo traces, Prometheus/Mimir metrics, and Loki logs visualization. Then use your ingested OpenTelemetry data with your preferred Grafana Labs tooling.
OpenTelemetry data format mapping to Grafana Cloud
Refer to the OTLP format considerations documentation for information on how OpenTelemetry metrics, logs, and traces are converted to Prometheus/Mimir, Loki, and Tempo.


