
Monitor multiple Linux hosts with the grafana_agent role
Caution
Grafana Alloy is the new name for our distribution of the OTel collector. Grafana Agent has been deprecated and is in Long-Term Support (LTS) through October 31, 2025. Grafana Agent will reach an End-of-Life (EOL) on November 1, 2025. Read more about why we recommend migrating to Grafana Alloy.
Monitoring multiple Linux hosts can be difficult.
To make it easier, you can use the grafana_agent role with the Grafana Ansible collection.
This guide shows how to use the grafana_agent Ansible role to deploy and manage Grafana Agent across multiple Linux hosts so you can monitor them using Grafana Cloud.
Before you begin
Before you begin, you should have:
- Linux hosts
- SSH access to the Linux hosts
- Account permissions sufficient to install and use Grafana Agent on the Linux hosts
Install the Grafana Ansible collection
The grafana_agent role is available in the Grafana Ansible collection as of the 1.1.0 release.
To install the Grafana Ansible collection, run this command:
ansible-galaxy collection install grafana.grafanaCreate an Ansible inventory file
Next, you will set up your hosts and create an inventory file.
Create your hosts and add public SSH keys to them.
This example uses eight Linux hosts: two Ubuntu hosts, two CentOS hosts, two Fedora hosts, and two Debian hosts.
Create an Ansible inventory file.
The Ansible inventory, which resides in a file named
inventory, looks similar to this:146.190.208.216 # hostname = ubuntu-01 146.190.208.190 # hostname = ubuntu-02 137.184.155.128 # hostname = centos-01 146.190.216.129 # hostname = centos-02 198.199.82.174 # hostname = debian-01 198.199.77.93 # hostname = debian-02 143.198.182.156 # hostname = fedora-01 143.244.174.246 # hostname = fedora-02Create an
ansible.cfgfile within the same directory asinventory, with the following values:[defaults] inventory = inventory # Path to the inventory file private_key_file = ~/.ssh/id_rsa # Path to my private SSH Key remote_user=root # usernameNote
If you are copying the previously listed files, remove the comments (#).
Use the grafana_agent Ansible role
Next you will create an Ansible playbook that calls the grafana_agent role from the grafana.grafana Ansible collection.
To use the grafana_agent Ansible role:
Create a file named
deploy-agent.ymlin the same directory asansible.cfgandinventoryand add the configuration below.The playbook calls the
grafana_agentrole from thegrafana.grafanaAnsible collection.The Agent configuration in this playbook send metrics and logs from the Linux hosts to Grafana Cloud along with the hostname of each instance
Refer to the Grafana Ansible documentation to understand the other variables you can pass to the
grafana_agentrole.When deploying the Agent across multiple instances for monitoring them, It is essential that the Agent is able to auto-detect the hostname for ease in monitoring. Notice that the label
instancehas been set to the value${HOSTNAME:-default}, which is substituted by the value of the HOSTNAME environment variable in the Linux host.To read more about the variable substitution, refer to the Grafana Agent node_exporter_config documentation.
To run the playbook, run this command:
ansible-playbook deploy-agent.yml
Note
You can place the
deploy-agent.yml,ansible.cfgandinventoryfiles in different directories based on your needs.
Check that logs and metrics are being ingested into Grafana Cloud
Logs and metrics will soon be available in Grafana Cloud. To test this, use the Explore feature. Click the Explore icon (compass icon) in the vertical navigation bar.
Check logs
To check logs:
Use the drop-down menu at the top of the page to select your Loki logs data source.
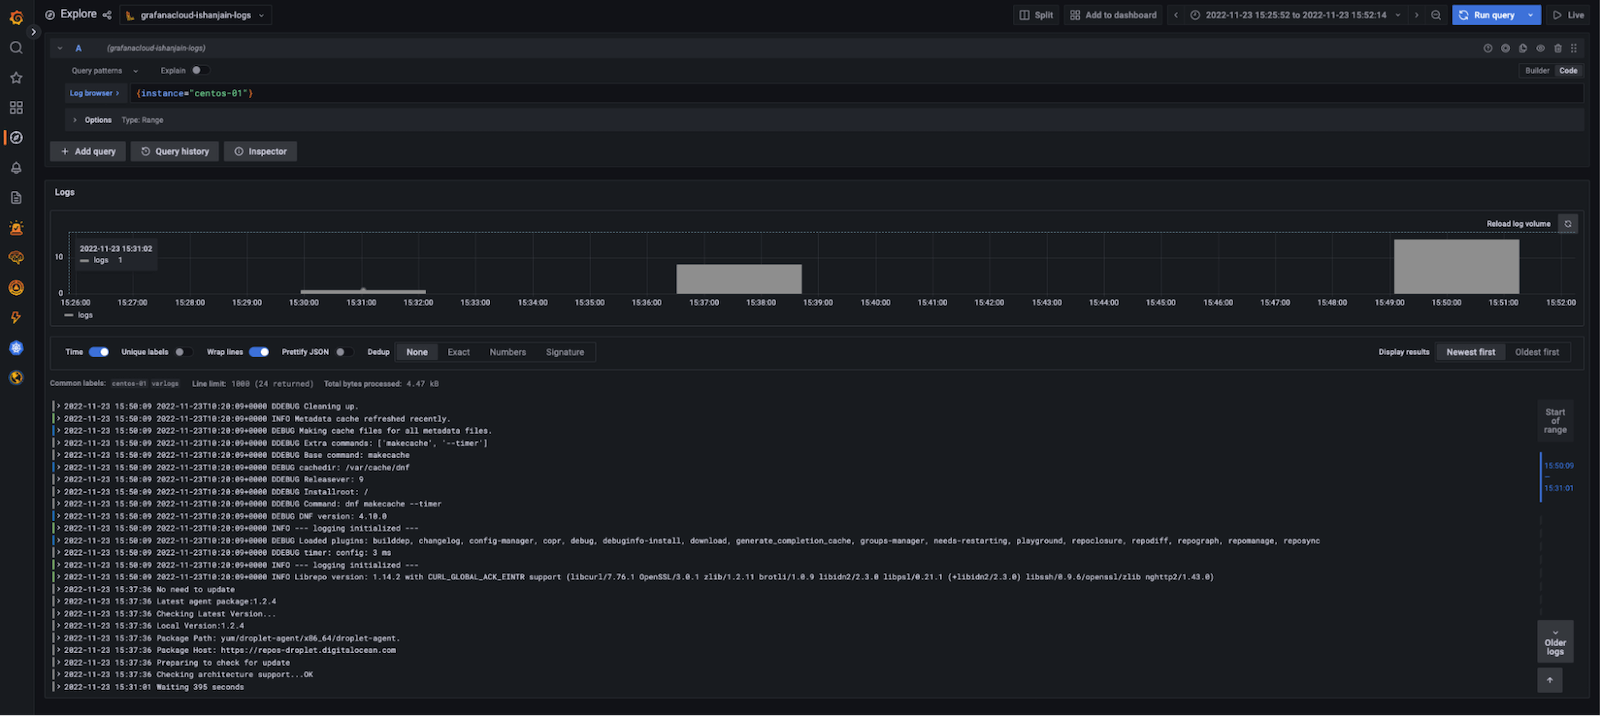
In the log browser, run the query
{instance="centos-01"}wherecentos-01is the hostname of one of the Linux hosts.If you see log lines (shown in the example below), logs are being received.
![Grafana Explore showing a graph and log output from the preceding query]()
If no log lines appear, logs aren’t being collected.
Check metrics
To check metrics:
Use the drop-down menu at the top of the page to select your Prometheus data source.
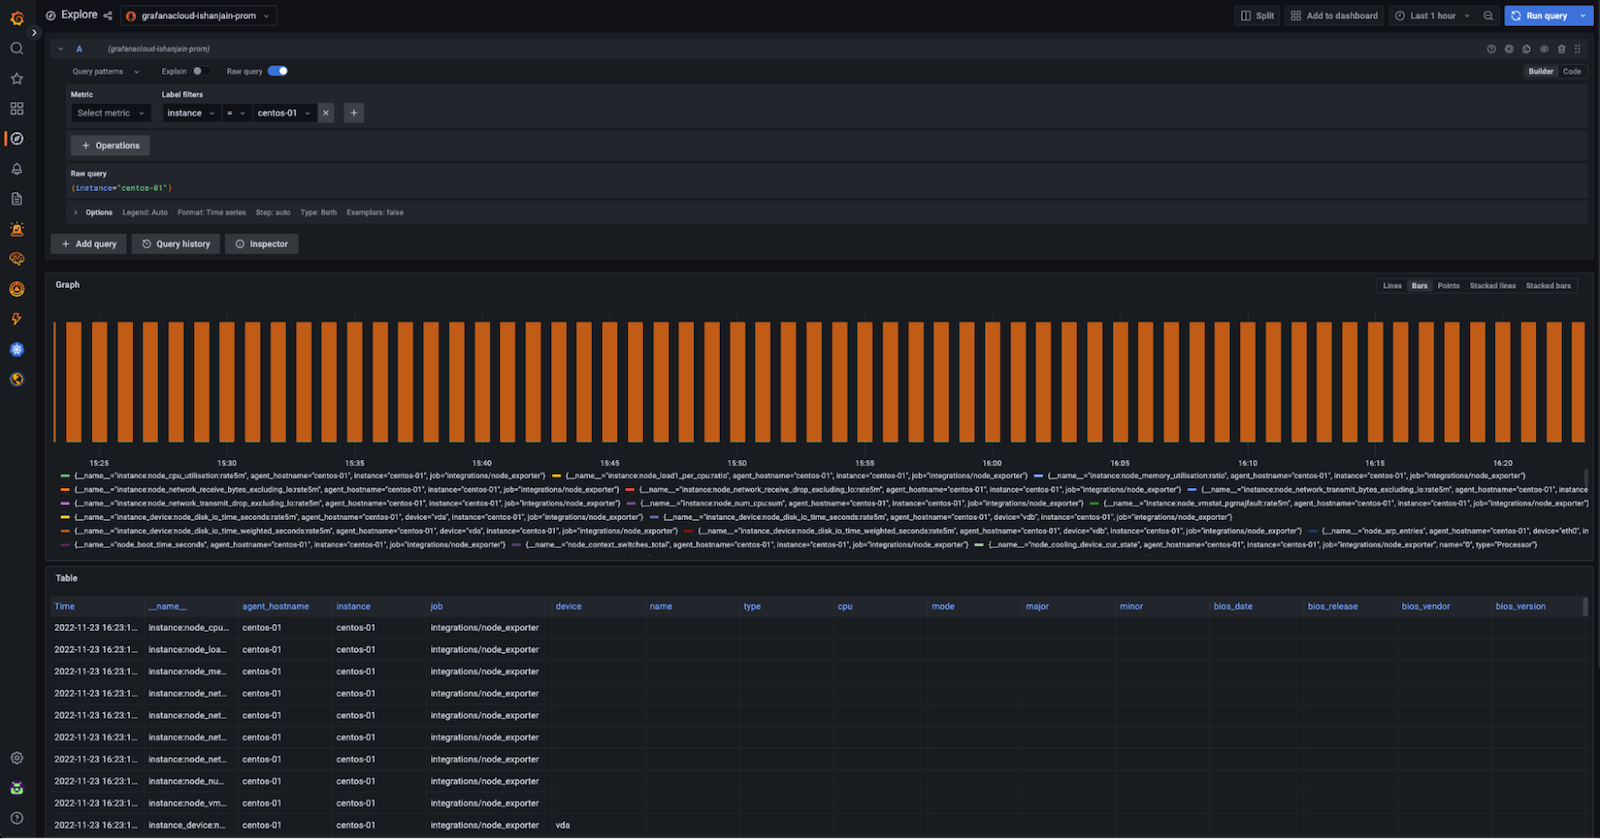
Run the query
{instance="centos-01"}wherecentos-01is the hostname of one of the Linux hosts.If you see a metrics graph and table (shown in the example below), metrics are being received.
![Grafana Explore showing a graph and metrics table output from the preceding query]()
If no metrics appear, metrics aren’t being collected.
View dashboards
Now that you have logs and metrics in Grafana, you can use dashboards to view them. Here’s an example of one of the prebuilt dashboards included with the Linux integration in Grafana Cloud:
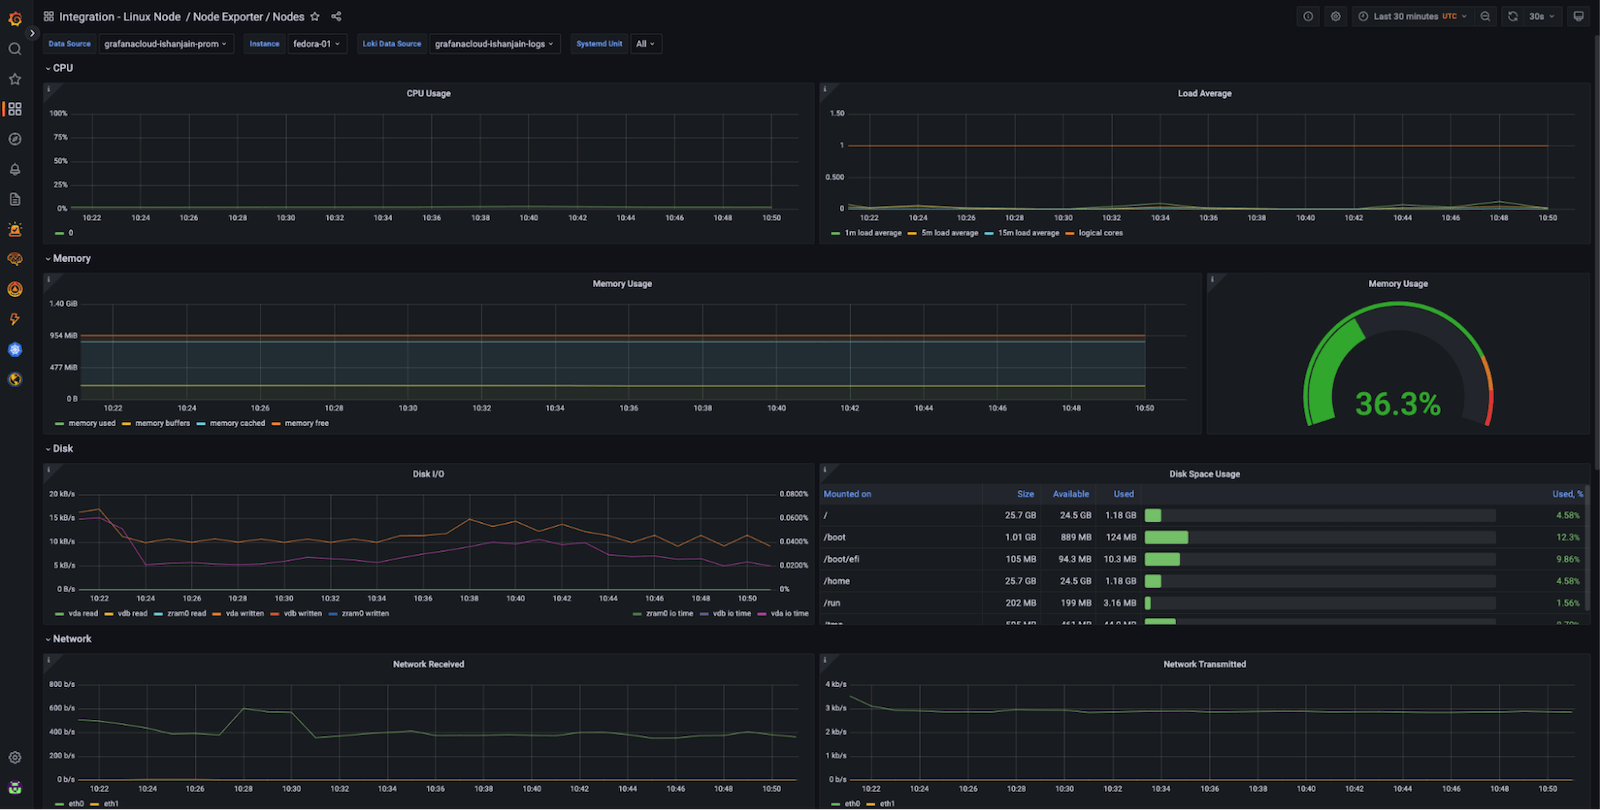
Using the Instance drop-down in the dashboard, you can select from the hostnames where you deployed Grafana Agent and start monitoring them.
Summary
The grafana_agent Ansible role makes it easy to deploy and manage Grafana Agent across multiple machines.
This example showed Grafana Agent deployments across eight Linux hosts, but it’s possible to monitor more hosts using thegrafana_agent role.
To add monitor more Linux hosts, update the inventory file and re-run the Ansible playbook.
To learn more about the Grafana Ansible collection, see its GitHub repository or its documentation.
Was this page helpful?
Related resources from Grafana Labs


