
Template annotations and labels
You can use templates to customize alert and notification messages, including dynamic data from alert rule queries.
In Grafana Alerting, you can template alert messages in two ways.
- Template annotations and labels: In the alert rule definition, you can template annotations and labels to include extra information from query data to the alert, adding meaningful details based on the query results.
- Template notifications: You can template notifications to control the content and appearance of your notifications.
How templating works
In this diagram, you can see the differences between both types of templates.
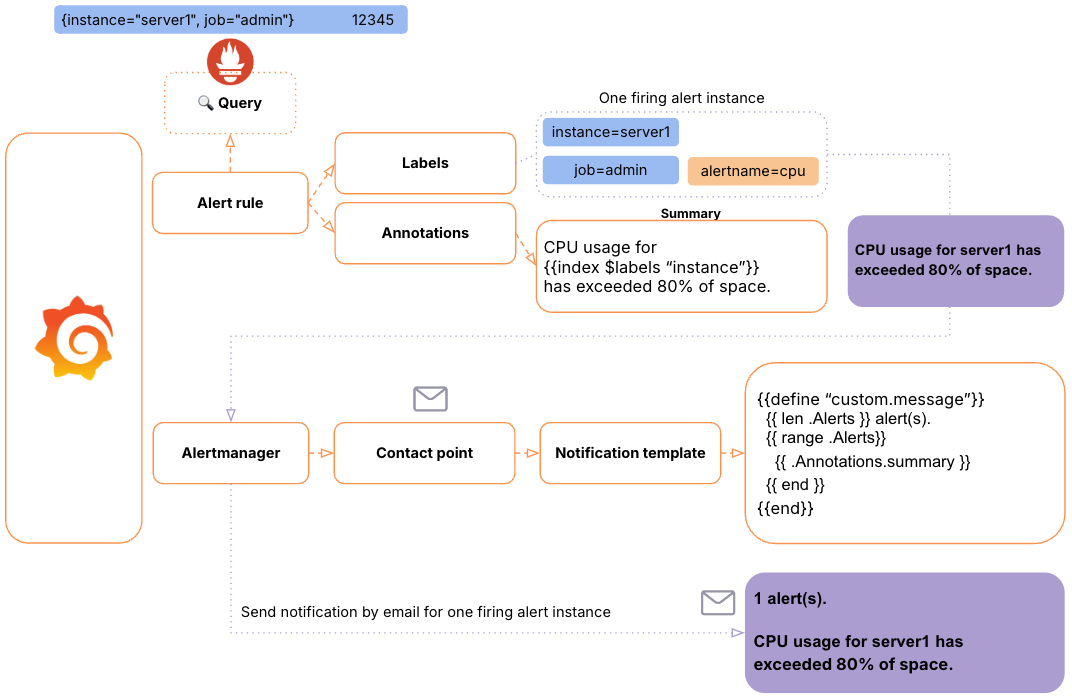
Refer to Templates Introduction for a more detailed explanation of this diagram.
Both types of templates are written in the Go templating system. However, it’s important to understand that variables and functions used in notification templates are different from those used in annotation and label templates.
- Template annotations and labels: These templates add extra information to individual alert instances. Template variables like
$labelsand$valuesrepresent alert query data of the individual alert instance. - Template notifications: Notification templates format the notification content for a group of alerts. Variables like
.Alertsinclude all firing and resolved alerts in the notification.
Template annotations
Annotations add additional information to alert instances and are often used to help identify the alert and guide responders on how to address the issue.
Annotations are key-value pairs defined in the alert rule. They can contain plain text or template code that is evaluated when the alert fires.
Grafana includes several optional annotations, such as description, summary, and runbook_url, which can be edited in the alert rule. You can also create your custom annotations. For example, you might create a new annotation named location to report the location of the system that triggered the alert.
Here’s an example of a summary annotation explaining why the alert was triggered, using plain text.
CPU usage has exceeded 80% for the last 5 minutes.However, if you want to display dynamic query values in annotations, you need to use template code. Common use cases include:
- Displaying the query value that triggered the alert.
- Highlighting label information that identifies the alert, such as the environment, instance, or region.
- Providing specific instructions based on query values.
- Customizing runbook links depending on query labels.
- Including contact information based on query labels.
For instance, you can template the previous example to display the specific instance and CPU value that triggered the alert.
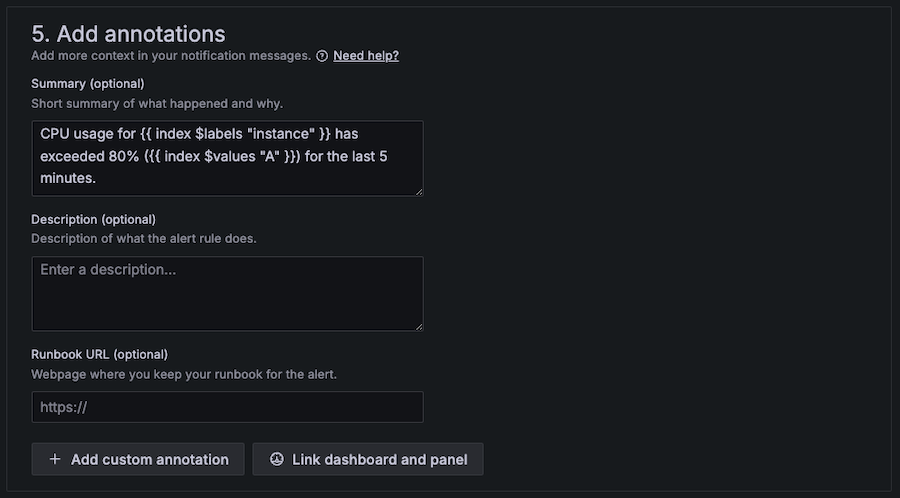
CPU usage for {{ $labels.instance }} has exceeded 80% ({{ $values.A.Value }}) for the last 5 minutes.Alternatively, you can use the index function to print query values.
CPU usage for {{ index $labels "instance" }} has exceeded 80% ({{ index $values "A" }}) for the last 5 minutes.The result of the annotation would be as follows.
CPU usage for Instance 1 has exceeded 80% (81.2345) for the last 5 minutes.How to template an annotation
Complete the following steps to template an annotation.
- Navigate to Alerts & IRM -> Alert rules -> create or edit an alert rule.
- Scroll down to the Configure notification message section.
- Copy in your template in the corresponding annotation field (
summary,description,runbook_url,custom).
Preview annotation templates
You can template annotations when creating or editing an alert rule.
Two common methods are used to test and preview annotation templates:
- Trigger the alert and view the alert instance state in the Grafana UI, where all annotations of the alert instance are displayed.
- Use a notification template that displays all annotations, then preview the notification template using the alert instance.
Template labels
The set of labels for an alert instance is used to uniquely identify that alert among all other alert instances.
Labels determine how alerts are routed and managed for notifications, making their design key to the effectiveness of your alerting system.
Labels can be returned from an alert rule query, such as the pod label in a Kubernetes Prometheus query. You can also define additional labels in the alert rule to provide extra information for processing alerts.
Like annotations, labels are key-value pairs that can contain plain text or template code evaluated when the alert fires.
Template labels when the labels returned by your queries are insufficient. For instance:
- A new label based on a query value can group a subset of alerts differently, changing how notifications are sent.
- A new label based on a query value can be used in a notification policy to alter the notification contact point.
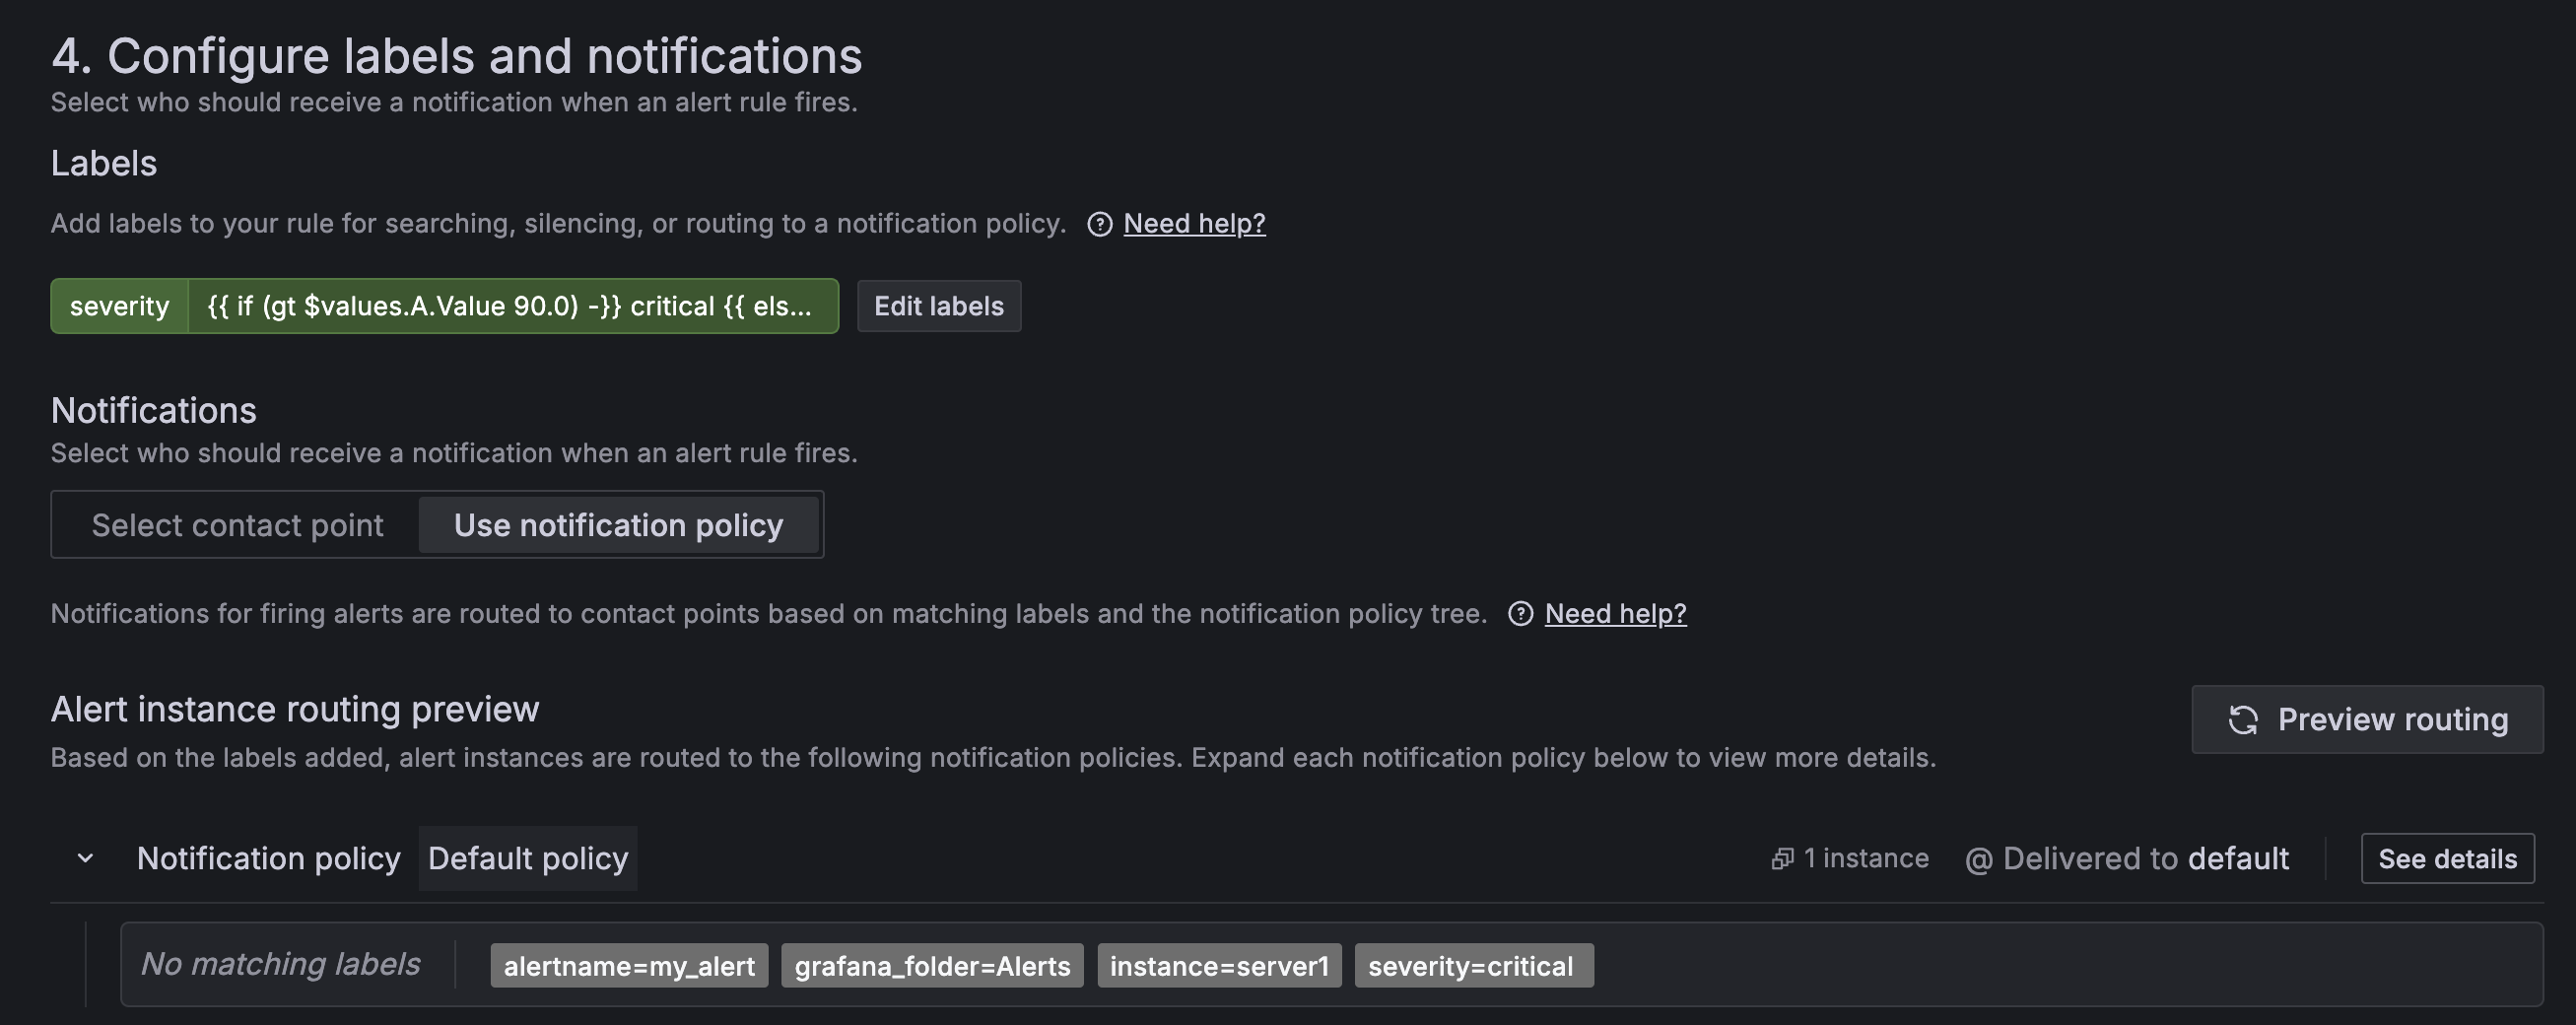
Here’s an example of templating a severity label based on the query value.
{{ if (gt $values.A.Value 90.0) -}}
critical
{{ else if (gt $values.A.Value 80.0) -}}
high
{{ else if (gt $values.A.Value 60.0) -}}
medium
{{ else -}}
low
{{- end }}
In this example, the value of the severity label is determined by the query value, and the possible options are critical, high, medium, or low. You can then use the severity label to change their notifications—for instance, sending critical alerts immediately or routing low alerts to a specific team for further review.
Note: An alert instance is uniquely identified by its set of labels.
- Avoid displaying query values in labels, as this can create numerous alert instances—one for each distinct label set. Instead, use annotations for query values.
- If a templated label’s value changes, it maps to a different alert instance, and the previous instance is considered stale. Learn all the details in this example using dynamic labels.
How to template a label
Complete the following steps to template a label.
- Navigate to Alerts & IRM -> Alert rules -> create or edit an alert rule.
- Scroll down to the Configure labels and notifications section.
- Click + Add labels.
- Enter a key that identifies the label.
- Copy in your template in the value field.
Preview label templates
You can template label values when creating or editing an alert rule.
To preview label values, select Use notification policy, and then click on Preview routing.
More information
For further details on how to template alert rules, refer to:
Tip
For a practical example of templating, refer to our Getting Started with Templating tutorial.
Was this page helpful?
Related resources from Grafana Labs


