
What's new from Grafana Labs
Grafana Labs products, projects, and features can go through multiple release stages before becoming generally available. These stages in the release life cycle can present varying degrees of stability and support. For more information, refer to release life cycle for Grafana Labs.
Loading...
Area of interest:
Cloud availability:
Cloud editions:
Self-managed availability:
Self-managed editions:
No results found. Please adjust your filters or search criteria.
There was an error with your request.
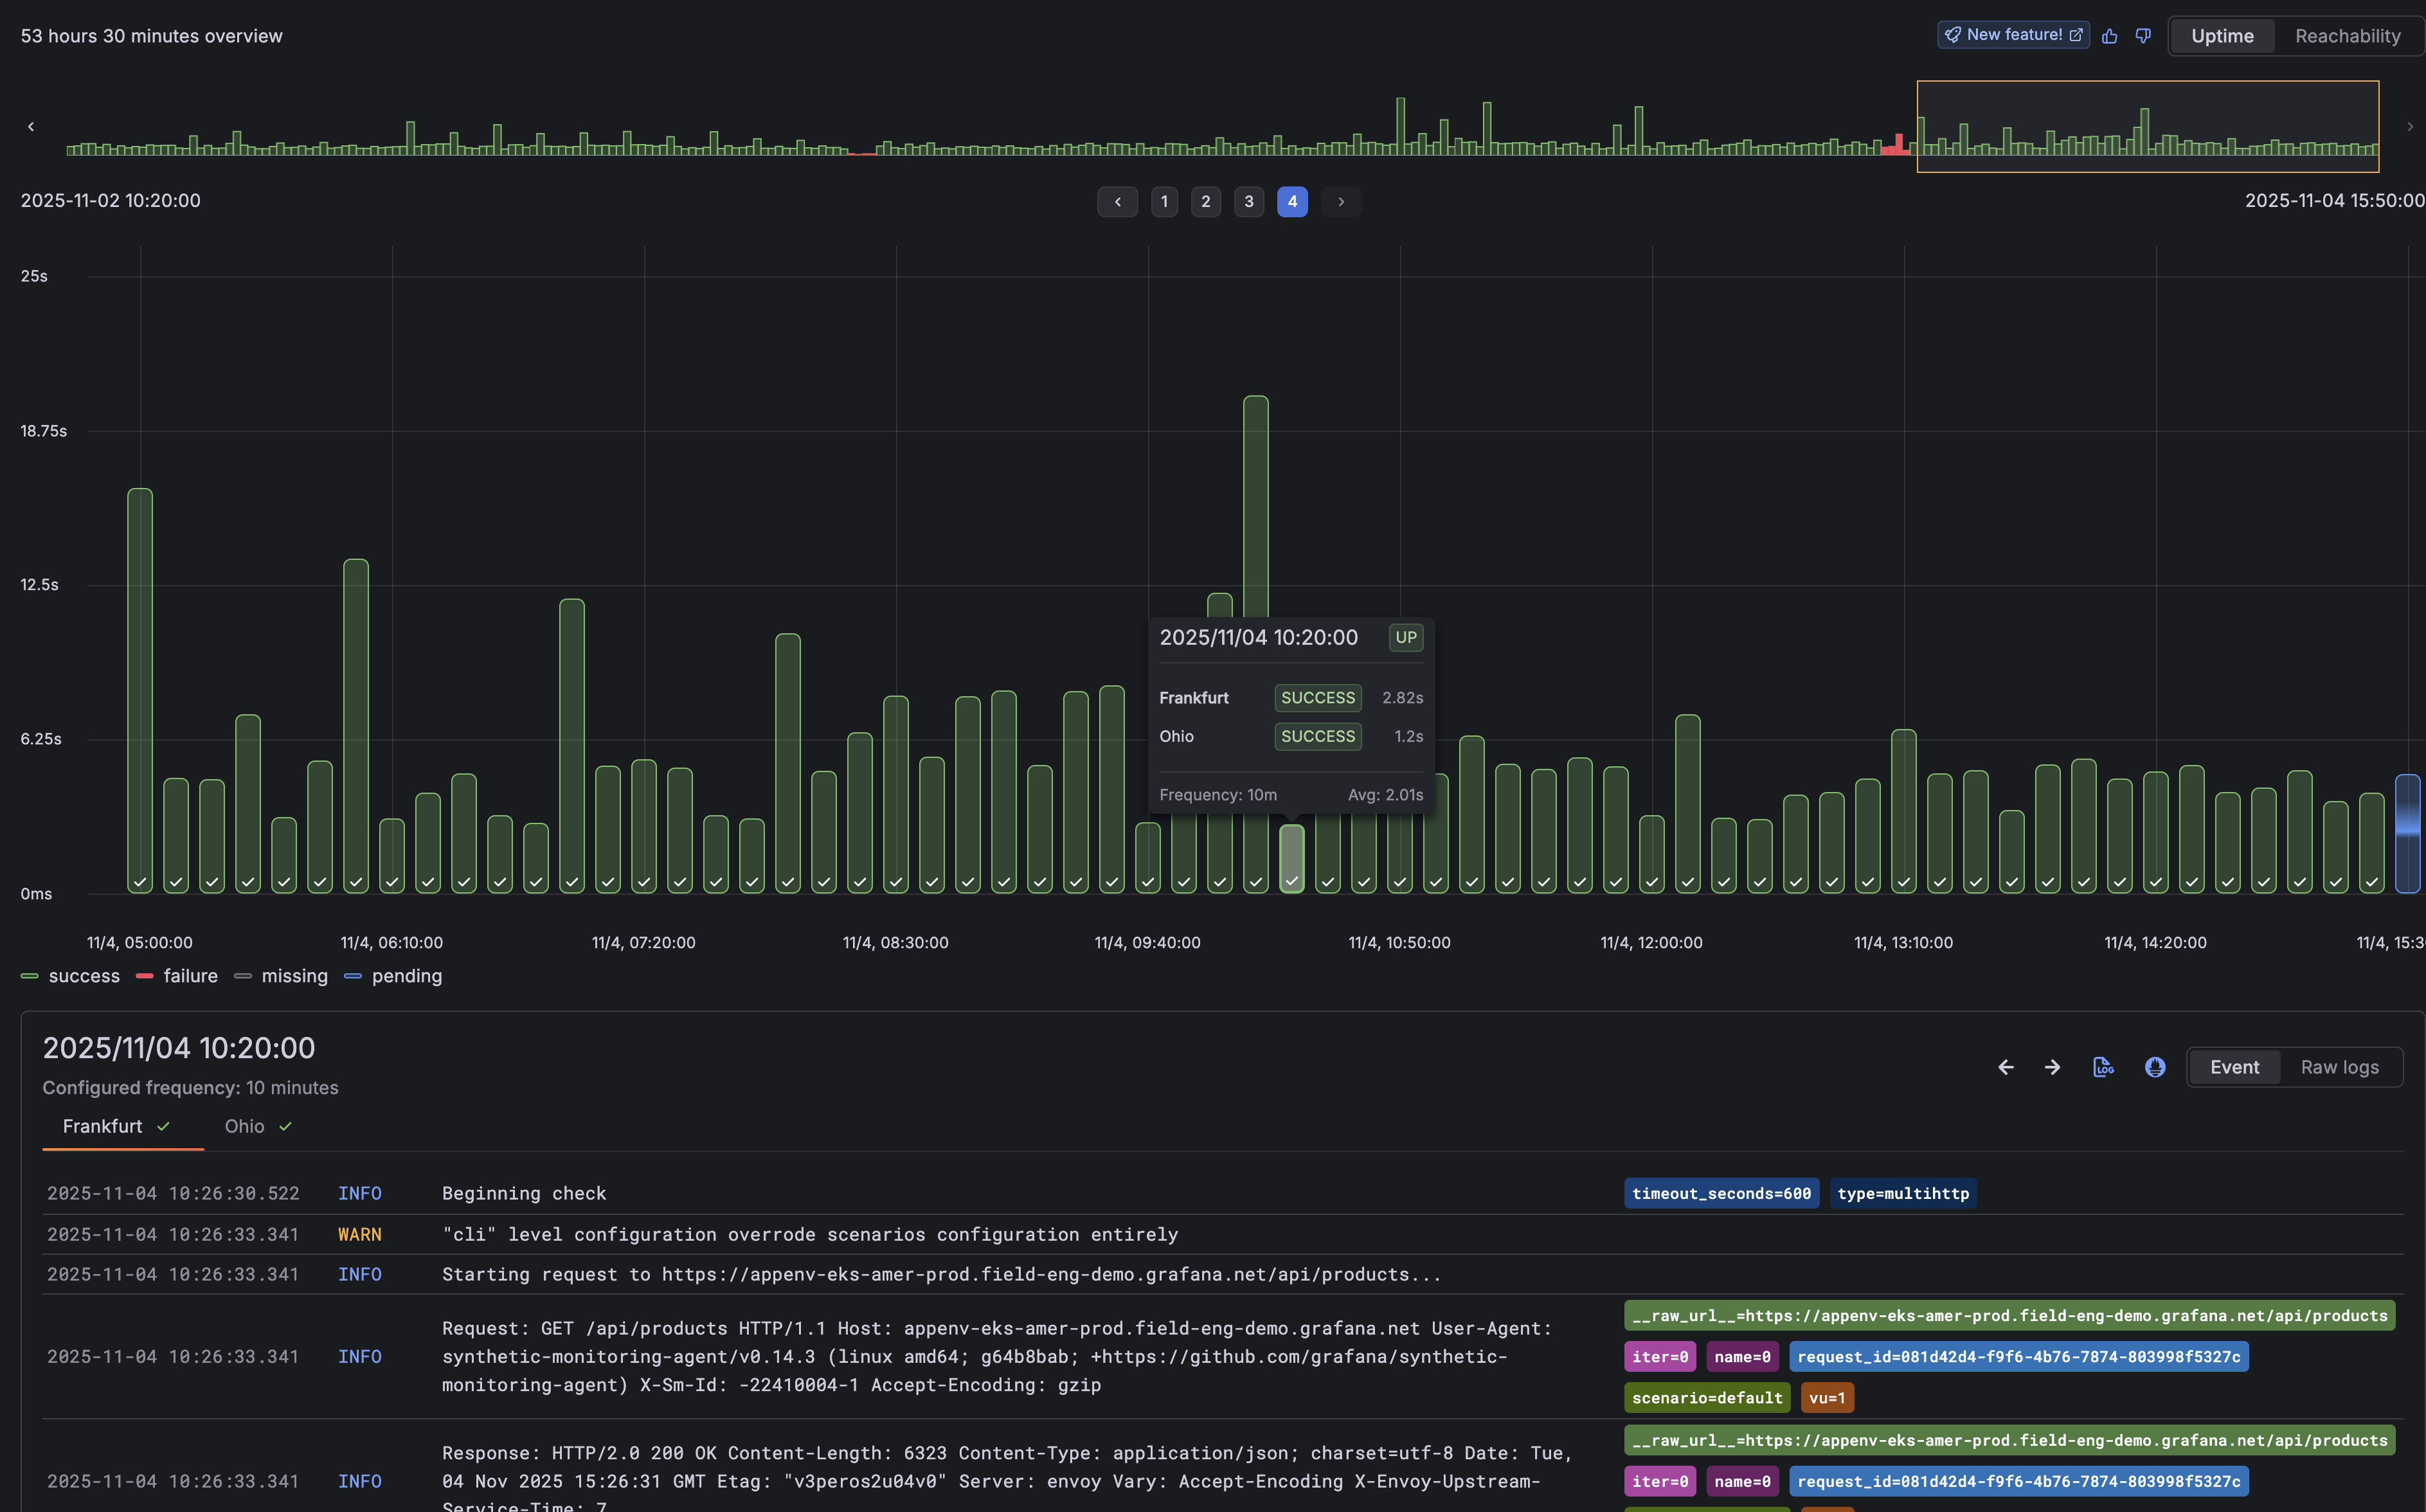
We’ve enhanced the check results page with a new Timepoint Explorer, making it easier to understand exactly when and where issues are occuring.
Timepoint Explorer visualizes every check execution as an individual event, turning results into a timeline you can explore. Each timepoint represents a probe execution, allowing you to pinpoint when failures happened and easily view the logs tied to those executions.
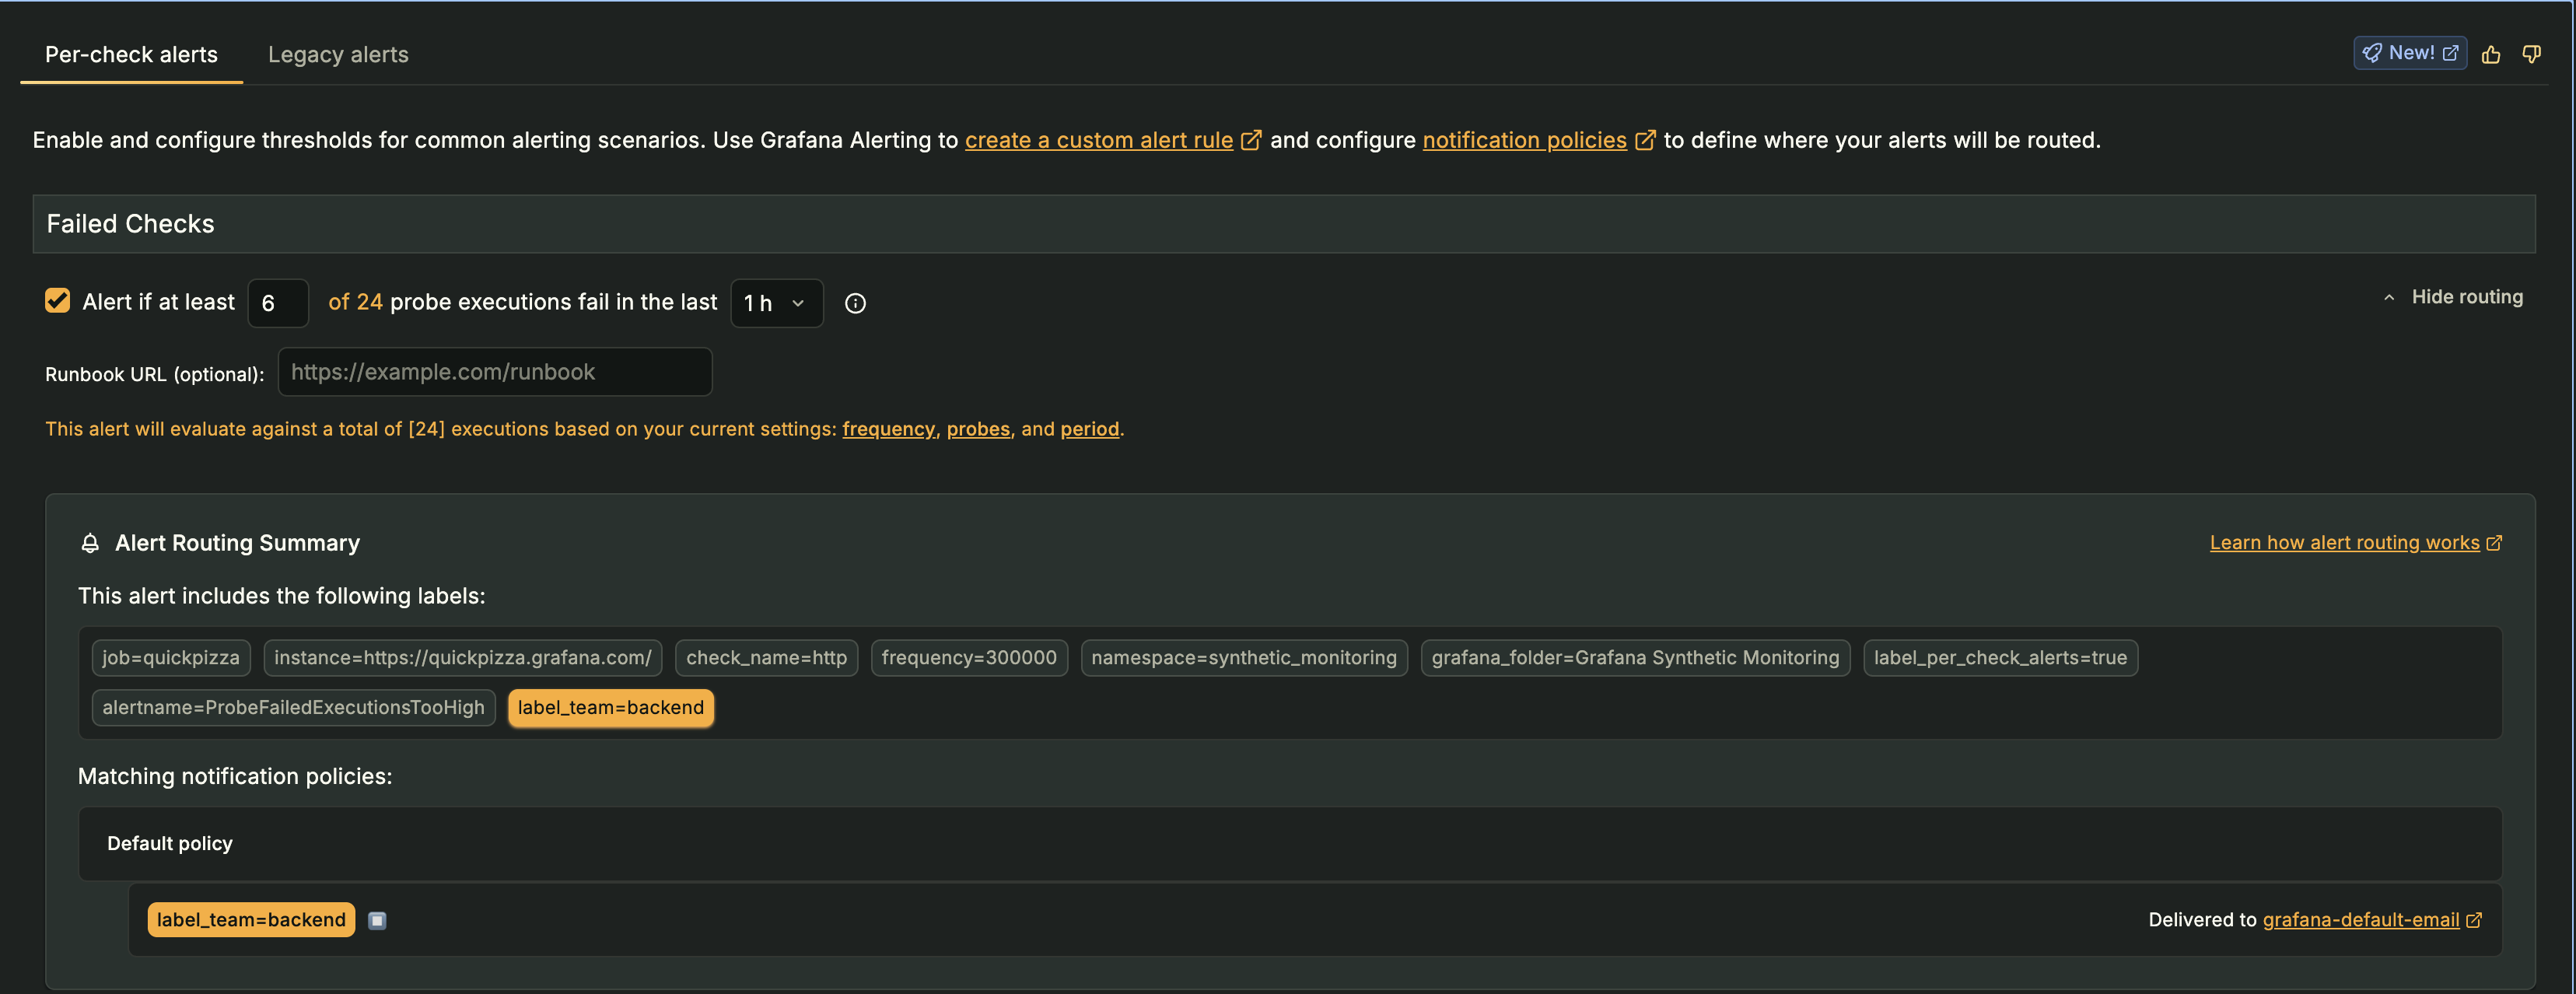
Understanding where your alerts are routed just got a whole lot easier.
When configuring per-check alerts in Grafana Cloud Synthetic Monitoring, you can now see exactly which notification policies your alerts match, right from the UI.
Writing PPL queries in the Grafana OpenSearch plugin just got easier with syntax highlighting, suggestions and sample queries.
The PPL query editor now contains a multi-line box which supports syntax highlighting, PPL keywords and commands suggestions, and index fields. To see the new features in action, select PPL in the Query type dropdown of the query editor and start typing. Specify index name(s) in the datasource configuration to narrow down the list of suggested index fields.
We have also added a “Kickstart your query” button to the PPL query editor, which contains useful sample queries. Select a query to copy it to the query editor and edit it further.
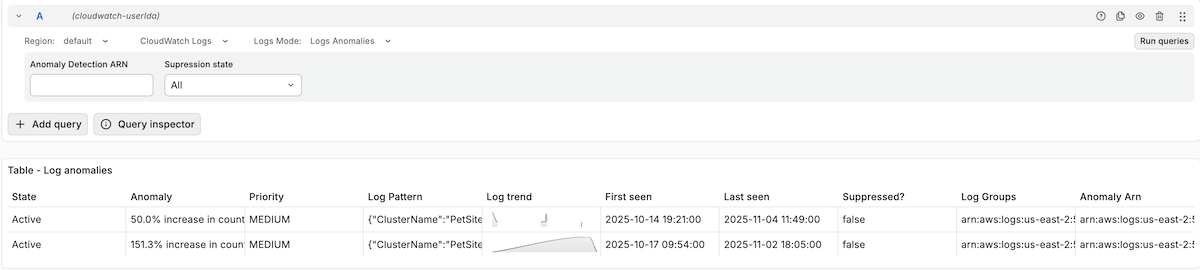
With log anomalies and patterns features, you can now detect abnormalities in your service and group log entries with recurring patterns with the CloudWatch data source.
Log Anomalies
The Grafana Incident Response and Management (IRM) Slack app is now officially approved and available in the Slack App Marketplace.
You can use Grafana Assistant in Kubernetes Monitoring to:
- Explain the data you see in a panel or on a detail page
- Start an investigation for potential issues
- Review the health of Kubernetes objects and resource consumption
- Provide recommendations
- Launch an investigation
- Follow any additional queries or commands you give it
To use the Assistant, click any Assistant icon available on a panel.

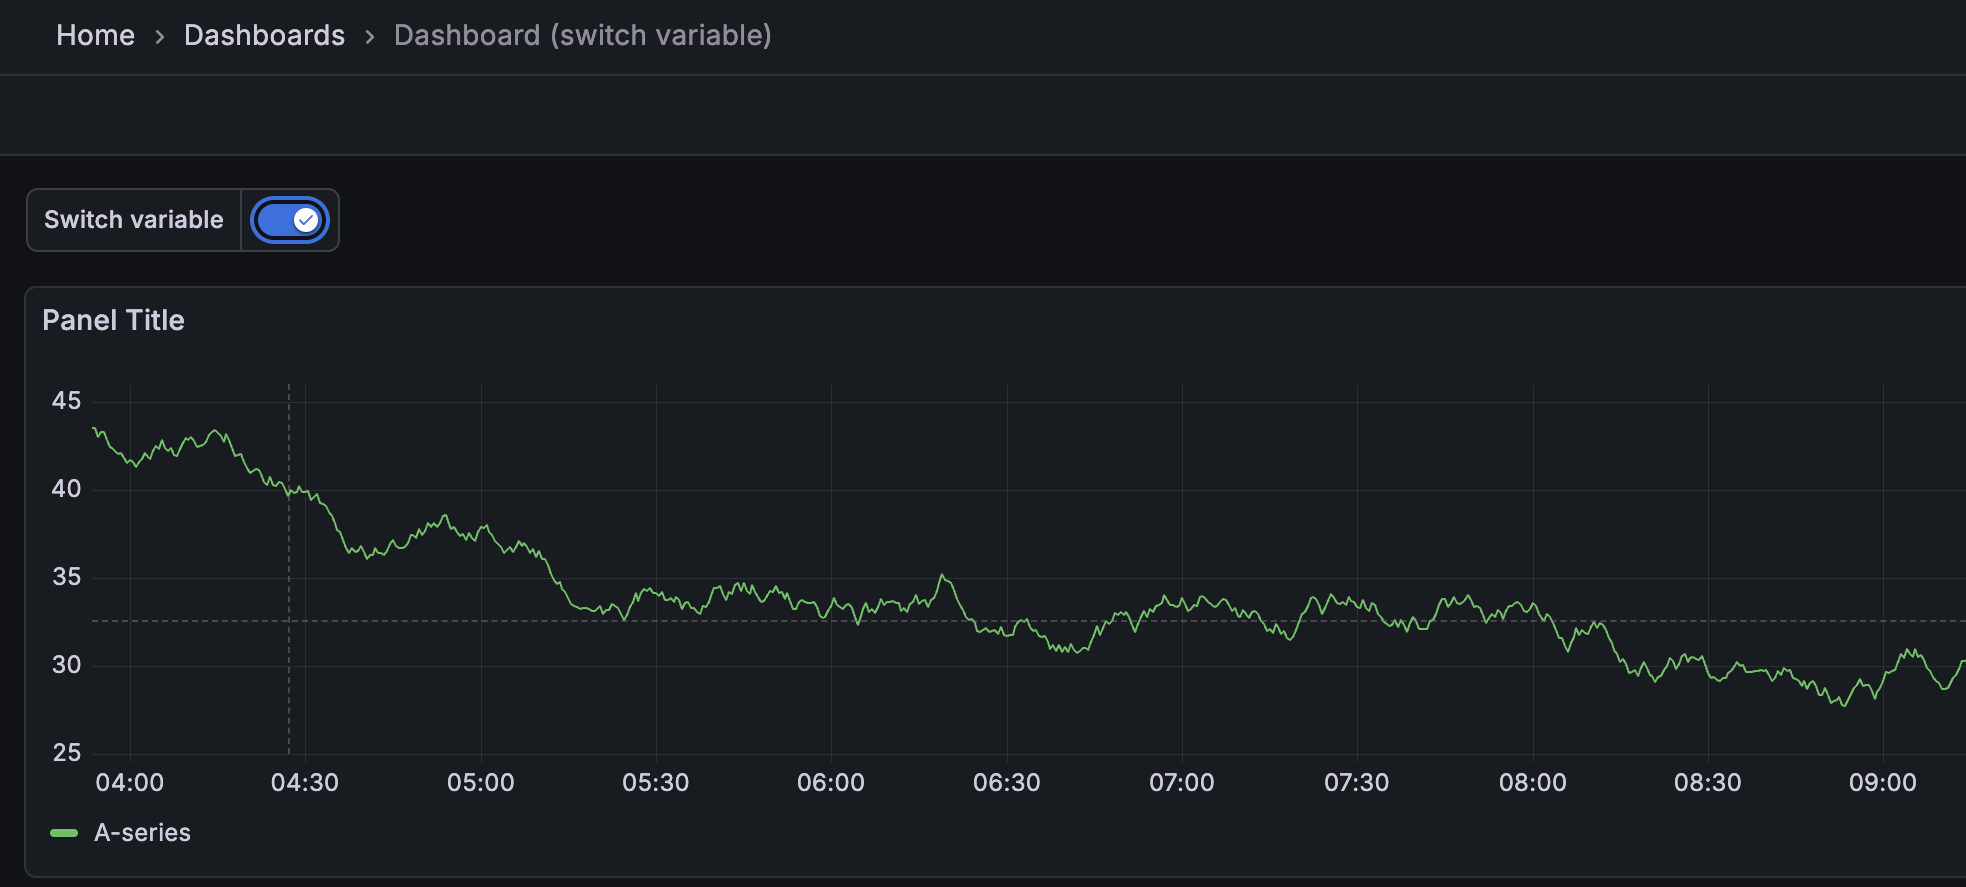
The new Switch template variable type replaces cumbersome drop-down menus with an intuitive toggle interface. Configure any two values—true/false, 1/0, yes/no, or custom pairs—and control boolean states across your dashboard with a single click. Perfect for toggling debug modes, filters, or any conditional logic.
We are thrilled to announce that Native Histograms are now generally available (GA)!
This milestone comes after three years of dedicated development, bringing a powerful data type to Prometheus users.
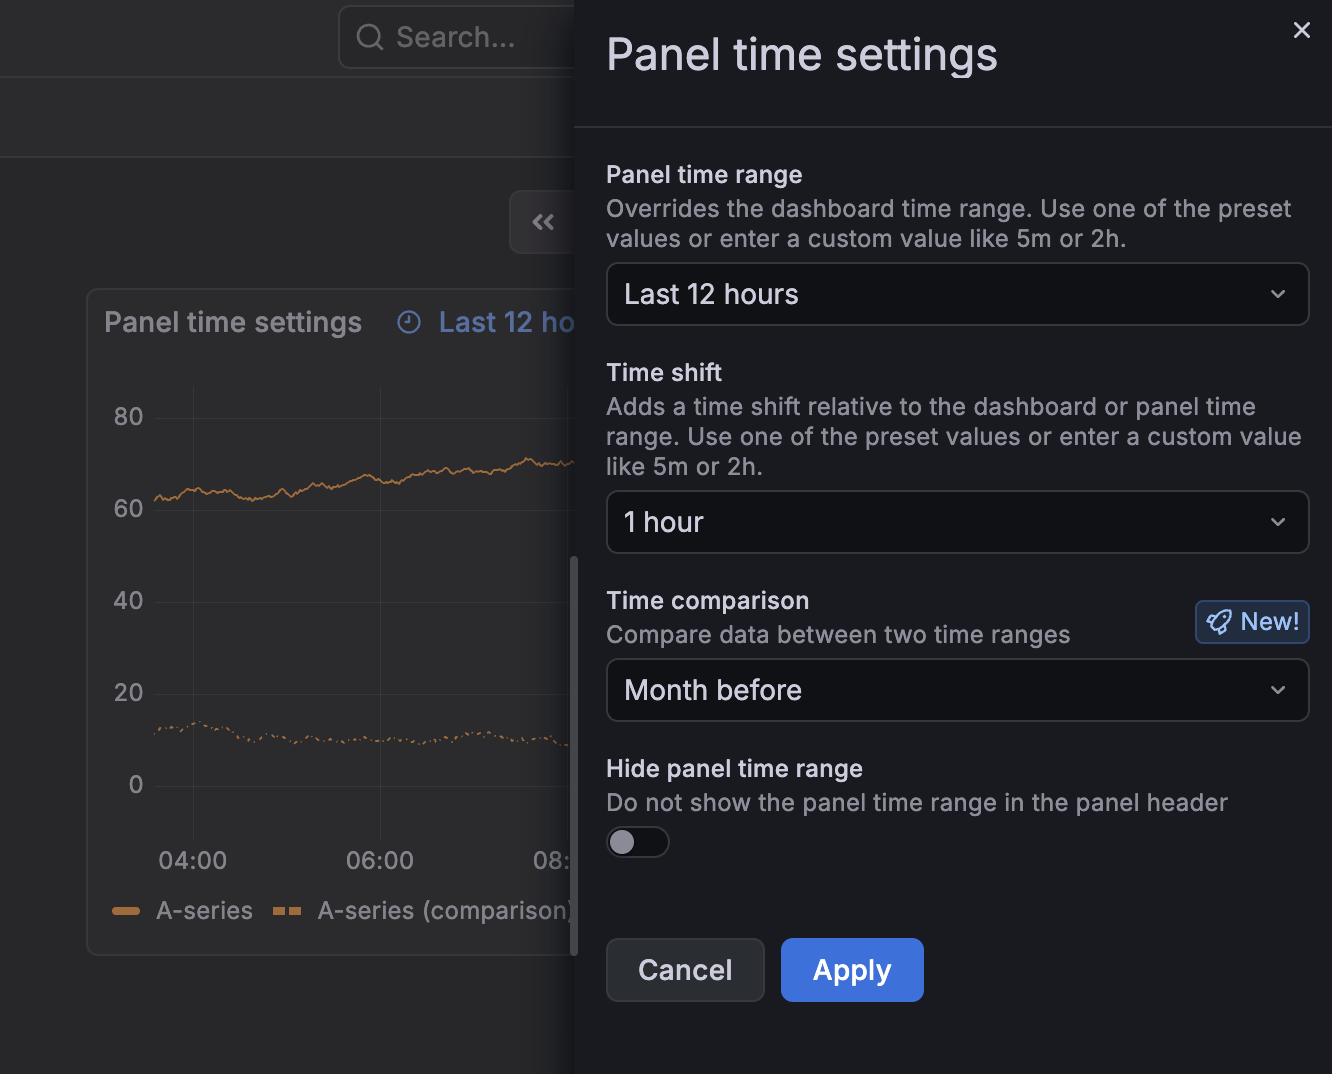
We’re excited to announce the addition of the Panel time settings drawer in visualizations. With this feature, you can access key panel-specific time settings without editing the dashboard:
We are very excited to release a completely redesigned logs visualization!
The logs visualization is one of the core visualizations of Grafana, and we’ve rebuilt it from the ground up to not only address performance issues, but also add many new features and display options to innovate in the space and provide the best possible log browsing experience, such as:
As part of the recently redesigned logs visualization, we’re now adding a new component to interact with fields in log lines, making it easier than ever to toggle fields on and off and customize the display order.
GCP Private Service Connect (PSC) provides private connectivity between private networks and supported GCP services without exposing your traffic to the public internet.
With GCP PSC for Grafana Private DataSource Connect (PDC), you can connect your PDC agents running in your GCP private network to Grafana Cloud while staying on the GCP network.
Save money and apply an extra layer of network security by using GCP Private Service Connect to send telemetry data to Grafana Cloud.
Normally when you send telemetry from your GCP network to Grafana Cloud, you incur in network egress fees and your data, though encrypted, traverses the public internet.
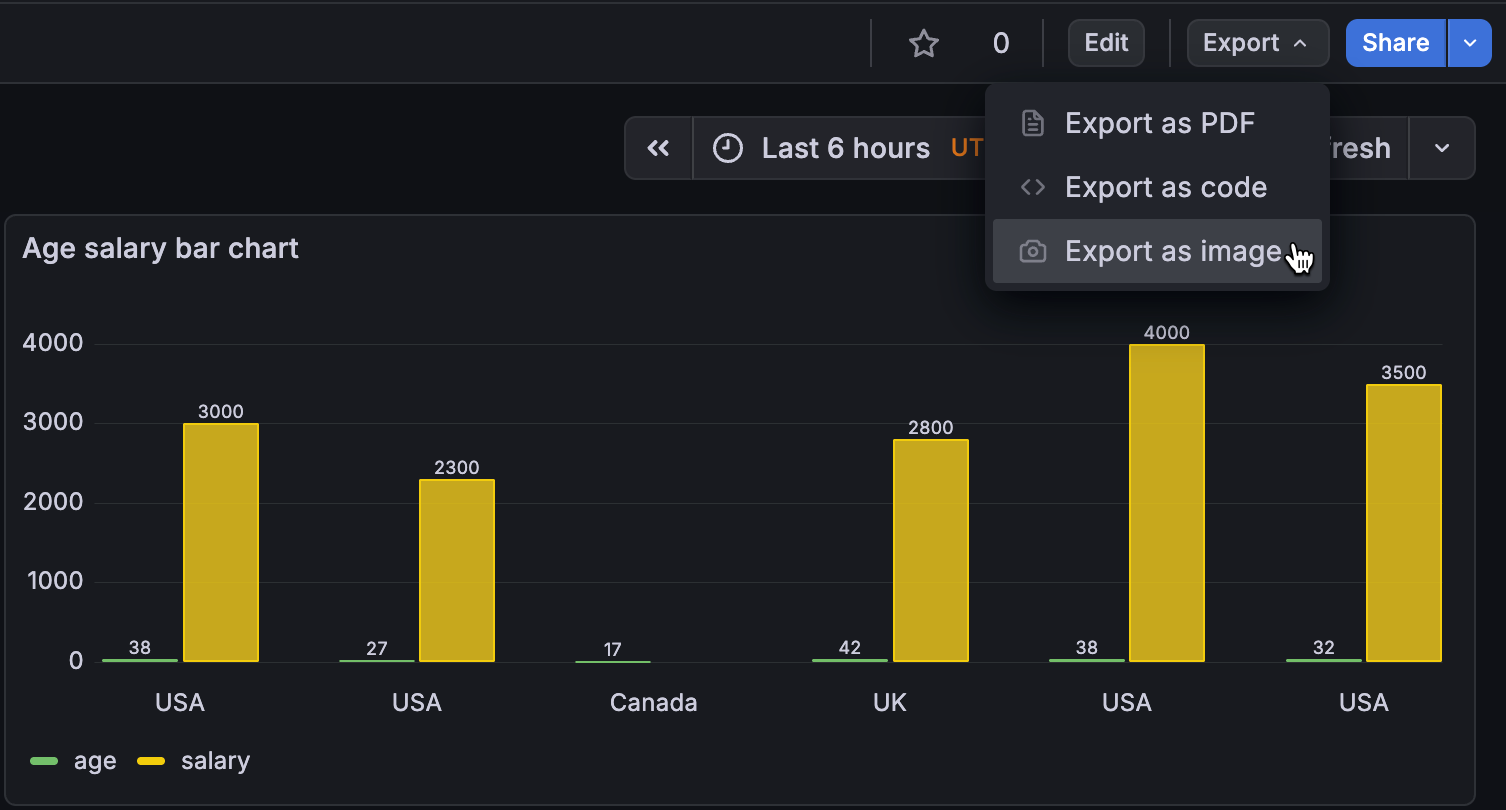
Sharing your Grafana dashboards just got easier. You can now export any dashboard as a PNG image.
Use the Export as image option to generate an image:
Grafana Team LBAC: Performance Considerations
What We’ve Improved
Storage Capacity
We previously had a limitation of about 500 LBAC rules per data source, which was challenging for some customers who needed more rules to meet their requirements. We’ve resolved this by expanding our storage capacity, allowing for significantly more rules to be stored.