Get Cloud Insights
Whenever you run a Grafana Cloud k6 test, Cloud Insights automatically analyzes telemetry data, such as metrics, logs, and traces, to identify potential issues in your system under test (SUT) or your k6 test script. Cloud Insights also analyzes Grafana Cloud k6 systems to make sure they didn’t have a negative impact on your test run.
Following each test run, Cloud Insights presents notifications highlighting any identified issues. These notifications come with recommendations to help you address the problems with your system under test and optimize your k6 scripts for more accurate and insightful results.

Note
Cloud Insights analyzes the test run context and initializes relevant audits for your test. That means sometimes you won’t see some audits at all. For example, if you execute your test using the
k6 cloud run --local-executioncommand, you won’t see the Load Generator CPU Usage audit since the test is being executed on your local machine and it’s not using Grafana Cloud k6 load generators.
How Cloud Insights work
Cloud Insights consists of four components: audits, categories, scores, and trends.
Audits
Audits form the foundation of Cloud Insights. Each audit is an automated and intelligent check that assesses certain parts of your system under test. Audits highlight reliability issues, performance opportunities, best practices, security concerns, and more.
Refer to Cloud Insights reference to learn more about individual audits.
Categories
Categories represent specific aspects of the test that Cloud Insights evaluates and scores. There are three categories, and they provide a comprehensive quality analysis of a particular area, offering insights and actionable improvement recommendations:
- Reliability: Diagnoses issues related to your SUT’s ability to handle the load generated by your k6 test.
- Best Practice: Ensures your scripts and tests adhere to recommended practices for k6 development, leading to more robust and reliable tests.
- System: Uncovers potential problems with the Grafana Cloud k6 load generation infrastructure.
Within each category, audits can also optionally get assigned to a group. Groups give you another level of granularity between a category and an individual audit, providing more context on what’s being asserted.
Refer to Cloud Insights reference to learn more about each category and which audits are part of it.
Scoring
Cloud Insights utilizes a scoring system, helping you quickly identify areas requiring attention and prioritize improvements to achieve the best possible results.
Different score types
There are two types of scores: numeric and binary. Most audits rely on the numeric score, ranging from 0 to 100, putting your audit results on a spectrum where you can seek incremental improvements. The binary score, with a value of pass or fail, is used in audits where a numeric score doesn’t make sense. The Version audit is a great example of this behavior.
How scores are color-coded
The numeric scores are categorized and color-coded as follows:
- Good (green): 90 to 100
- Needs Improvement (orange): 50 to 89
- Poor (red): 0 to 49
The binary scores are categorized and color-coded as follows:
- Pass (green)
- Fail (red)
Note
As a general recommendation, aim for a “good” score within the 90 to 100 range and make sure all binary checks pass.
How the score is weighted
In Cloud Insights, scores are designed to help you quickly identify areas that need attention. Scores are aggregated at different levels: audit, category, and test run.
- Audit Score: This is a raw, non-aggregated score based on individual audits.
- Category and Test Run Scores: These scores are calculated as a weighted average of the individual audit scores. Audits with higher weights have a greater impact on the overall category and test run scores.
Understanding these weighted scores can help you prioritize improvements over time. Refer to the Cloud Insights Reference table to see each audit weight value.
Why your score fluctuates
The fluctuation in your score can be attributed to several factors:
- Test data variability: The quality and variability of test data can change over time. Different test runs might have varying data inputs, which can influence the performance metrics and, consequently, the score.
- System load and environment changes: The performance of the system being tested can fluctuate due to varying load conditions, environmental factors, or changes in the underlying infrastructure. These fluctuations can impact the test results and the resulting score.
- Test configuration changes: Any modifications to the test configuration, such as changes in test scripts, load patterns, or test duration, can affect the performance metrics. Even minor adjustments can lead to different scores.
- External dependencies: The performance of external services or dependencies integrated into your application can vary, affecting your test results. These variations can contribute to fluctuations in your score.
- Model and algorithm updates: Periodic updates to the scoring algorithms or performance models used by k6 can lead to score variations. These updates aim to improve accuracy and relevance but may cause temporary fluctuations.
Furthermore, even though Cloud Insights provides individual scores, it can be helpful to focus on trends over multiple test runs rather than a single number. Consistent patterns and long-term trends provide a more accurate picture of your application’s performance.
If you have any concerns or need further assistance, consider configuring Cloud Insights to exclude noisy audits or contact Support.
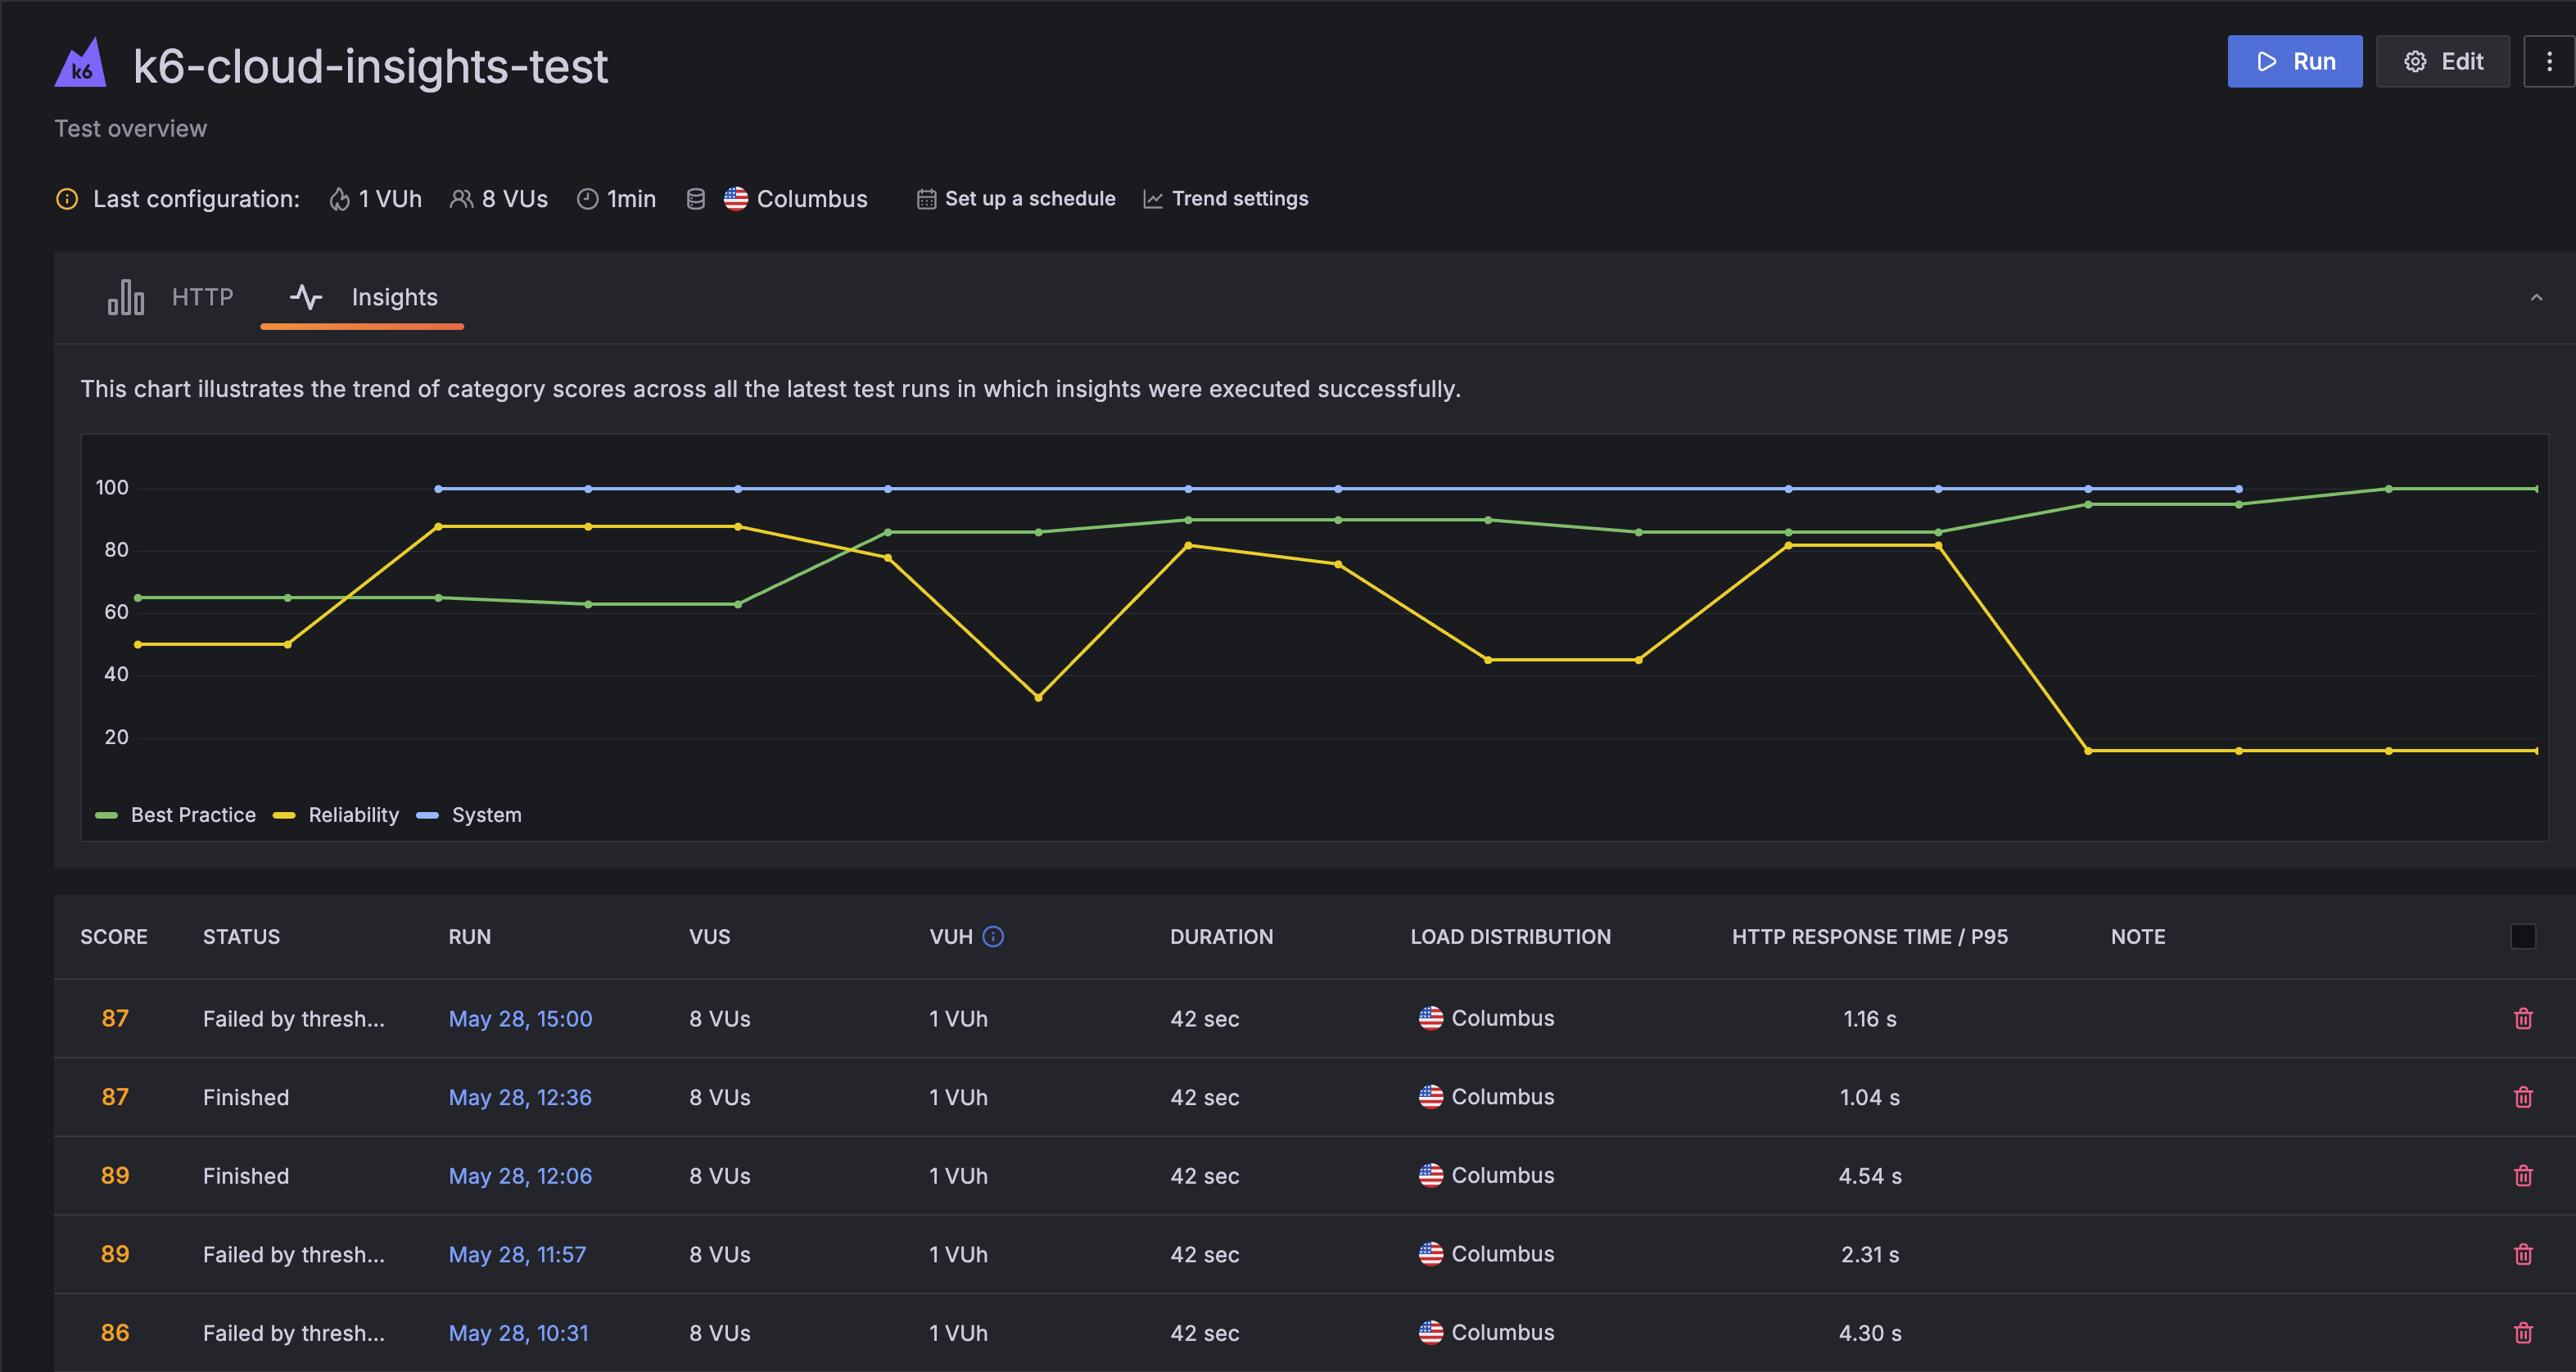
Trends
In addition to providing scores for individual audits, Cloud Insights combines scores from all categories to generate a single test run score, which you can find on your test page. You can also visualize these score trends using the Insights tab.