AWS EC2 dashboard
The Amazon Elastic Compute Cloud (EC2) dashboard shows metrics in the following tabs:
- Overview
- Regions
- Rightsizing
View instances at a high level
The Overview tab of the AWS EC2 dashboard provides a high-level look of all EC2 instances across all your accounts and regions within a selected time frame, starting with a graph of instance count in all regions.
The default columns, which you can filter and sort, include:
- Names of scrape jobs, tag, and autoscaling groups
- CPU utilization average and max percentages
- Average
ESBIOBalance%andEBSByteBalance%

You can use the Overview page to:
- Uncover anomalies in your data.
- Identify instances that do not contain expected tags.
- Discover potential issues, such as instances with higher CPU than normal or instances that are about to burst or hit IO limits.
- Add or remove tags and metrics within the selectors for more granularity.

Tag selector

Filter your views to narrow your focus to instances that you and your team care about, based on how you’re using AWS tags. For example, if you’re using tags to associate instances with the services being hosted, you can narrow your view to contain only instances for the services that your team owns.
When you add or remove tags, these are reflected in the URL as well. Then you can share the URL or bookmark it to come back to the same view later.
Drill into instance detail
From the list of instances on the Overview tab, click an instance for detailed information within a selected time frame.
The instance detail page includes instance metadata. This metadata can be helpful to access the instance, view more in the AWS portal, or understand what is running on the instance.
You can also explore the following CloudWatch metrics for the instance in your selected time frame:
CPUUtilizationNetworkinandNetworkoutDiskWriteOpsandDiskReadOpsStatusCheckFailedebsReadBytesandebsWriteBytesebsReadOpsandebsWriteOps
Close and expand panels for greater focus.
Access Nodes in Kubernetes accounts
From EC2 instance pages in Cloud Provider Observability, you can navigate to Node or Cluster detail pages for AWS managed Kubernetes in Kubernetes Monitoring.
The Kubernetes detail pages includes details about the Kubernetes Node or Cluster your EC2 instance is on including the following details: Cluster and Pod information, OS and kubelet version, and optimization metrics such as CPU and memory requests and capacity.
To drilldown into the AWS managed Kubernetes Node or Cluster details of an EC2 instance, complete the following steps:
From the Services tab in Cloud Provider AWS, find and select AWS/EC2.
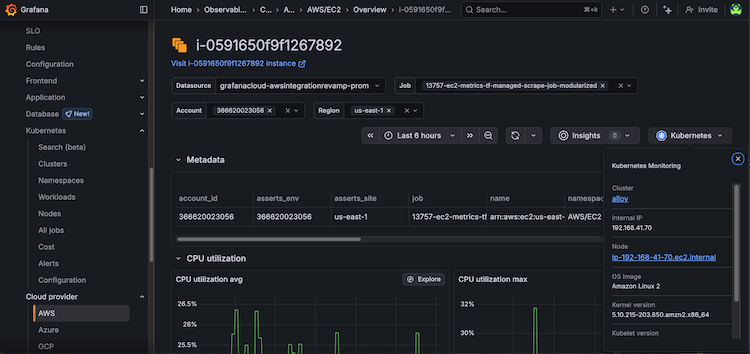
Select the EC2 instance from the Service column to open the instance overview page.
On the far right-side of the instance overview page, click the Kubernetes drop-down button and the Node link to open the Node overview or the Cluster link to open the Cluster overview.
![EC2 instance overview page with Kubernetes drop-down and Node and Cluster links]()
To return to the Cloud Provider AWS Monitoring view of the instance:
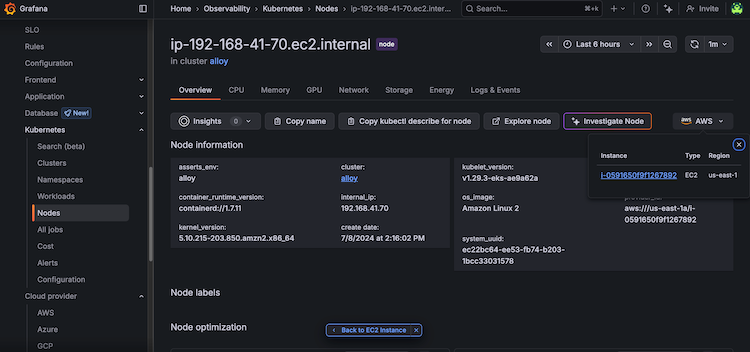
On the Kubernetes Node overview page, click the AWS drop-down and the EC2 instance link or click the Back to EC2 Instance button.
![Kubernetes Node overview page with AWS drop-down and EC2 instance link]()
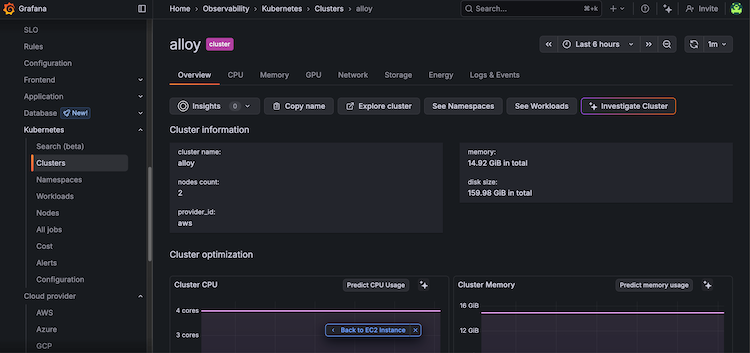
On the Kubernetes Cluster overview page, click the Back to EC2 Instance button.
![Kubernetes Cluster instance overview page with Back to EC2 Instance link]()
To learn more about what information is available about the Kubernetes Cluster or Node, refer to Explore your infrastructure with Kubernetes Monitoring.
View regions
On the Regions tab, view instance count within a selected time frame by:
- Region
- Tag
- All regions

On this page you can:
- View how your instances scale over a region.
- Choose a tag to see how the instance autoscales.
View resources for optimization
On the Rightsizing tab, sort by highest or lowest usage. When you sort from the bottom, you can identify:
- Where to allocate more resources
- Which instances are not fully utilized and you should repack
- The amount of instances to scale down due to lack of need

You can also select the number of instances you would like to see in each table. Instances in the middle range (for instance, the instances that are in the 20th - 40th percentile for a certain metric) could indicate opportunities to repack.
Troubleshooting
The EC2 pages and panels require specific metrics to display all data correctly. If you do not see specific (or any) columns displaying in the list of instances, or panels are showing no data, you can reset your EC2 service to scrape the default metrics by completing the following steps:
- Navigate to the Configuration Details tab.
- Click Edit next to the scrape job you want to change.

Scrape job - Click the icon next to AWS/EC2 to expand the metrics details.

Icon for expanding details - Scroll until you see the buttons that control the settings.

Expanded details with settings buttons - Click Reset to defaults. This will ensure all metrics required for viewing EC2 data are set.
- Click Save service settings.


