Menu
Documentation Grafana Cloud
Knowledge graph
Advanced configuration
Enable metrics collection
Application frameworks
gRPC
Grafana Cloud
Knowledge graph
Advanced configuration
Enable metrics collection
Application frameworks
gRPC
Grafana Cloud
Configure gRPC Go to generate Prometheus metrics
gRPC Go supports Interceptors which is middleware that gRPC Server executes before the request is passed to the user’s application logic. It is a perfect way to implement common patterns: auth, logging, and monitoring.
To use Interceptors in chains, refer to go-grpc-middleware.
This library requires Go 1.9 or later.
To configure gRPC Go to generate Prometheus metrics, complete the following steps:
Navigate to go-grpc-middleware.
Complete the steps in the README.
Verify the presence of the following metrics in Prometheus:
- grpc_server_handled_total
- grpc_server_handling_seconds_bucket
Metrics
Alerts
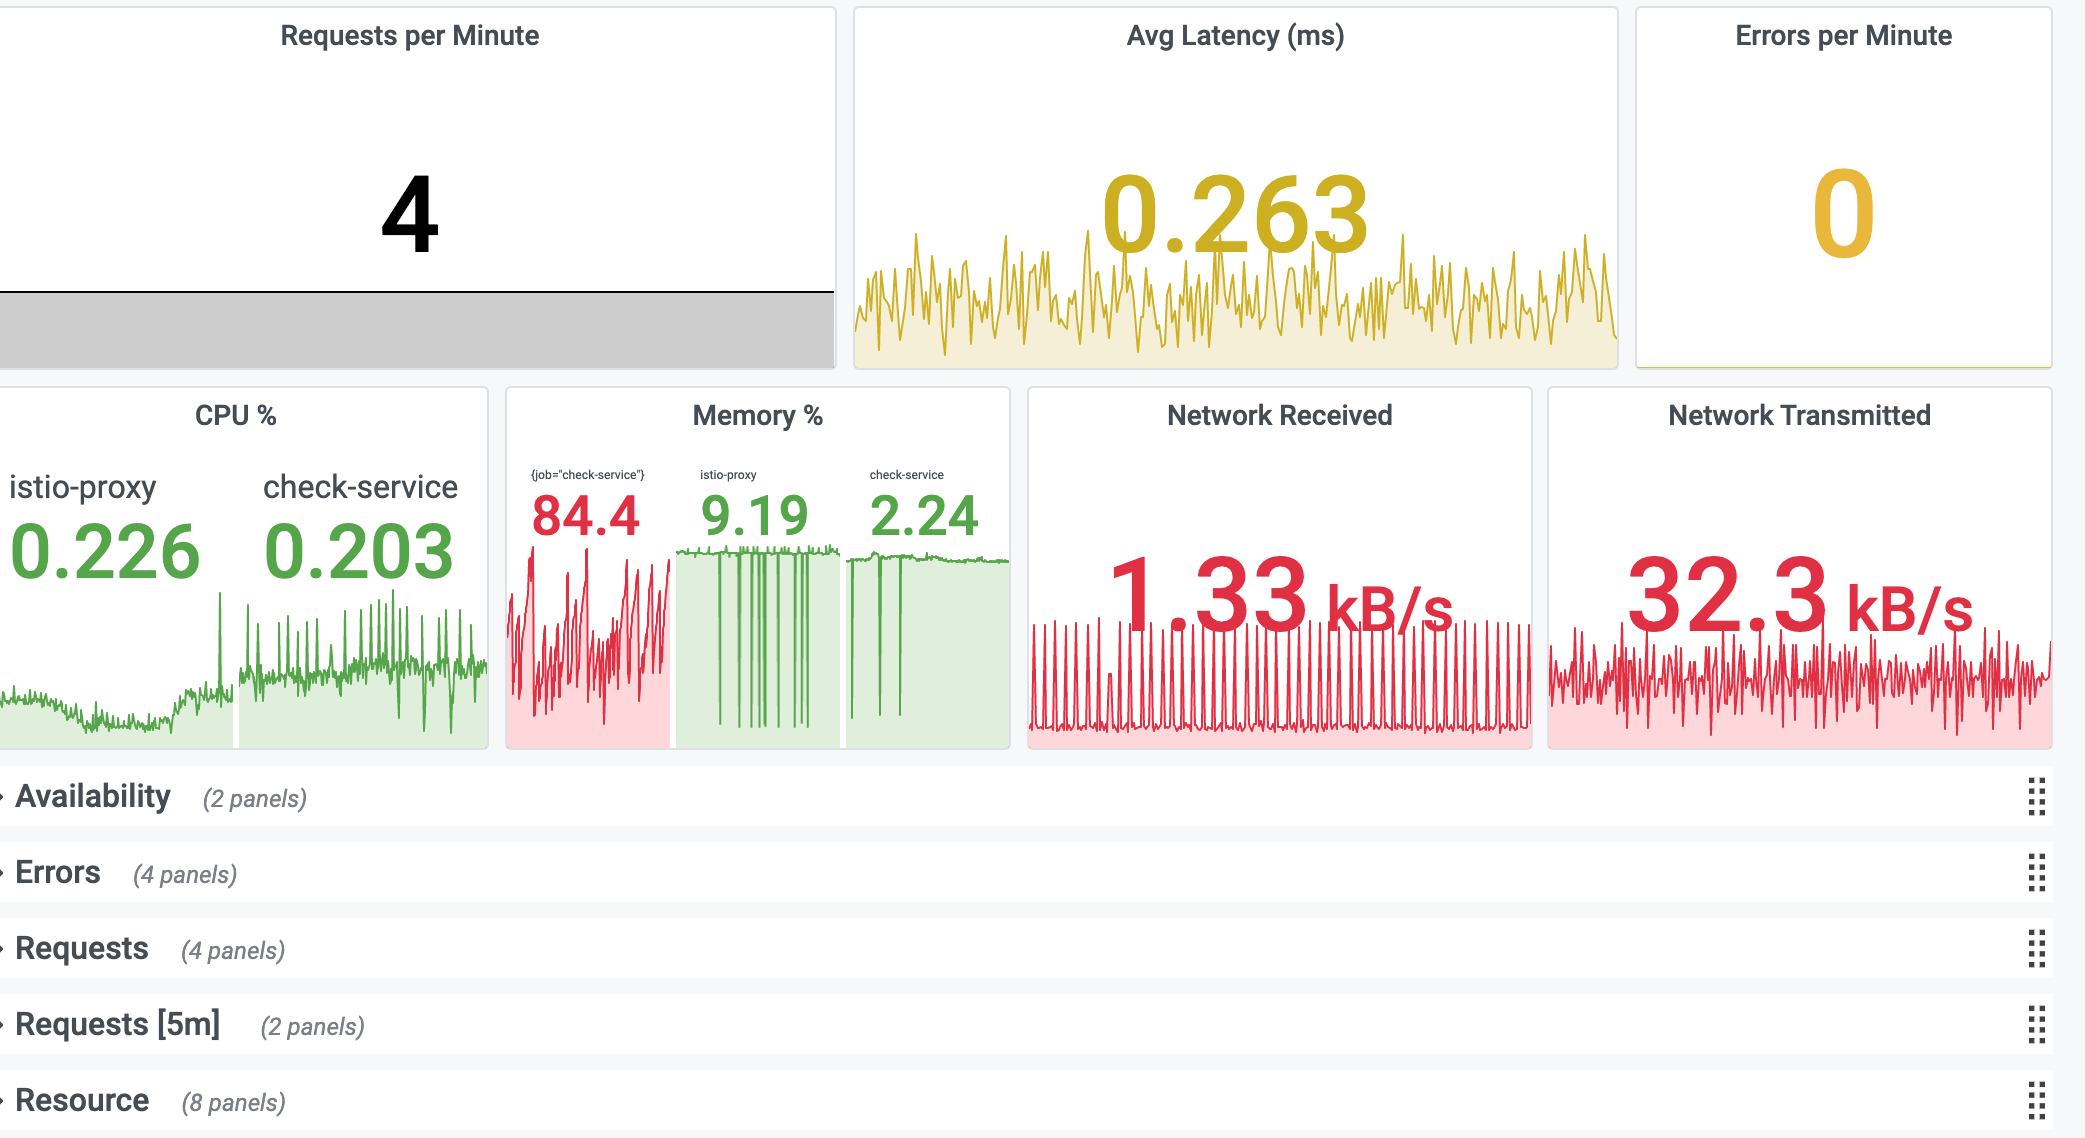
Service KPI dashboard
This dashboard has the following KPIs for resources and requests:
- Request Rate
- Latency Average
- Latency P99
- Error Rate
- CPU %
- CPU Cores Used
- CPU Throttle
- Memory %
- Memory Bytes
- Disk Usage
- Network Usage