Prometheus data source
Prometheus is an open source database that uses a telemetry collector agent to scrape and store metrics used for monitoring and alerting.
Grafana provides native support for Prometheus, so you don’t need to install a plugin.
The following documentation will help you get started working with Prometheus and Grafana:
- What is Prometheus?
- Prometheus data model
- Getting started
- Configure the Prometheus data source
- Prometheus query editor
- Template variables
Exemplars
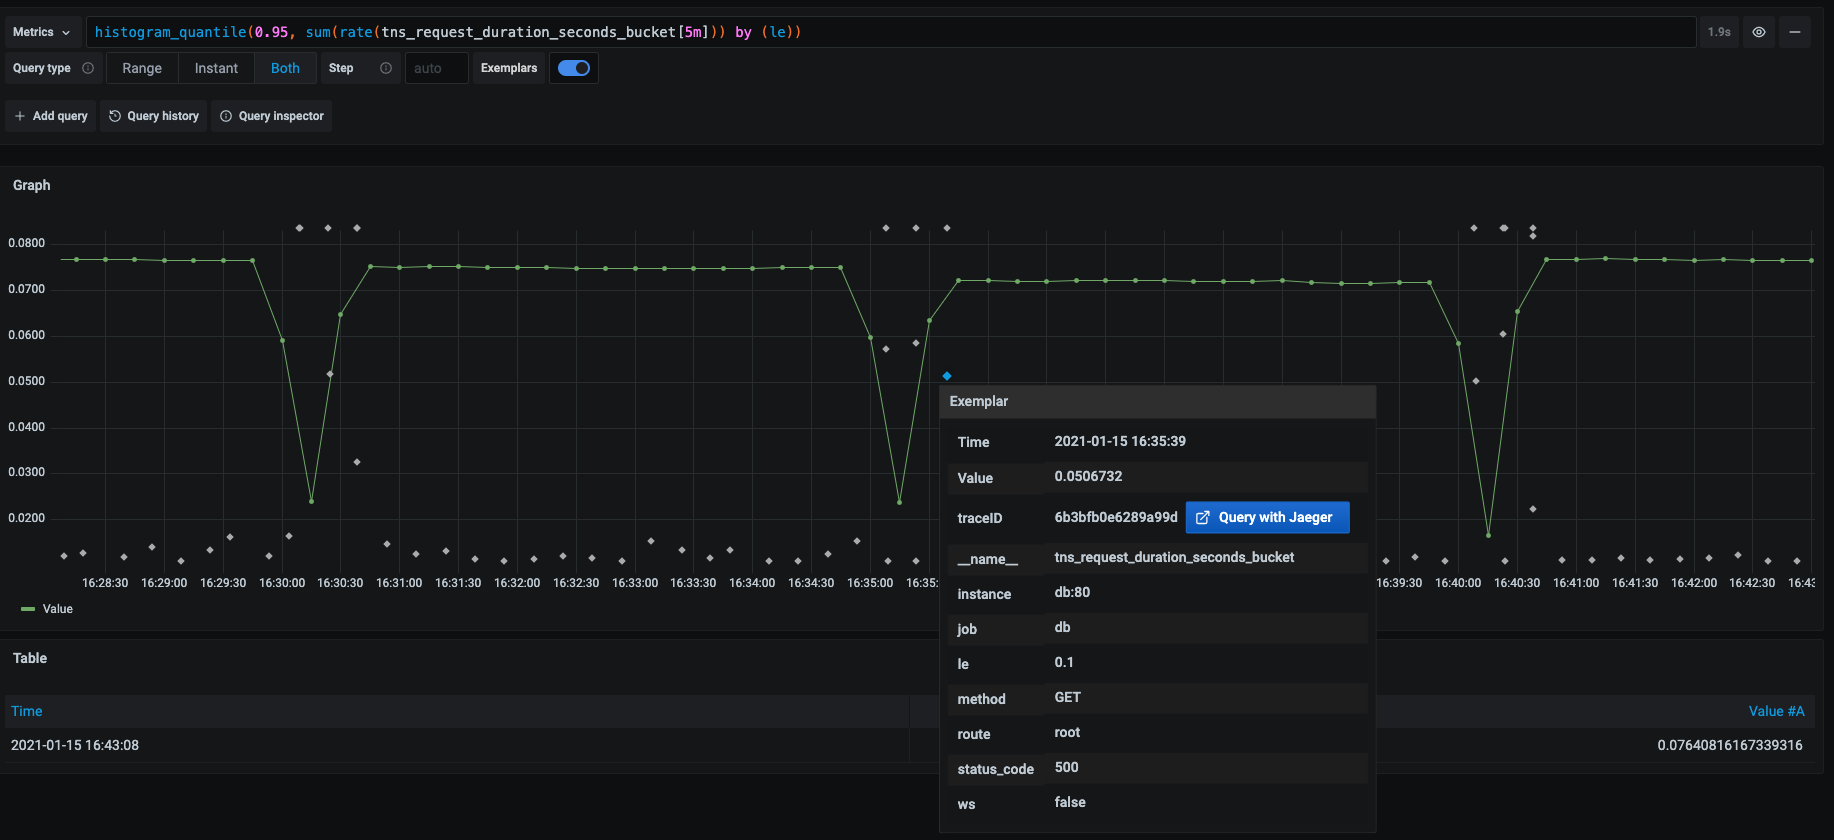
In Prometheus, an exemplar is a specific trace that represents a measurement taken within a given time interval. While metrics provide an aggregated view of your system, and traces offer a detailed view of individual requests, exemplars serve as a bridge between the two, linking high-level metrics to specific traces for deeper insights.
Exemplars associate higher-cardinality metadata from a specific event with traditional time series data. Refer to Introduction to exemplars in the Prometheus documentation for detailed information on how they work.
Grafana can show exemplar data alongside a metric both in Explore and in Dashboards.

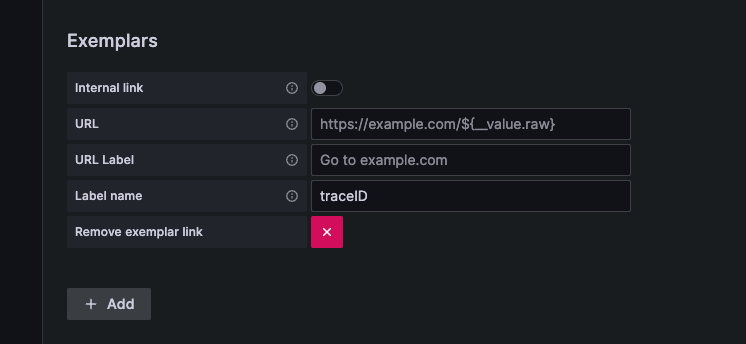
You add exemplars when you configure the Prometheus data source.

Prometheus API
The Prometheus data source also works with other projects that implement the Prometheus querying API.
For more information on how to query other Prometheus-compatible projects from Grafana, refer to the specific product’s documentation:
View Grafana metrics with Prometheus
Grafana exposes metrics for Prometheus on the /metrics endpoint and includes a pre-built dashboard to help you start visualizing your metrics immediately.
Complete the following steps to import the pre-built dashboard:
- Navigate to the Prometheus configuration page.
- Click the Dashboards tab.
- Locate the Grafana metrics dashboard in the list and click Import.
For details about these metrics, refer to Internal Grafana metrics.
Amazon Managed Service for Prometheus
Grafana has deprecated the Prometheus data source for Amazon Managed Service for Prometheus. Use the Amazon Managed Service for Prometheus data source instead. The linked documentation outlines the migration steps.
Get the most out of the Prometheus data source
After you install and configure Prometheus you can:
- Create a wide variety of visualizations
- Configure and use templates and variables
- Add transformations
- Add annotations
- Set up alerting
- Create recorded queries


