
Release date:
What's new in Grafana Cloud
Grafana Cloud
RSS
What’s new in Grafana Cloud
Grafana Labs products, projects, and features can go through multiple release stages before becoming generally available. These stages in the release life cycle can present varying degrees of stability and support. For more information, refer to release life cycle for Grafana Labs.
No results found. Please adjust your filters or search criteria.
Page:
Fleet Management + Kubernetes Monitoring
Generally AvailableKubernetes Monitoring
Release date: 2025-03-12
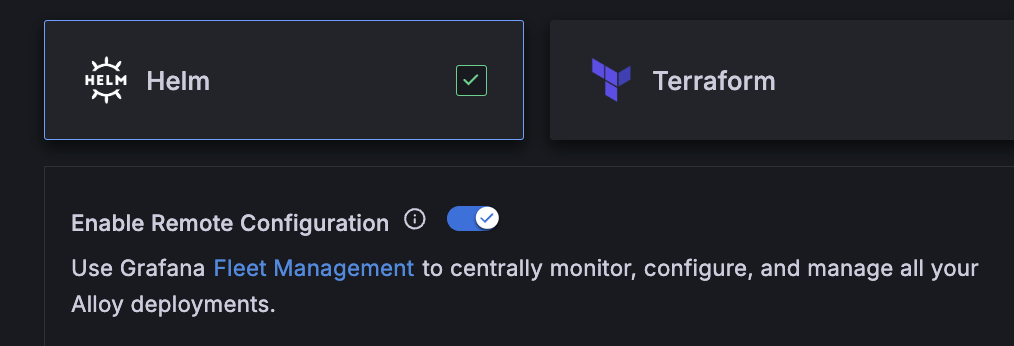
When you configure Kubernetes Monitoring, you can select Fleet Management for monitoring, configuring, and managing your Alloy deployments.
Additional buttons are available on any Cluster detail page for you to immediately access the namespaces and workloads on the Cluster.

Fleet Management is now GA
Generally AvailableAlloy
Release date: 2025-03-12
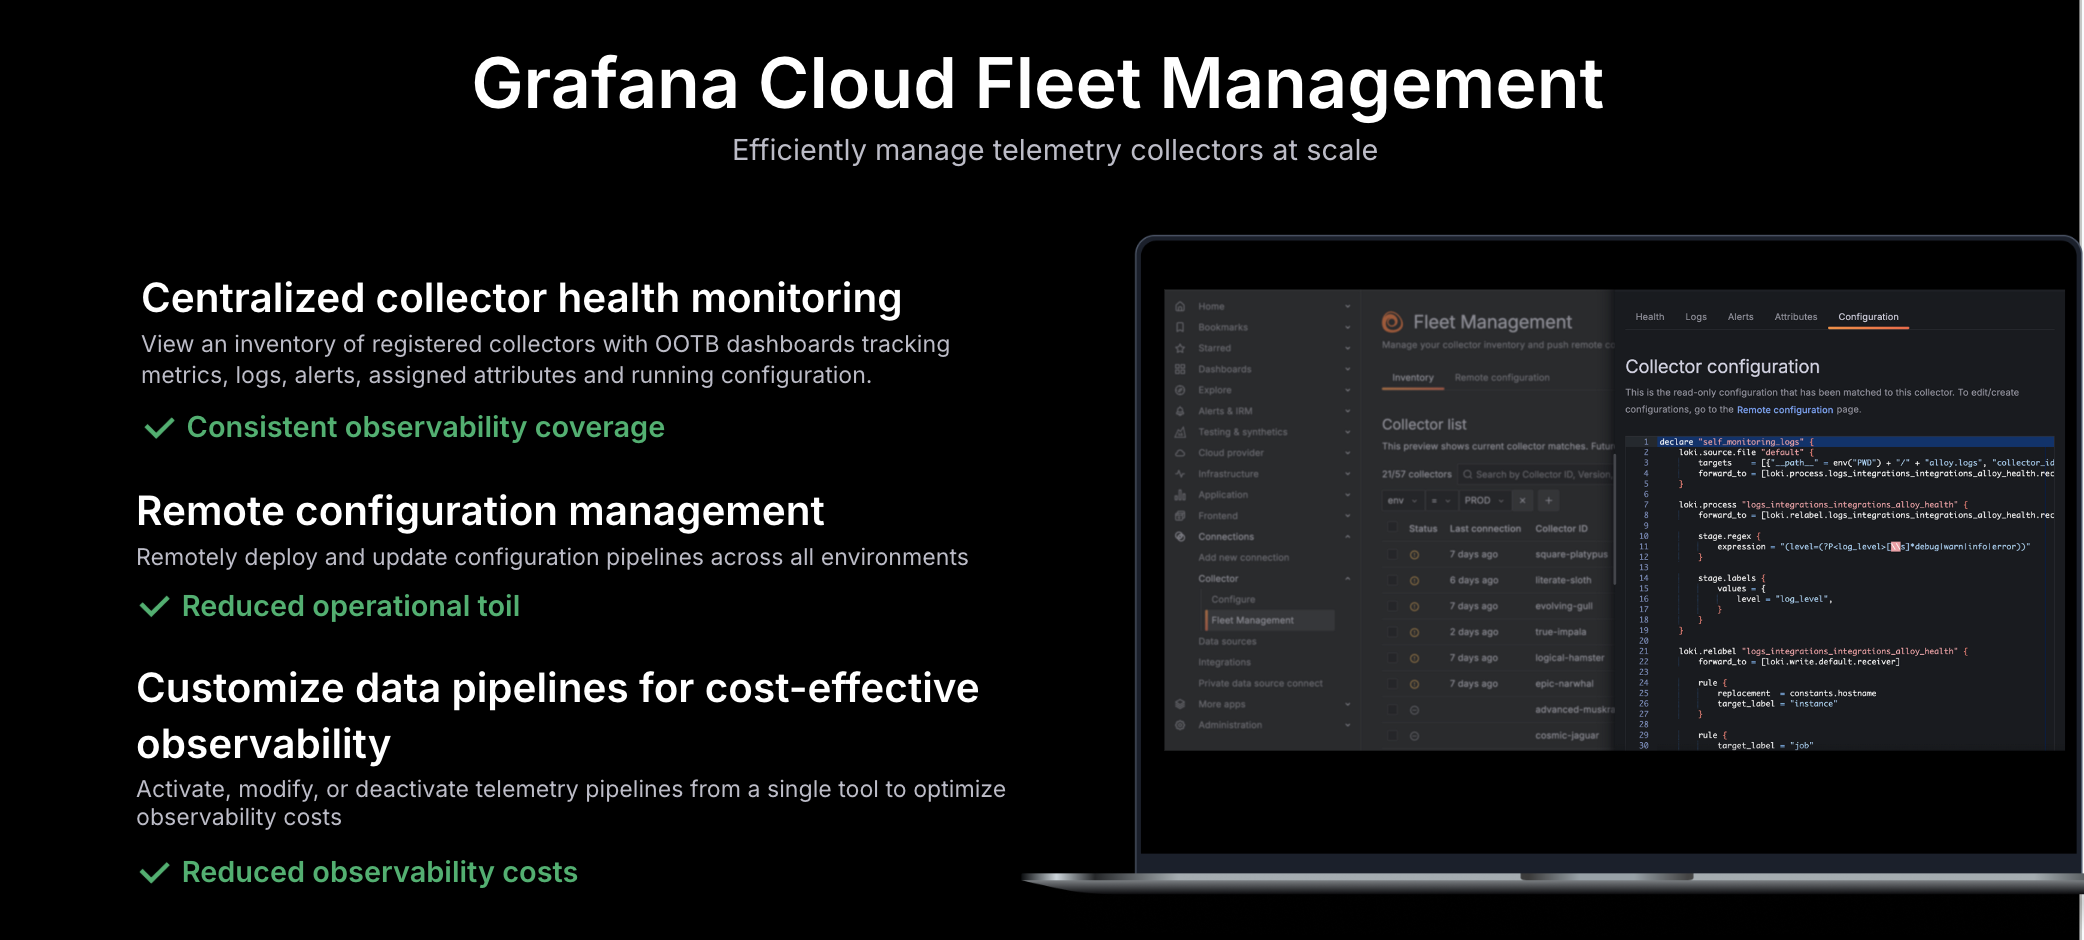
We’re excited to announce that Grafana Fleet Management is generally available! Since launching Fleet Management in public preview last November, we’ve been working to add more features to help you monitor and manage your collector fleets at scale. Here are some of these enhancements:
- Provision your collectors and configuration pipelines with Terraform.
- Deploy and configure collectors as native Kubernetes resources.
- Add pre-built configuration pipelines from the integration catalog.
- Learn how to streamline your remote configuration workflows to help you save time and money.
Get started with Grafana Fleet Management today!
Plugin details links improvements
Available in public previewPlugins
Release date: 2025-03-12
Standardized links for plugins to simplify user-developer interactions
We’re pleased to announce an improvement to the Grafana plugin catalog that benefits both Grafana users and plugin developers. By introducing standardized links on plugin details pages, we’re making it easier for users to engage with developers, and find the essential information they need to get the most out of a plugin. Developers, in turn, will gain valuable feedback and support from their audience.

Grafana Cloud Metrics - OpenTelemetry Resource Attribute Default Labels
Generally AvailableMetrics
Release date: 2025-03-10
On March 10, 2025, we started rolling out a default list of resource attributes as labels on Grafana Cloud Metrics. The goal is to simplify data exploration and correlation for customers sending OpenTelemetry metrics. We expect the total rollout time to be a few weeks.
Improved performance in geomap visualizations
Generally AvailableDashboards and visualizations
Release date: 2025-03-07
We’ve moved over to WebGL for geomap marker layers. You can expect a significant increase in performance and stability, which is especially noticeable for larger datasets.
The following examples show a comparison of before and after switching to WebGL.
Before


After


Alert rule version history
Generally AvailableAlerting
Release date: 2025-03-07
Alerting support for Jira Service Management contact point
Generally AvailableAlerting
Release date: 2025-03-05
In response to the recent deprecation of OpsGenie, Grafana Alerting has added support for Jira Service Management as a Grafana Managed contact point. You can ensure you don’t miss any critical alerts by updating your OpsGenie contact points to use Jira Service Management.
Alert rule version history
Generally AvailableAlerting
Release date: 2025-03-05
Grafana Managed Alerts now supports version history. You can view, compare, and restore your alert’s historical versions by navigating to the alert details view of any Grafana Managed Alert rule and clicking the Version tab.
LBAC for data sources - metrics
ExperimentalData sourcesAuthentication and authorizationMetrics
Release date: 2025-02-28
It can be hard for teams to collaborate on dashboards when they have to use different data sources. Grafana instances can become cluttered and confusing with hundreds of data sources.
LBAC (Label Based Access Control) for data sources - metrics is our second step towards seamless management of access for Mimir metrics. Each team views the same data source filtered by their team’s label permissions.

New Actions cell type for table visualizations
Generally AvailableDashboards and visualizations
Release date: 2025-02-26
The table visualization now includes a new Actions cell type, which lets you trigger actions directly from table cells. This enhancement allows you to define custom actions, such as triggering external workflows, from within a table column:
Visualization actions are now GA
Generally AvailableDashboards and visualizations
Release date: 2025-02-26
Actions for visualizations are now generally available. With actions, you can trigger basic, unauthenticated API calls from a dashboard panel. Previously experimental, actions are now generally available for the following visualizations:
- Time series
- Bar chart
- Candlestick
- State timeline
- Status history
- Table
- Trend
- XY chart
You can find actions under the Data links and actions section of the panel editor pane (previously the Data links section).
Graphite, Splunk, and AppDynamics are now supported by Grafana SLO
Generally AvailableSLOs
Release date: 2025-02-25
Grafana SLO now supports Graphite, Splunk, and AppDynamics data sources, enabling teams to monitor and improve the reliability of even more of their services. You can now track SLOs across a broader range of observability data, ensuring more comprehensive service health insights and reducing alert fatigue.
Better time region control in Annotations with Cron syntax
Generally AvailableDashboards and visualizations
Release date: 2025-02-20
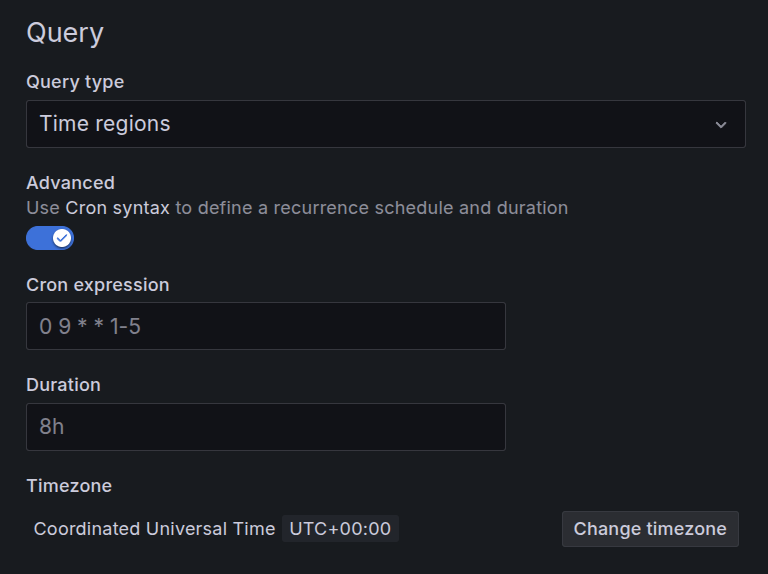
Using Cron syntax, you can define more granular schedules than previously possible with just weekday and time selections. For example, it is now possible to create a single time region query that marks periods like “At 21:00 on the second Tuesday of every other month” or “Weekdays 9-5.” To try it out create an Annotation, toggle the Advanced switch and use Cron syntax to set more granular time region controls.
Dashboard variables supported for all transformations
Generally AvailableDashboards and visualizations
Release date: 2025-02-17
In previous releases, we added support for dashboard variables to a small number of transformations. Now this functionality has been added to all transformations, where applicable. All text input fields in transformations accept variable syntax:
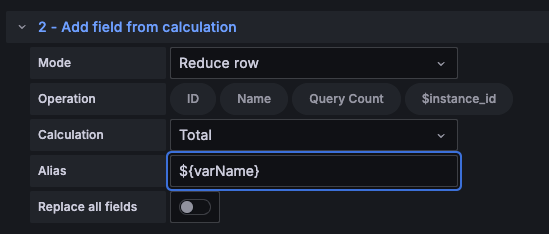
When you use dashboard variables in transformations, the variables are automatically interpolated before the transformations are applied to the data.
One-click data links in visualizations
Generally AvailableDashboards and visualizations
Release date: 2025-02-13
You can now configure data links to be accessed with a single click. We’ve added the One click switch to data links for the following visualizations:
- Time series
- Bar chart
- Candlestick
- State timeline
- Status history
- Trend
- XY chart
You can only have one One click data link, so if you enable it for one, the feature is automatically disabled for others.
Was this page helpful?
Related resources from Grafana Labs
60 min

Getting started with managing your metrics, logs, and traces using Grafana
In this webinar, we’ll demo how to get started using the LGTM Stack: Loki for logs, Grafana for visualization, Tempo for traces, and Mimir for metrics.
60 min

Intro to Kubernetes monitoring in Grafana Cloud
In this webinar you’ll learn how Grafana offers developers and SREs a simple and quick-to-value solution for monitoring their Kubernetes infrastructure.
60 min

Building advanced Grafana dashboards
In this webinar, we’ll demo how to build and format Grafana dashboards.