Grafana Cloud Asserts
Contextual root cause analysis workflows
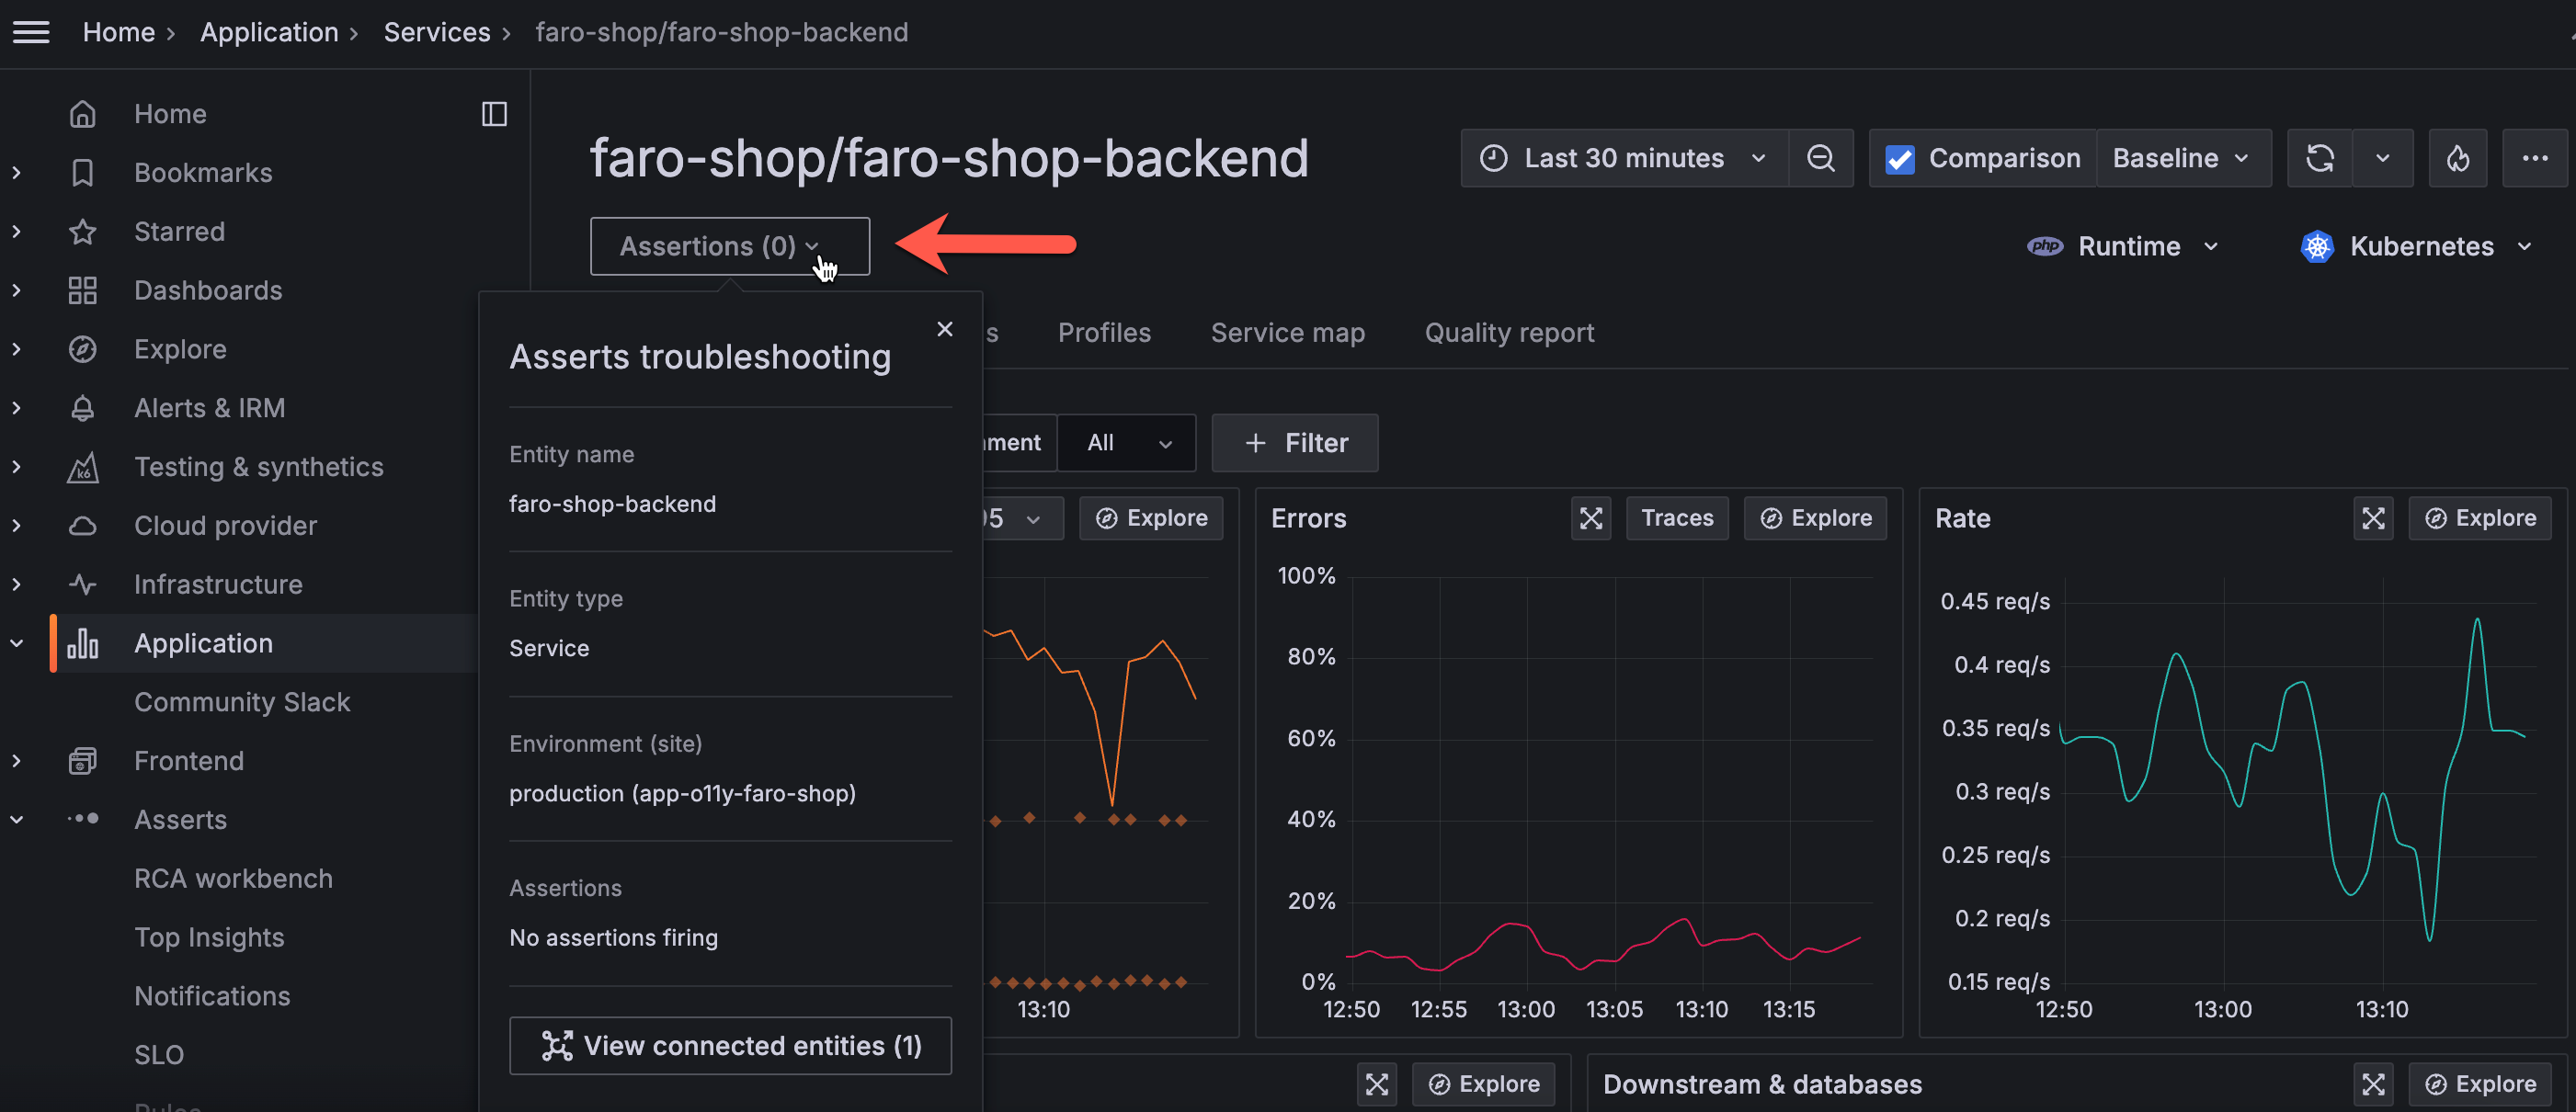
Asserts now supports root cause analysis bi-directional navigation between Asserts and Grafana Application Observability and Kubernetes Monitoring. When you are in Application Observability or Kubernetes Monitoring, you can seamlessly explore Assertions in Asserts without losing context. When in Asserts, you can easily navigate to Application Observability or Kubernetes Monitoring.
Grafana Cloud Asserts infrastructure solution dashboards
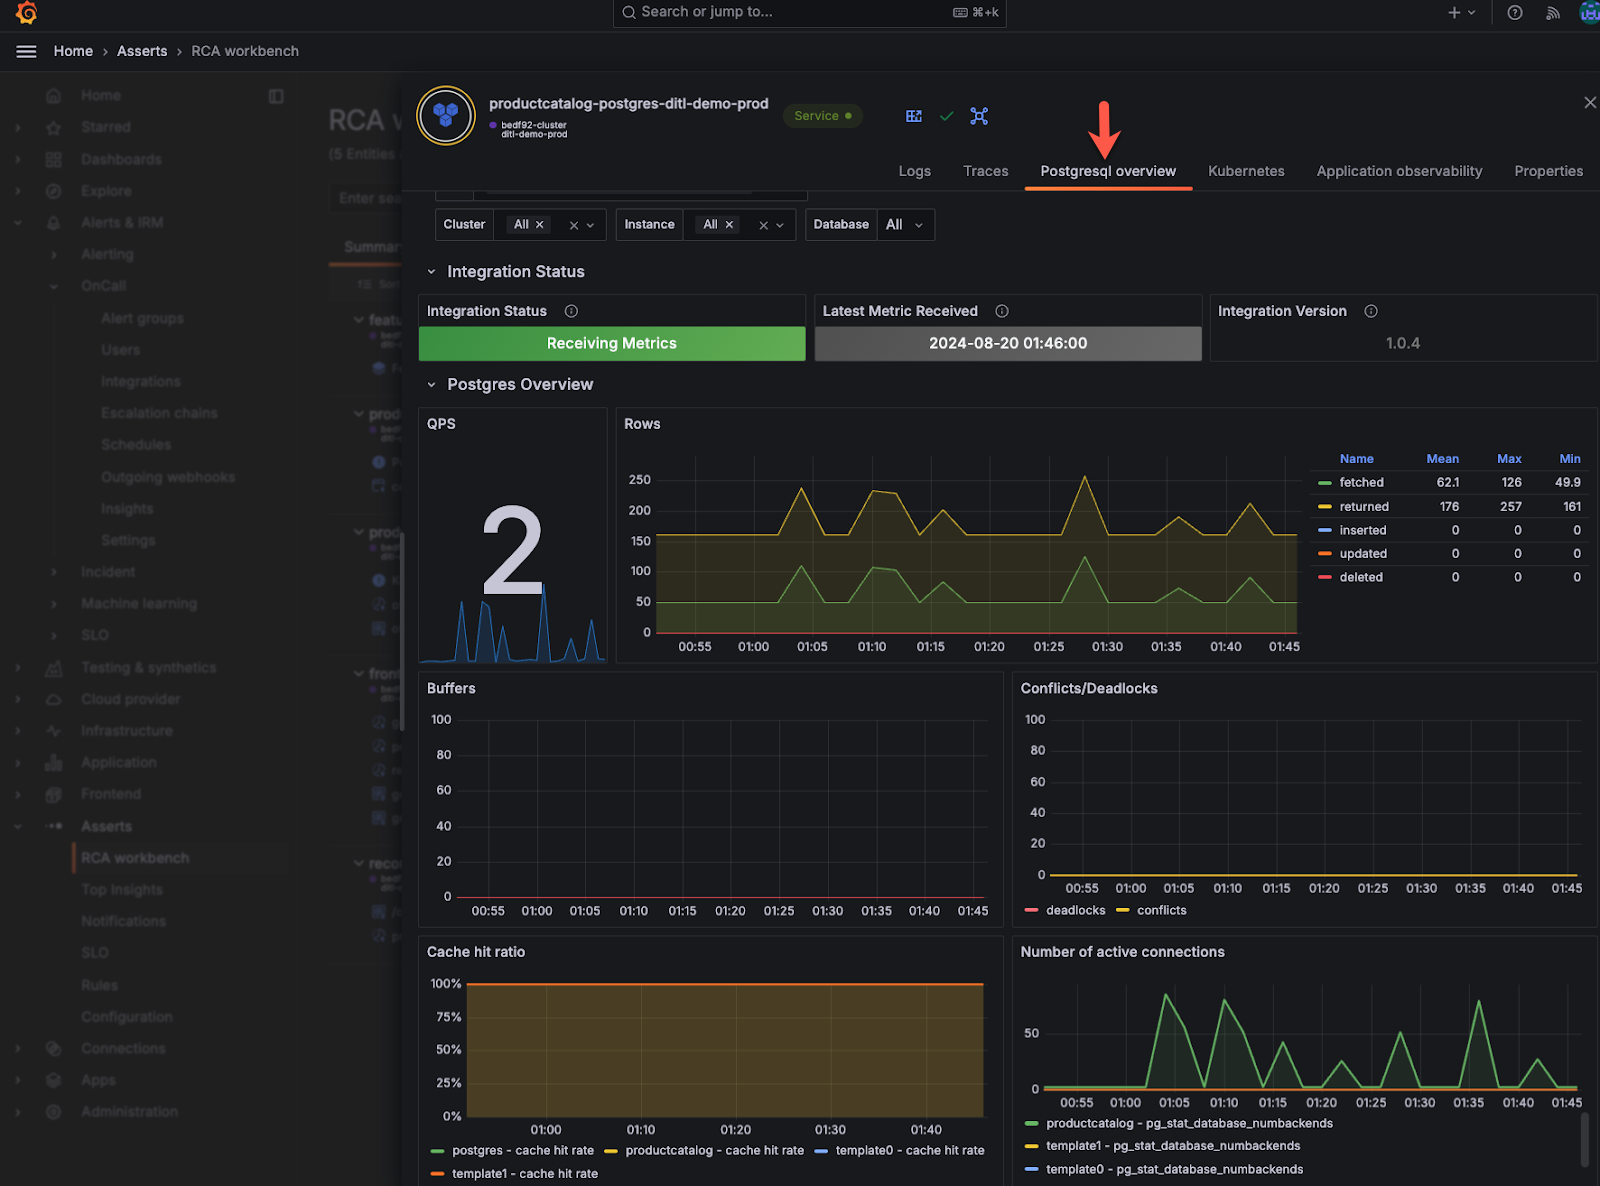
Asserts now automatically surfaces KPI dashboards for popular infrastructure components. If you’ve installed any of the following Grafana Cloud integrations, these dashboards automatically appear in Asserts.
- MongoDB
- Jenkins
- Apache Tomcat
- Windows
- Docker
- MySQL
- SNMP
- PostgreSQL
- Clickhouse
- Caddy
We are continuously expanding the list of supported solutions.
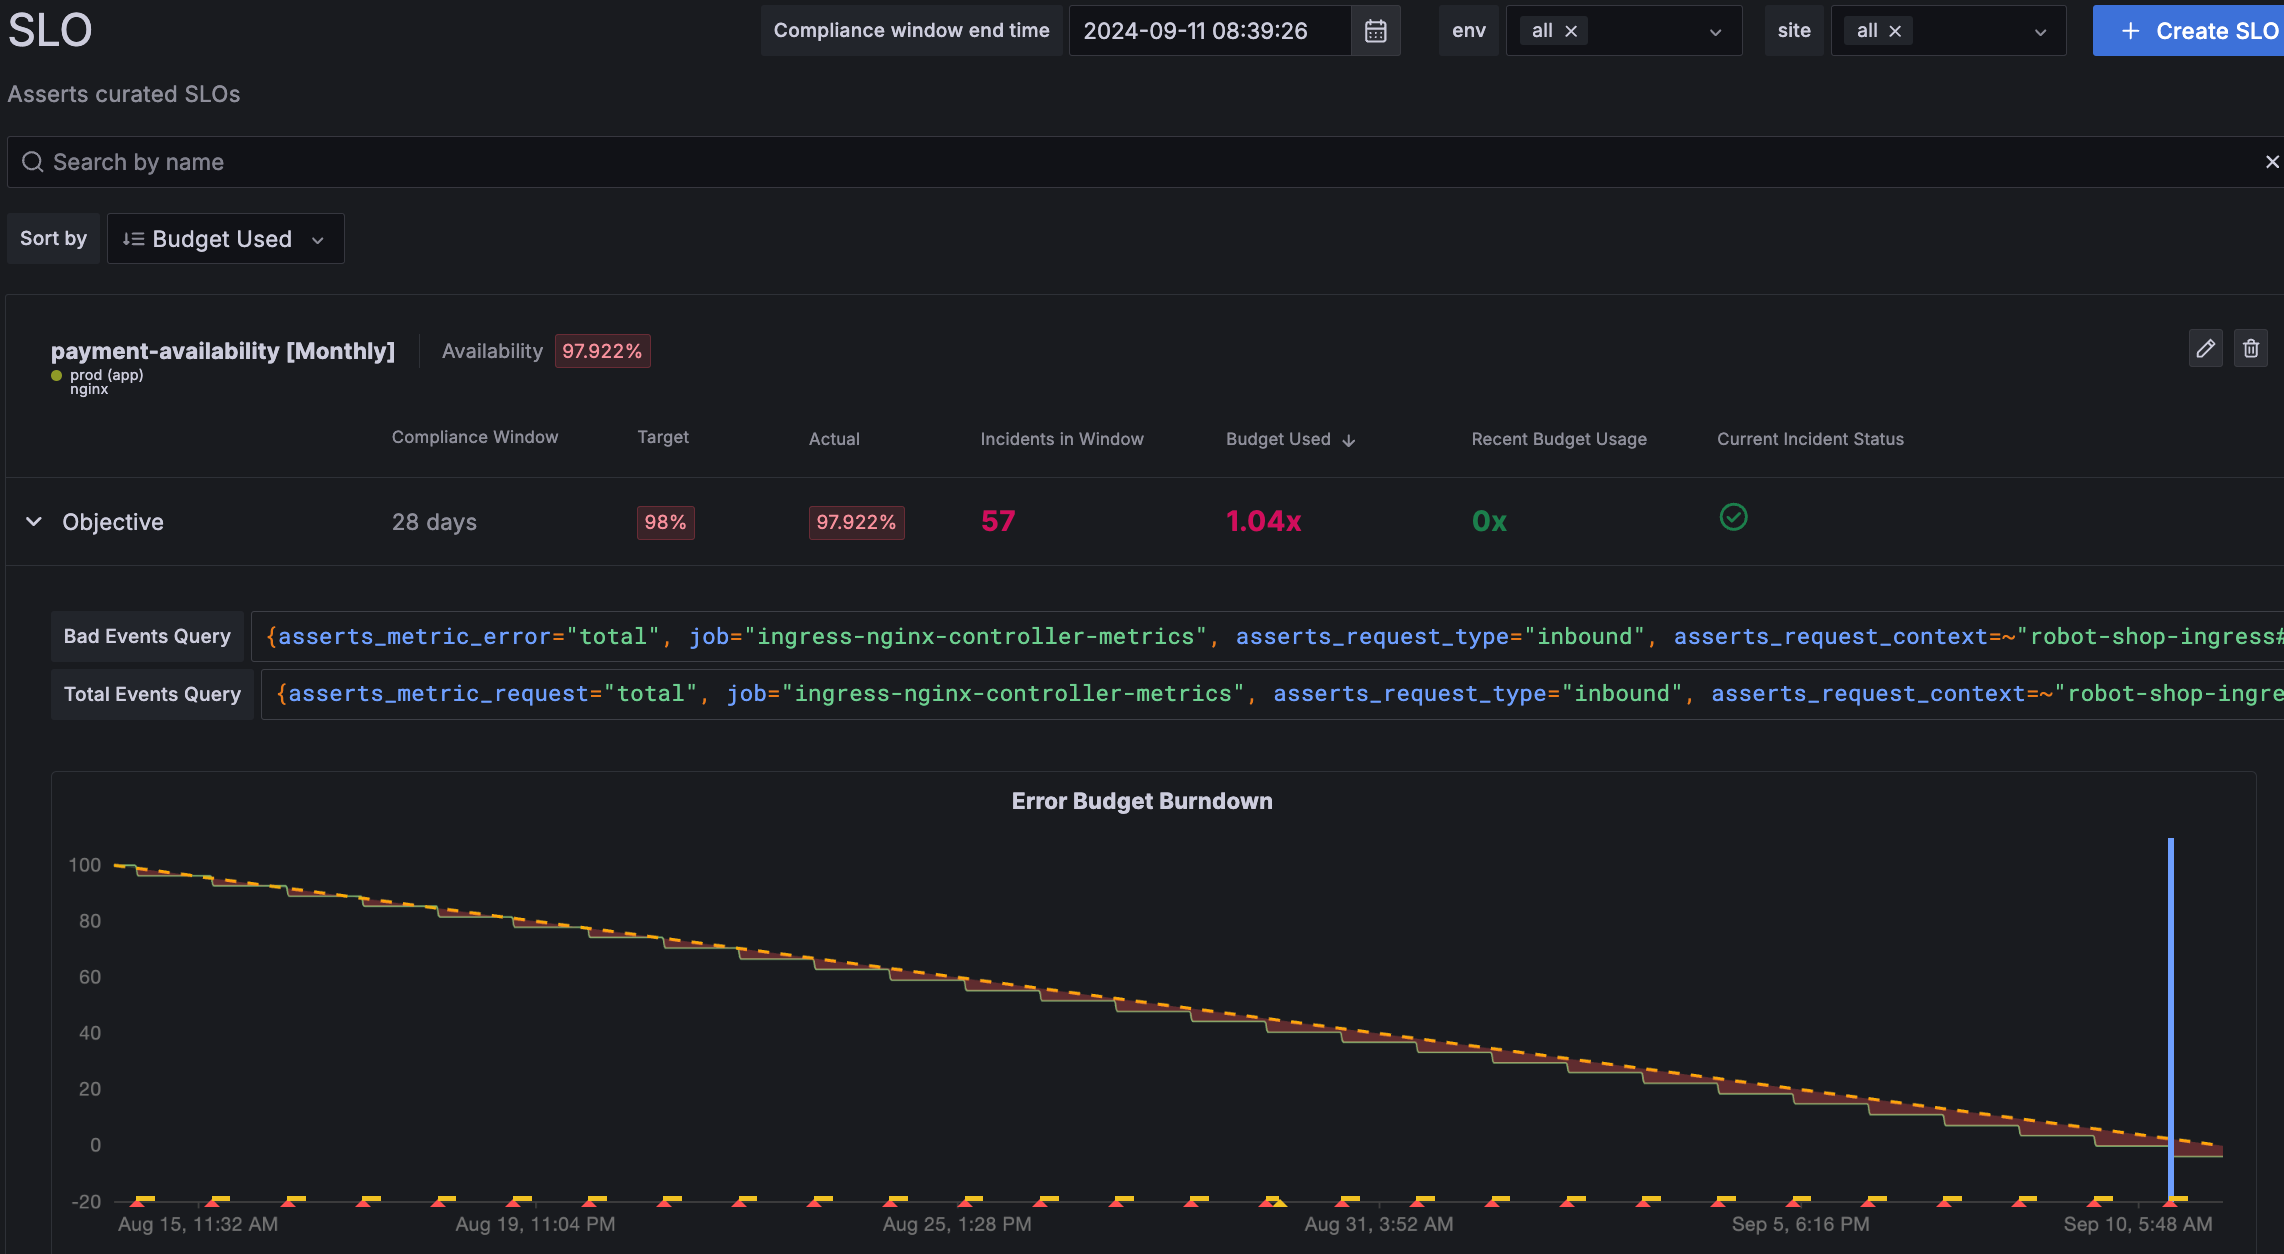
Asserts SLOs
You can now establish Asserts SLOs to evaluate the quality of service you deliver to users. SLOs enable you to gather data on your systems’ reliability over time. This information can help engineering teams minimize alert fatigue, prioritize reliability, and enhance the level of service provided to customers.