Uptime and reachability
In the Synthetic Monitoring Application there are two key indicators to help you understand the health of your services: uptime and reachability.
Both indicators are calculated using successful check executions but demonstrate the health of your services in different ways.
Before we explain how the indicators are calculated, it’s important to understand a few concepts:
- Time point: A time point is the same length of time as your check’s frequency: if you have a check that runs every five minutes, then a time point is five-minutes long (12 time points per hour), if your check is every minute, then a time point is one-minute long (60 time points per hour).
- Probe: A probe is running the Synthetic Monitoring agent which is responsible for performing a single check execution for each time point. Probes are either public or private and are usually identified by their physical location.
- probe_success: A metric generated by each probe that represents the success or failure of its execution: 0 is failure, 1 is success.
Uptime definition
Uptime is the percentage of reported time points within a given period that had at least one successful probe execution. It can be expressed as:
Uptime = (Successful Time Points / Reported Time Points) * 100Success is defined by the check’s success criteria, which you define when creating or editing individual checks.
Consider the following example, showing probe_success results for three probes over four time points:
In this example uptime would be 75% (three successful time points out of four reported time points).
Reachability definition
Reachability is a simpler calculation: the percentage of successful probe executions for any given time range. It can be expressed as:
Reachability = (Successful Executions / Measured Executions) * 100Re-using the example in the table above, ProbeA had three successes, ProbeB had two successes, and ProbeC had one success. In that case, the reachability would be 50% (6 successes out of 12 executions).
Uptime versus reachability
With a single probe, uptime and reachability generate the same result. However, as you add more probes for your checks the two metrics may diverge and provide more valuable insights into the health of your services.
If your monitored service has a high uptime but decreased reachability, establishing what probes are failing may reveal regional problems for your service or the path taken in the network. If your uptime and reachability are both decreasing, it is a strong indicator the problem lies with the root of your service itself rather than being a regional issue.
Note
A best practice is to add multiple probes to your checks to get a more accurate picture of your service’s health and assist in reducing your MTTR (Mean Time To Resolution) when issues arise. Multiple probes help to reduce alert flapping and counteract the sometimes unreliable nature of the internet.
As you add more probes keep in mind how to balance your frequency and probe count to avoid unnecessary costs.
Uptime and reachability under the hood
The Synthetic Monitoring probes report their execution results in the form of metrics to Grafana Cloud Mimir and logs to Grafana Cloud Loki.
To calculate uptime and reachability, Synthetic Monitoring uses the probe_success and probe_all_success metrics to derive their results.
When visualizing each indicator as a single stat panel, it sends a range query to Grafana Cloud Mimir and performs a client-side Grafana transformation calculating the mean average so the time series is reduced to a single value.
For uptime, the PromQL expression is:
max by () (max_over_time(probe_success{job="$job", instance="$instance"}[$frequencyInSeconds]))With an additional parameter for the interval being $frequencyInSeconds.
For reachability the expression is:
sum(rate(probe_all_success_sum{job="$job", instance="$instance"}[$__rate_interval])) / sum(rate(probe_all_success_count{job="$job", instance="$instance"}[$__rate_interval]))With an additional parameter for the interval being $frequencyInSeconds.
Each of these queries can also be used for time series panels to visualize uptime and reachability over time.
A visual example and known limitations
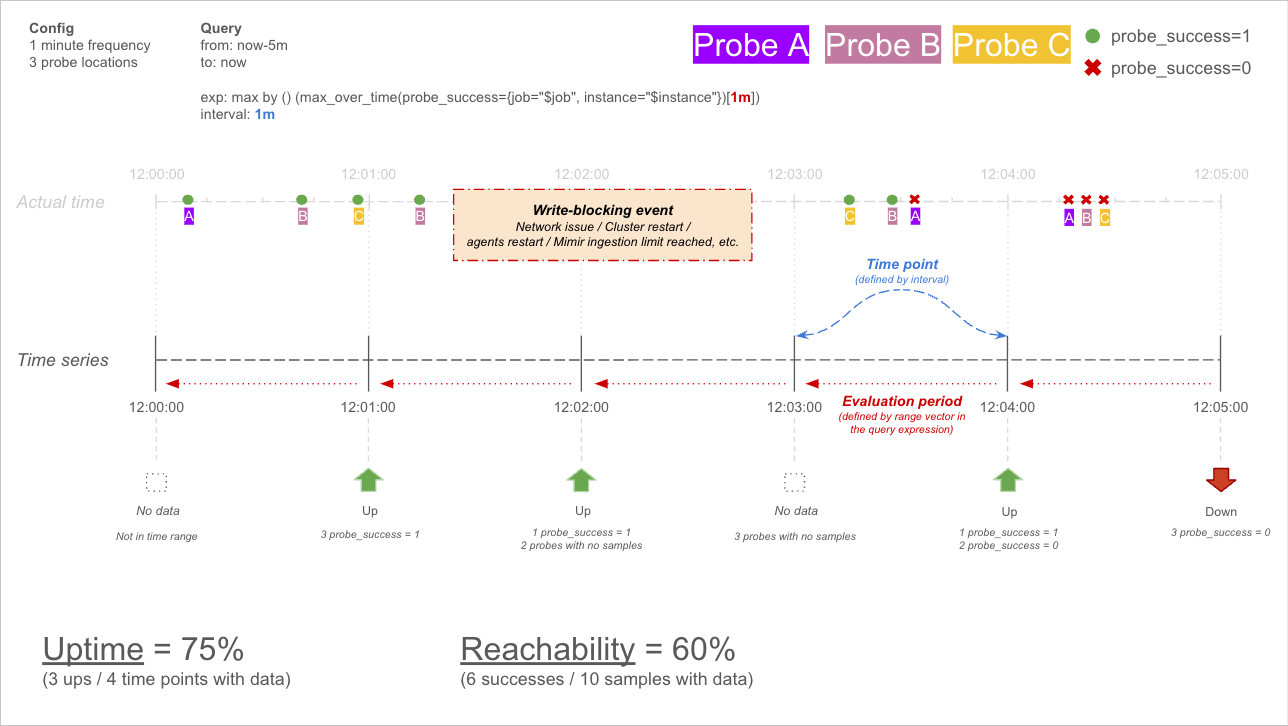
In the example above, there is a check that runs every minute with three probes. The results are being evaluated for the last five minutes and within this period there was a short write-blocking event.
- For the first time point three successes are reported
- For the second time point, there is only a single probe result because of the write-blocking event.
- By the time the write-blocking event subsides, the third time point is about to expire - there is not enough time for the probe executions to start, run and report their results, so they resume and get reported in the fourth time point.
- The fourth time point has two successes and a failure
- The fifth time point has three failures
In this example, the uptime would be 75% (three successful time points out of four reported time points) and the reachability would be 60% (six successes out of ten executions).
The limitation encountered here is despite the time range covering five time points, only four time points reported results. The state of the system being monitored could not be determined for the missed time point, so it’s omitted altogether. This is a relatively rare occurrence but can happen when there are write-blocking events or other issues that prevent the probes from executing.
Note
Depending on the write-blocking event, reachability may report more accurately because it uses the
probe_all_successsummary metric. This metric keeps a running count of successful executions in the probe’s agent, so if the execution did run but could not report its sample to Mimir, the result would still be represented when reporting resumed.


