Collect Azure Metrics with Grafana Alloy
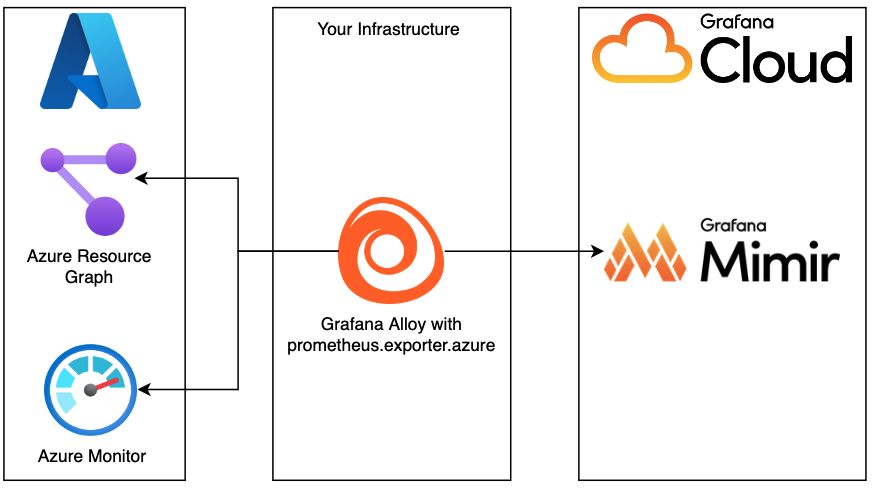
Complete the following steps to configure Azure Metrics with Grafana Alloy. This Alloy setup uses Azure Resource Graph to identify resources for metric collection. After identifying resources, Grafana Alloy, embedded with the azure-metrics-exporter, uses the Azure Monitor APIs to gather metric data. After the metric data is gathered, that data is written to Grafana Cloud Metrics.
The following diagram illustrates using Grafana Alloy on your own infrastructure to collect Azure metrics:
Navigate to Cloud provider Azure configuration
- Open your Grafana Cloud Portal.
- Expand Observability > Cloud provider in the main menu.
- Select Azure.
- Click the Configuration tab.
Navigate to Azure Metrics with Alloy
- Click Manually with Alloy on the toggle for how you want to configure Azure.
- Select the Azure Metrics tile for what you want to monitor.
Select your platform
Select the platform and Architecture from the drop-down menus.
Install Alloy
Grafana Alloy includes an embedded exporter to gather and send metrics to Grafana Cloud.
- If you have not already installed Alloy where you intend to run Azure Metrics, click Run Grafana Alloy.
- In the Alloy configuration dialog box, select to either create a token or use an existing token.
- To create a token, enter a token name, then click Create token. The token displays on the screen and is added to the command for running Alloy. Scroll down and copy the command and paste it into your terminal.
- To use an existing token, paste it into the Existing token field. The token is added to the command for running Alloy. Scroll down, copy the command, and paste it into your terminal.
- Click Proceed with the installation.
Configure access for Grafana Alloy to gather Azure Metrics
To export metrics from Azure, Grafana Alloy needs the proper authorization to pull data from your Azure subscriptions.
Click Setup instructions.
Follow the steps to create a service principal with the
Azure Monitoring Readerrole, using the Azure CLI. Creating a service principal using the Azure CLI is just one way to configure authentication to Azure.Alloy uses the Azure SDK for Go. The SDK has multiple options for configuring authentication to Azure, including, but not limited to:
- A service principal with environment variable
- A workload identity
- A managed identity
No matter the option you choose, you must assign the identity to the
Azure Monitoring Readerrole for any Azure subscriptions you want to monitor. Refer to the various options for configuring authentication in Azure documentation.
Configure Alloy
Set up Grafana Alloy to get metrics from Azure Metrics.
Navigate to the configuration file for your Alloy instance. To learn more about where to find the configuration file, refer to Configure Grafana Alloy
Copy and append the following configuration sample to your Alloy configuration file:
 prometheus.exporter.azure "integrations_azure_exporter" {
   subscriptions = ["<subscription_id>"]
   resource_type = "<resource_type>"
   metrics       = ["<metric>"]
   regions       = ["<region>"]
 }

 prometheus.scrape "integrations_azure_exporter" {
   targets    = prometheus.exporter.azure.integrations_azure_exporter.targets
   forward_to = [prometheus.remote_write.metrics_service.receiver]
   job_name   = "integrations/azure_exporter"
 }
Update the following property values in your configuration file based on the values for your Azure instance:
(Optional) Add the following Optional properties in your configuration file using the values for your Azure instance:
Restart Grafana Alloy
Run the command appropriate for your platform to restart Grafana Alloy so your changes can take effect.
Test connection
Click Test connection to test that Grafana Alloy is collecting data and sending it to Grafana Cloud.
View your dashboards and alerts
You can now view:


