
Create SLOs in Grafana Cloud using Frontend Observability signals
This guide describes how to create Service Level Objectives (SLOs), using Time to First Byte (TTFB) being under 800ms as the success criterion.
Transform logs into metrics
Since Frontend Observability signals are stored in Loki as logs, you’ll first transform the logs into metrics using recording rules. After the metrics are available, you can create the SLO using the Grafana Cloud SLO wizard.
Identify relevant logs
Ensure your log entries include fields for TTFB, such as:
ttfb_duration(for example, TTFB time in milliseconds)status_code(for example, HTTP response codes)
Define recording rules
To create an SLO, you need the following metrics:
ttfb_success: Number of successful TTFB observations (for example, those with TTFB < threshold and a 2xx status).ttfb_total: Total number of TTFB observations.
To create the metrics needed for your SLO, use the following LogQL queries as recording rules in your Prometheus configuration.
Define ttfb_success
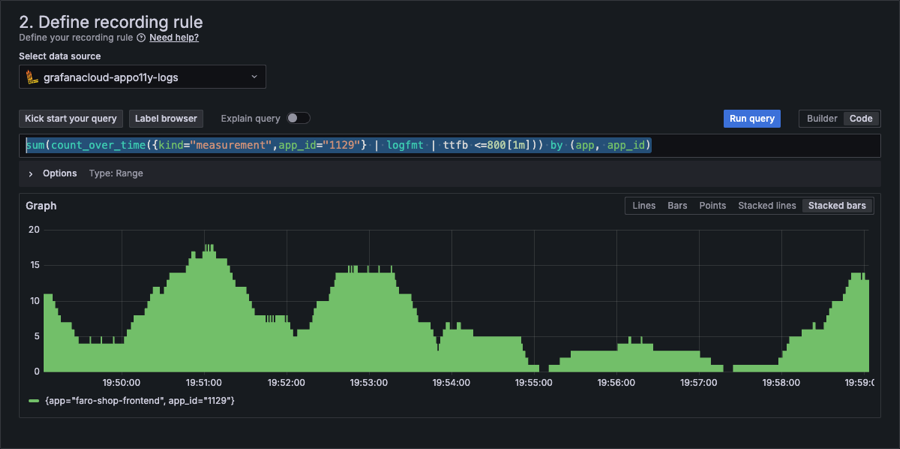
Enter the following code to define your recording rule:
sum(count_over_time({kind="measurement",app_id="1129"} | logfmt | ttfb <=800[1m])) by (app, app_id)where:
kind="measurement": Filters logs to include only those marked as measurementsapp_id="1129": Filters logs for the specific applicationlogfmt: Parses structured log fieldsttfb <= 800: Ensures only logs with TTFB less than or equal to 800ms are consideredcount_over_time: Calculates the count of matching logs over a 1-minute intervalsum by (app, app_id): Aggregates the results by application and application ID
Define ttfb_total
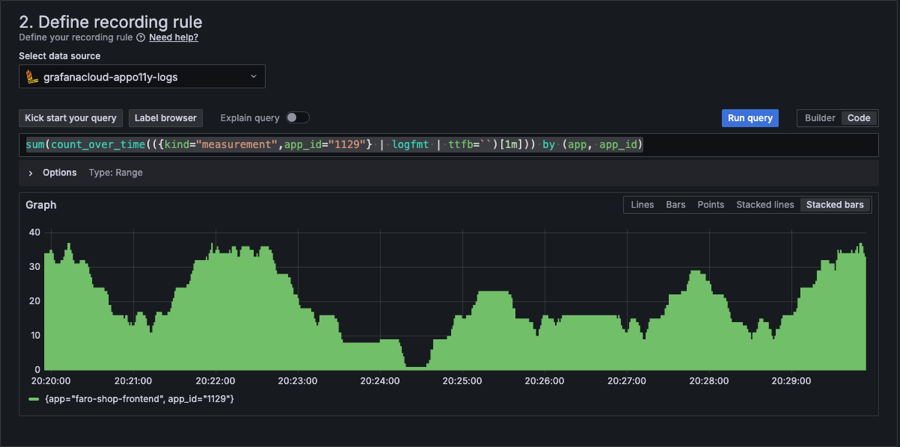
For ttfb_total, count all TTFB observations without filtering for success criteria. Enter the following code to define your recording rule:
sum(count_over_time(({kind="measurement",app_id="1129"} | logfmt | ttfb=``)[1m])) by (app, app_id)where:
kind="measurement": Filters logs to include only those marked as measurementsapp_id="1129": Filters logs for the specific applicationlogfmt: Parses structured log fieldsttfb='': Ensures the TTFB field is present in the log entrycount_over_time: Calculates the count of matching logs over a 1-minute intervalsum by (app, app_id): Aggregates the results by application and application ID
Create the SLO in Grafana Cloud
Use the SLO Wizard to create your SLO.
Open the SLO Wizard
- In Grafana Cloud, navigate to Alerts & IRM > SLO > Manage SLOs. or search “Manage SLOs in the command palette.”
- Click Create SLO to open the wizard.
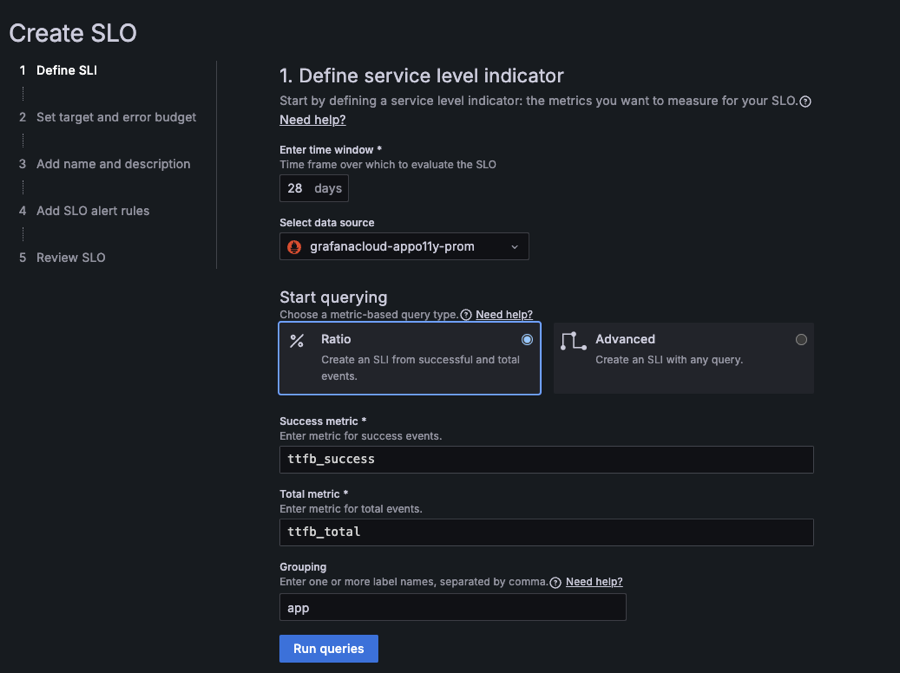
Define the SLO
- Choose the Success and Total Requests (SLI) option.
- Select:
- Success Metric:
ttfb_success - Total Metric:
ttfb_total
- Success Metric:
Set the SLO target
- Define your target percentage for success (for example, 99.5% for SLO compliance).
- Specify the time window (for example, 30 days).
Optional configuration
- Add labels to categorize the SLO (for example,
service="frontend"). - Set custom error budget alerts for proactive monitoring.
Review and Save
- Review the SLO definition.
- Click Create to save the SLO.
Additional notes
- Threshold Adjustments: Ensure the
ttfb_successthreshold aligns with user expectations and SLA requirements. - Validation: Use test queries in Grafana Explore to validate the
ttfb_successandttfb_totalmetrics before creating the SLO. - Scaling: For multiple services or endpoints, customize the service or path labels in recording rules.
The above steps show how you can create effective SLOs in Grafana Cloud, ensuring your frontend performance meets user and business expectations.
Was this page helpful?
Related resources from Grafana Labs


