What's new from Grafana Labs 90-day cost view and network panels in Kubernetes Monitoring
What's new from Grafana Labs
90-day cost view and network panels in Kubernetes Monitoring
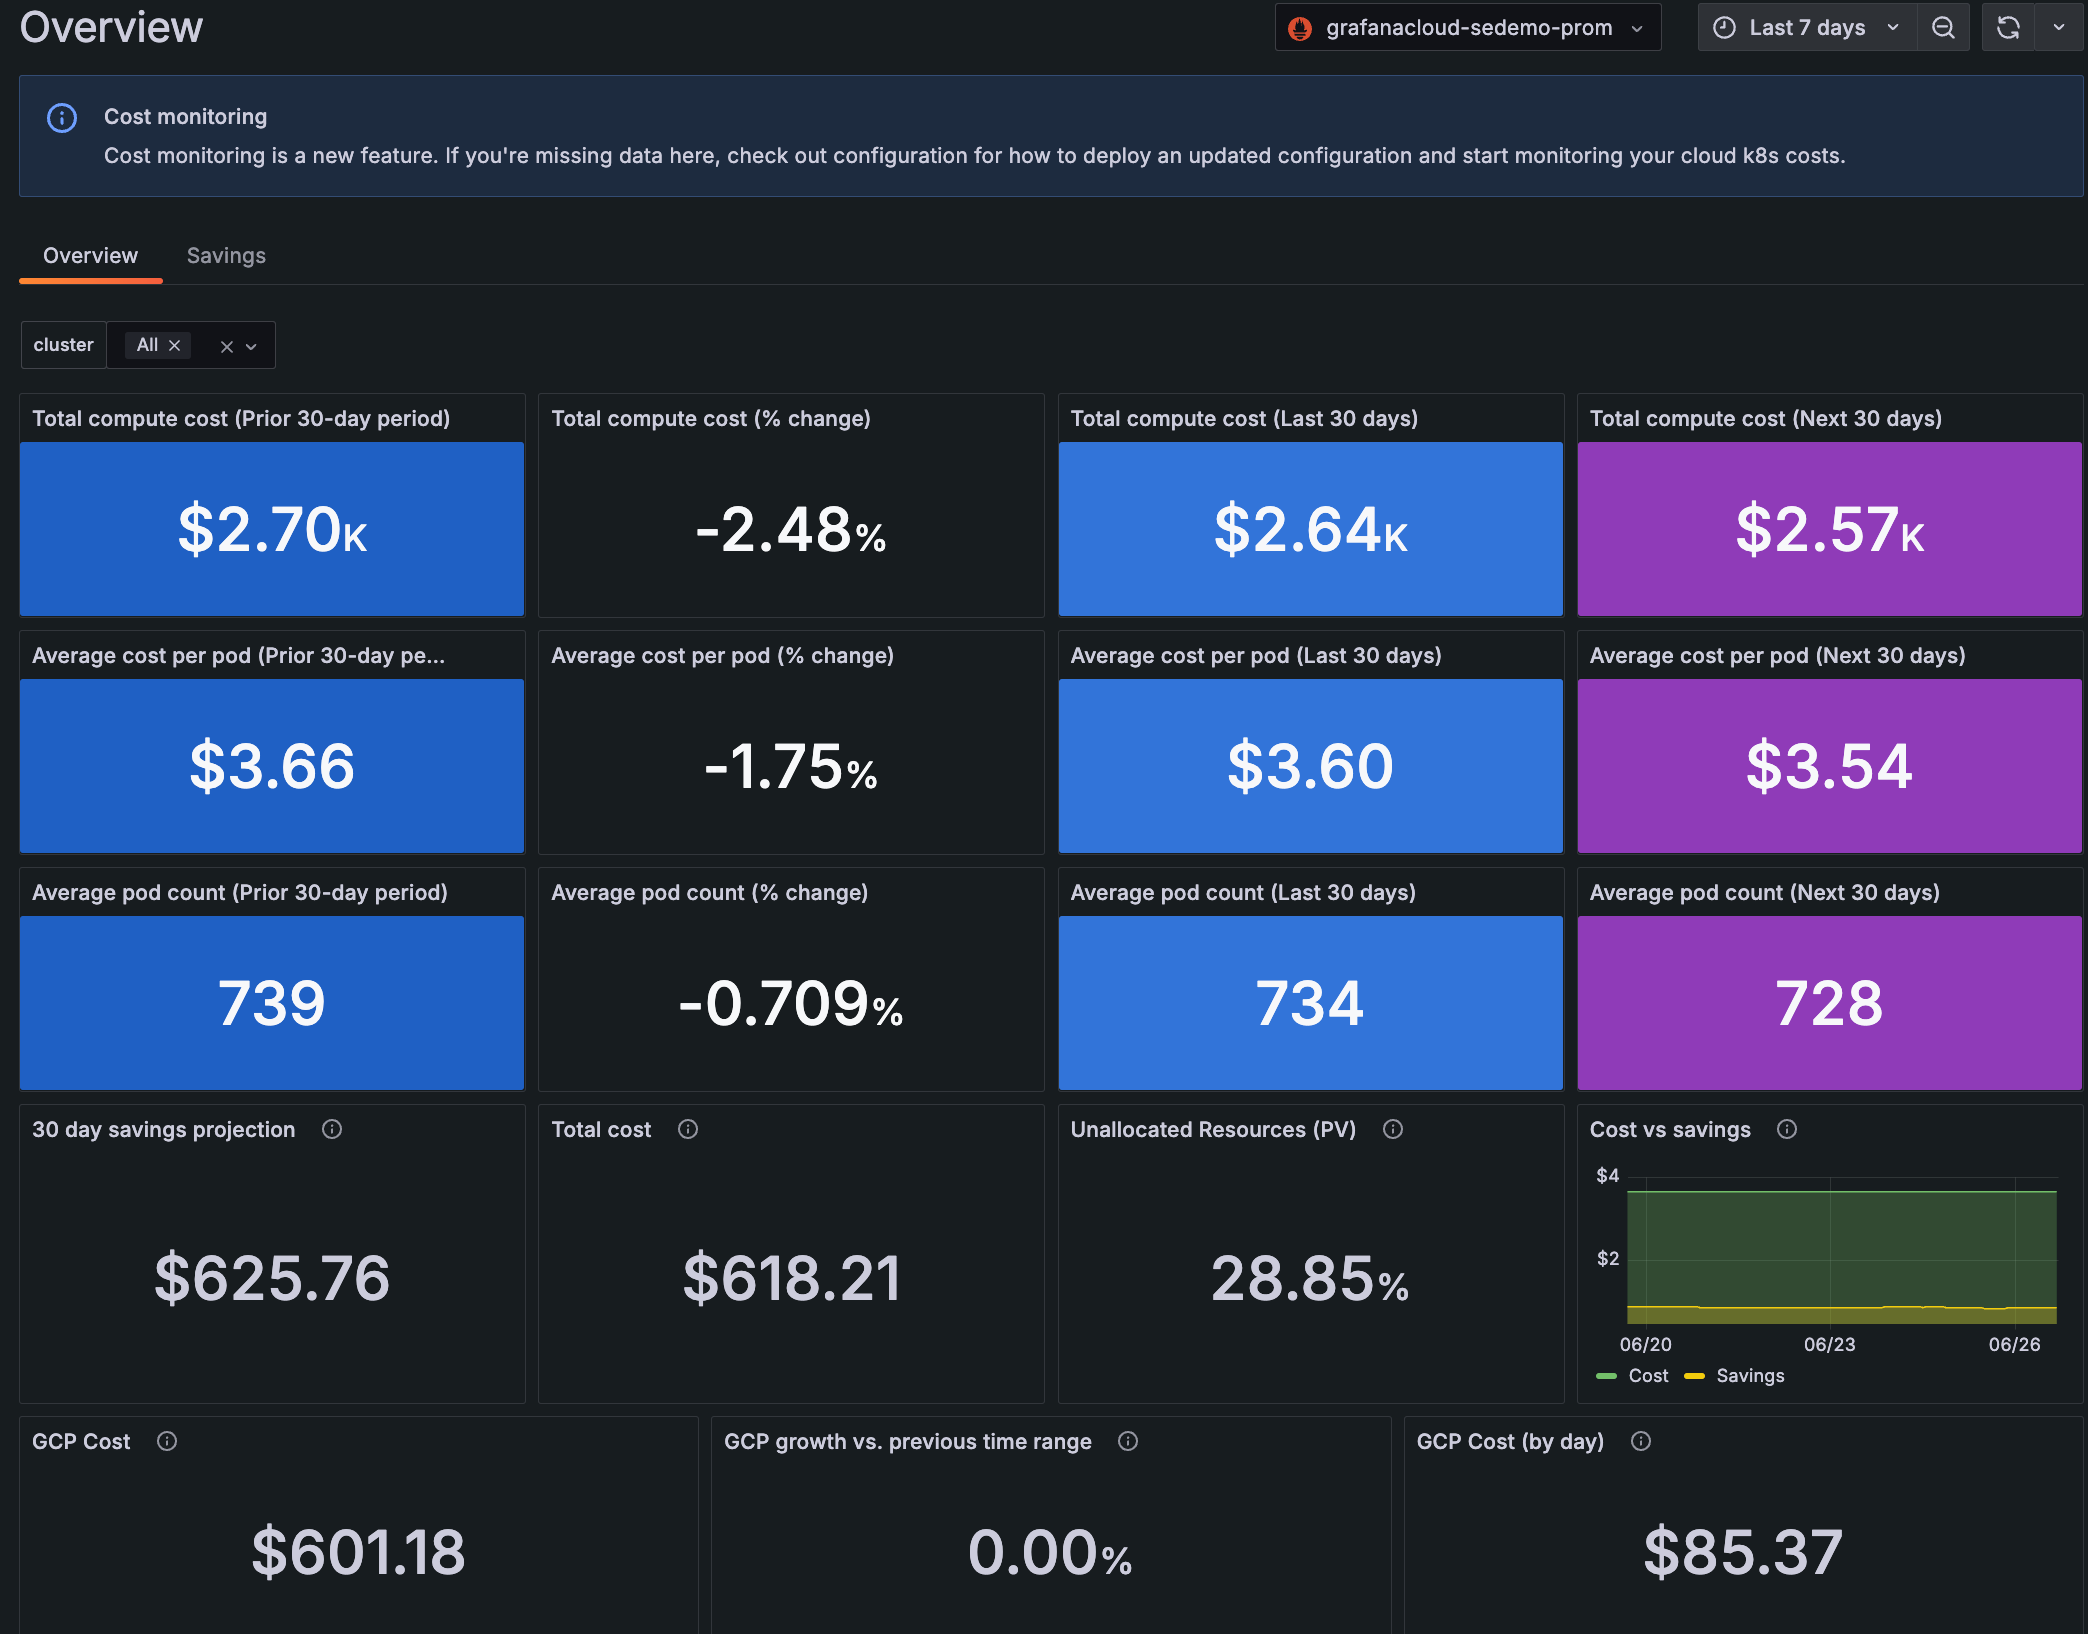
Cost overview tab
Use the Cost Overview tab to see a 90-day view of total compute cost, average cost per Pod, and average Pod count. This 90-day period is divided into the prior 30 days, the last 30 days from the current date, and an estimate of the next 30 days.
Network data
On every detail page for Cluster, namespace, workload, Node, and Pod, you can view network bandwith and saturation data.

Related What's new posts